0341
Combined Angiographic, Structural and Perfusion Radial Imaging using Arterial Spin Labeling1Wellcome Centre for Integrative Neuroimaging (FMRIB), Nuffield Department of Clinical Neurosciences, University of Oxford, Oxford, United Kingdom, 2CFMRI, Department of Radiology, University of California San Diego, San Diego, CA, United States
Synopsis
A Combined Angiographic, Structural and Perfusion Radial Imaging using Arterial Spin Labeling (CASPRIA) pulse sequence is presented which allows the simultaneous acquisition of non-contrast dynamic angiograms, quantitative perfusion maps and multi-contrast T1-weighted structural images within a single six-minute scan. Compared to conventional imaging methods, which took 70% longer to acquire, CASPRIA yielded comparable quantitative perfusion estimates, dynamic (rather than static) angiography with improved distal vessel visibility and structural images with greater contrast flexibility. With further work, the estimation of quantitative tissue T1 values could also be possible.
Introduction
The ability to assess blood flow through the arterial system (angiography) and at the level of the tissue (perfusion) are both crucial in a variety of cerebrovascular diseases. Arterial Spin Labeling (ASL)1,2 can provide both types of information non-invasively, but conventionally these require separate acquisitions, which may not be feasible in a busy clinical protocol. In addition, structural T1-weighted images are often required to assess tissue abnormalities, register the data to a common space and/or correct for partial volume effects3, further increasing the total acquisition time. Recently, an ASL technique was introduced that allowed both angiographic and perfusion information to be obtained in the same scan4,5. However, structural information needed to be separately acquired and the perfusion information was not quantitative. In this work, we build upon this approach to allow angiographic, structural and quantitative perfusion information to be obtained from a single six-minute scan.Sequence Design
In the Combined Angiographic, Structural and Perfusion Radial Imaging using ASL (CASPRIA) pulse sequence (Figure 1), control-label difference data can be reconstructed using a small number of golden ratio ordered6 3D radial spokes, giving high spatial/temporal resolution angiographic information, or using a larger number of spokes and only the central region of k-space, yielding low spatial/temporal resolution perfusion information, as described previously4,5. The addition of a slab-selective FOCI inversion pulse between labeling and imaging reduces the average static tissue signal during the readout, improving the background suppression and reducing physiological noise, whilst also altering the static tissue contrast across time (Figure 2). Reconstruction of averaged control/label data therefore yields structural images with T1-weighted contrast, similar to the MP-RAGE approach7, which varies across time-points. A quadratically varying flip angle (VFA) schedule (2-9°) was also used to improve the perfusion signal at later time points5.Other sequence enhancements included: slice-selective excitation pulses to exclude the labeling plane, preventing static tissue difference signal aliasing into the imaging region; a golden ratio ordering scheme that ensures optimal k-space coverage for any temporal resolution8,9; and a longer labeling duration (1800 ms) to further increase the perfusion signal.
Methods
Four healthy volunteers (1 female, ages 25-44) were scanned on a 3T Siemens Prisma with a CASPRIA protocol (acquisition time 6:02) along with total-time matched conventional perfusion imaging (four-segment 3D-GRASE10 PCASL, multi-postlabeling delay [PLD], 2:30+30s calibration scan) and angiography (3D-multi-slab time-of-flight, 3:04). An additional opposed phase-encoding calibration scan was acquired (30s) for distortion correction. Spatial and temporal resolution were matched, where applicable. A single-delay (1800ms)/white paper11 3D-GRASE perfusion protocol (2:38) was also acquired for comparison, along with a structural MP-RAGE image (TI = 904 ms, 3:40). All CASPRIA and perfusion scans were run twice to assess repeatability.CASPRIA data were reconstructed using L2-regularised cgSENSE12 after phase alignment of the same control-label spokes. Calibration was performed by reconstructing mean control-label data at the same spatial/temporal resolution as the perfusion data, correcting for coil sensitivity variations and extracting the mean time-course within white matter which was fit to a T1 recovery model (accounting for the VFA readout), allowing white matter M0 to be estimated and converted into blood M0 for perfusion quantification. Calibrated data were then fit using a variational-Bayesian algorithm13, incorporating a macrovascular component14, modified to account for signal attenuation and scaling from the VFA readout.
3D-GRASE multi-delay data were motion corrected and analyzed in a similar manner. Single-delay data were quantified using voxelwise calibration, as per recommendations11. Repeatability of quantitative CBF estimates were assessed using the coefficient of determination (R2) from linear regression between the repeat scans after registration to structural space.
Results
Example CASPRIA angiographic images are compared with conventional TOF data in Figure 3. Dynamic blood flow patterns are clearly depicted and distal vessel visibility is much clearer due to the subtraction of static tissue signal.CASPRIA perfusion images show very similar features to the multi-delay 3D-GRASE data (Figure 4), although macrovascular signal is more prominent due to the lack of crusher gradients associated with refocusing pulses in 3D-GRASE. Some minor segmentation and through-slice blurring artefacts are evident in the 3D-GRASE data, which are avoided in CASPRIA. Repeatability of CBF estimates across multiple scans were not significantly different across all subjects between the three approaches, although some scaling differences are apparent, perhaps due to differences in the calibration procedures.
CASPRIA structural images reconstructed at different time points (Figure 5) show a variety of tissue contrasts, with later time points showing structural information comparable to conventional MP-RAGE data.
Discussion and Conclusions
CASPRIA allows simultaneous dynamic 4D angiography, multi-delay perfusion and multi-contrast structural imaging in a single six-minute scan. Distal vessel visibility is much better than conventional TOF angiography, perfusion information is comparable to conventional 3D-GRASE and structural information is more extensive than conventional single-TI MP-RAGE, even though the conventional scans would take 70% longer to acquire separately.However, further work is required to investigate quantitative CBF differences between CASPRIA and 3D-GRASE, extract quantitative metrics from the angiographic data15,16 and optimize the structural image processing. This will include incorporating angiographic information as a macrovascular prior for perfusion fitting, B1+ corrections and extracting quantitative tissue T1 estimates from the structural data, which could also be used to improve perfusion quantification.
Acknowledgements
TO was supported by a Sir Henry Dale Fellowship jointly funded by the Wellcome Trust and the Royal Society (Grant Number 220204/Z/20/Z). MC was supported by the Royal Academy of Engineering (RF201617\16\23). The Wellcome Centre for Integrative Neuroimaging is supported by core funding from the Wellcome Trust (203139/Z/16/Z).References
1. Detre JA, Leigh JS, Williams DS, Koretsky AP. Perfusion imaging. Magn Reson Med 1992;23:37–45.
2. Williams DS, Detre JA, Leigh JS, Koretsky AP. Magnetic resonance imaging of perfusion using spin inversion of arterial water. Proc. Natl. Acad. Sci. U. S. A. 1992;89:212–6.
3. Chappell MA, Groves AR, MacIntosh BJ, Donahue MJ, Jezzard P, Woolrich MW. Partial volume correction of multiple inversion time arterial spin labeling MRI data. Magn. Reson. Med. 2011;65:1173–1183.
4. Okell TW. Combined angiography and perfusion using radial imaging and arterial spin labeling. Magn. Reson. Med. 2019;81:182–194.
5. Okell TW. 4D Combined Angiography and Perfusion using Radial Imaging and Arterial Spin Labeling. In: Proceedings 25th Scientific Meeting, ISMRM. Hawaii, USA; 2017. p. 675.
6. Chan RW, Ramsay EA, Cunningham CH, Plewes DB. Temporal stability of adaptive 3D radial MRI using multidimensional golden means. Magn Reson Med 2009;61:354–363.
7. Mugler 3rd JP, Brookeman JR. Three-dimensional magnetization-prepared rapid gradient-echo imaging (3D MP RAGE). Magn Reson Med 1990;15:152–157.
8. Song HK, Yan L, Smith RX, et al. Noncontrast enhanced four-dimensional dynamic MRA with golden angle radial acquisition and K-space weighted image contrast (KWIC) reconstruction. Magn Reson Med 2014;72:1541–1551.
9. van der Plas MCE, Schmid S, Versluis MJ, Okell TW, Osch MJP van. Time-encoded golden angle radial arterial spin labeling: Simultaneous acquisition of angiography and perfusion data. NMR Biomed. 2021;34:e4519.
10. Günther M, Oshio K, Feinberg DA. Single-shot 3D imaging techniques improve arterial spin labeling perfusion measurements. Magn. Reson. Med. 2005;54:491–498.
11. Alsop DC, Detre JA, Golay X, et al. Recommended implementation of Arterial Spin-Labeled perfusion MRI for clinical applications: A consensus of the ISMRM Perfusion Study group and the European consortium for ASL in dementia. Magn. Reson. Med. 2015;73:102–116.
12. Pruessmann KP, Weiger M, Börnert P, Boesiger P. Advances in sensitivity encoding with arbitrary k-space trajectories. Magn. Reson. Med. 2001;46:638–651.
13. Chappell MA, Groves AR, Whitcher B, Woolrich MW. Variational Bayesian Inference for a Nonlinear Forward Model. IEEE Trans. Signal Process. 2009;57:223–236.
14. Chappell MA, MacIntosh BJ, Donahue MJ, Günther M, Jezzard P, Woolrich MW. Separation of macrovascular signal in multi-inversion time arterial spin labelling MRI. Magn. Reson. Med. 2010;63:1357–1365.
15. Okell TW, Chappell MA, Schulz UG, Jezzard P. A kinetic model for vessel-encoded dynamic angiography with arterial spin labeling. Magn. Reson. Med. 2012;68:969–979.
16. Okell TW, Chappell MA, Jezzard P. A theoretical framework for quantifying blood volume flow rate from dynamic angiographic data and application to vessel-encoded arterial spin labeling MRI. Med. Image Anal. 2013;17:1025–1036.
Figures
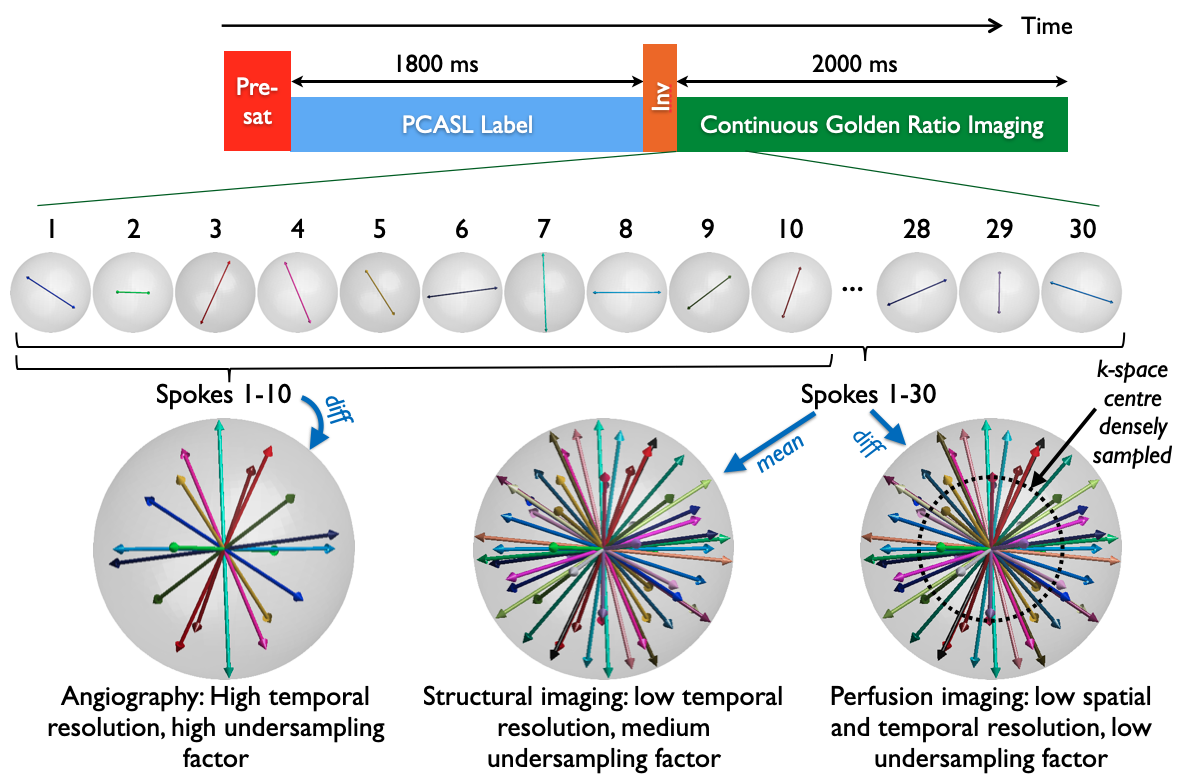
Figure 1: CASPRIA pulse sequence schematic. The pre-saturation and single inversion pulse either side of the pseudocontinuous ASL (PCASL) module provide background suppression and structural contrast. The golden ratio 3D radial readout allows flexible reconstruction: control-label difference data can be reconstructed at high spatial/temporal resolution for angiography or low spatial/temporal resolution for perfusion imaging. Mean control-label data can be reconstructed to give structural images.
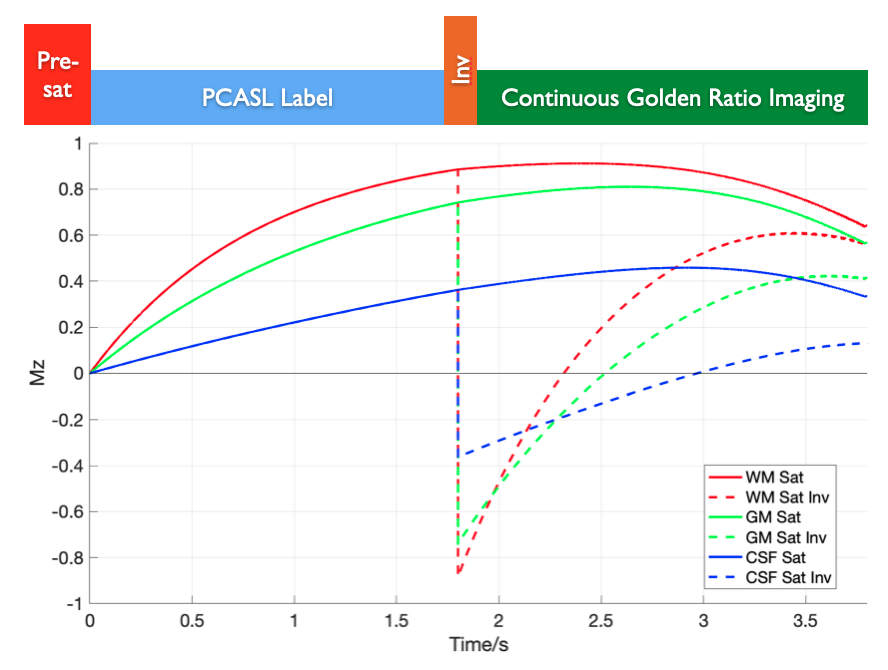
Figure 2: Simulation of static tissue signals in CASPRIA. Gray matter (GM), white matter (WM) and cerebrospinal fluid (CSF) are simulated with pre-saturation only (“Sat”) and with the addition of a single inversion pulse between PCASL labeling and the variable flip angle readout (“Sat Inv”). The addition of the inversion pulse gives greatly reduced static tissue signal during the readout, as well as providing varying static tissue contrast at different time points.
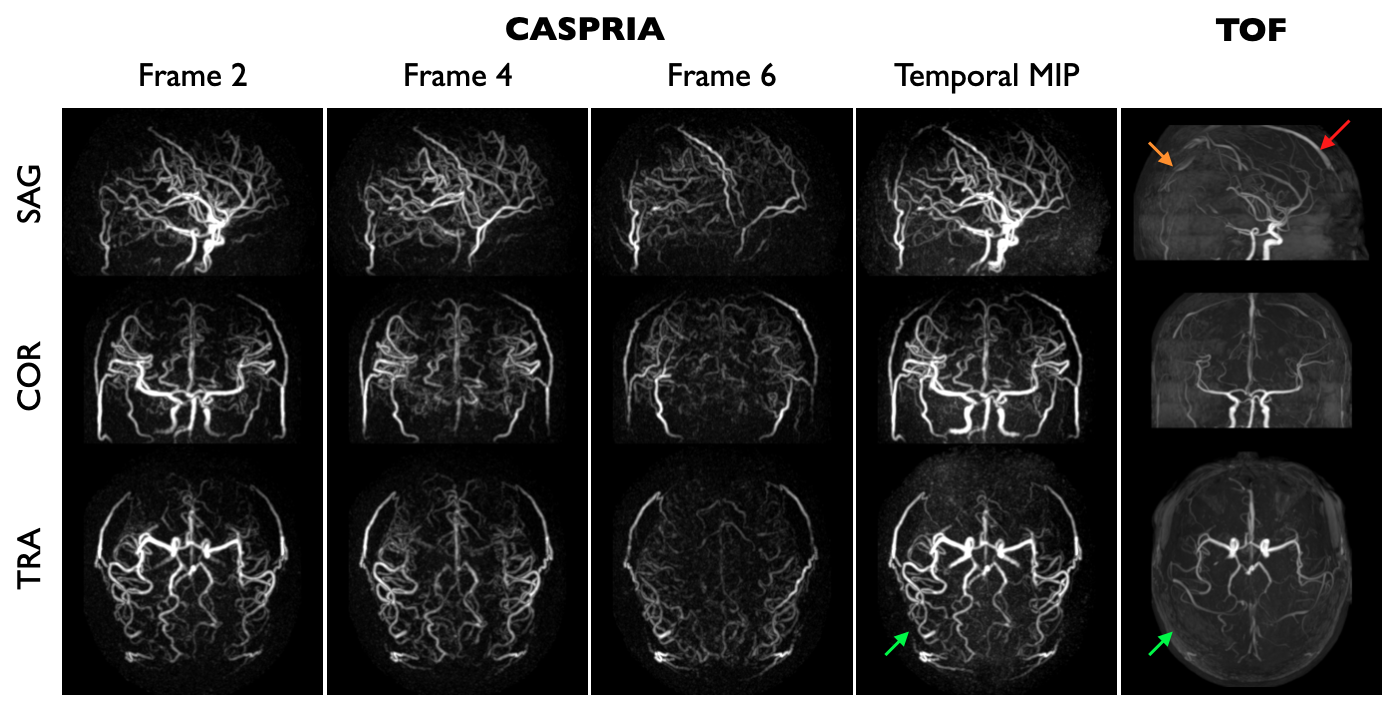
Figure 3: Angiographic data: maximum intensity projections (MIPs) of selected frames from the CASPRIA angiographic reconstruction (1.1mm isotropic, 164 ms temporal resolution, 57x undersampled) are shown along with a temporal MIP and the TOF data from one subject. Note the improved distal vessel visibility with CASPRIA (green arrows) as well as the lack of slab boundary artefacts (orange arrow) and venous contamination (red arrow) evident in the TOF data.
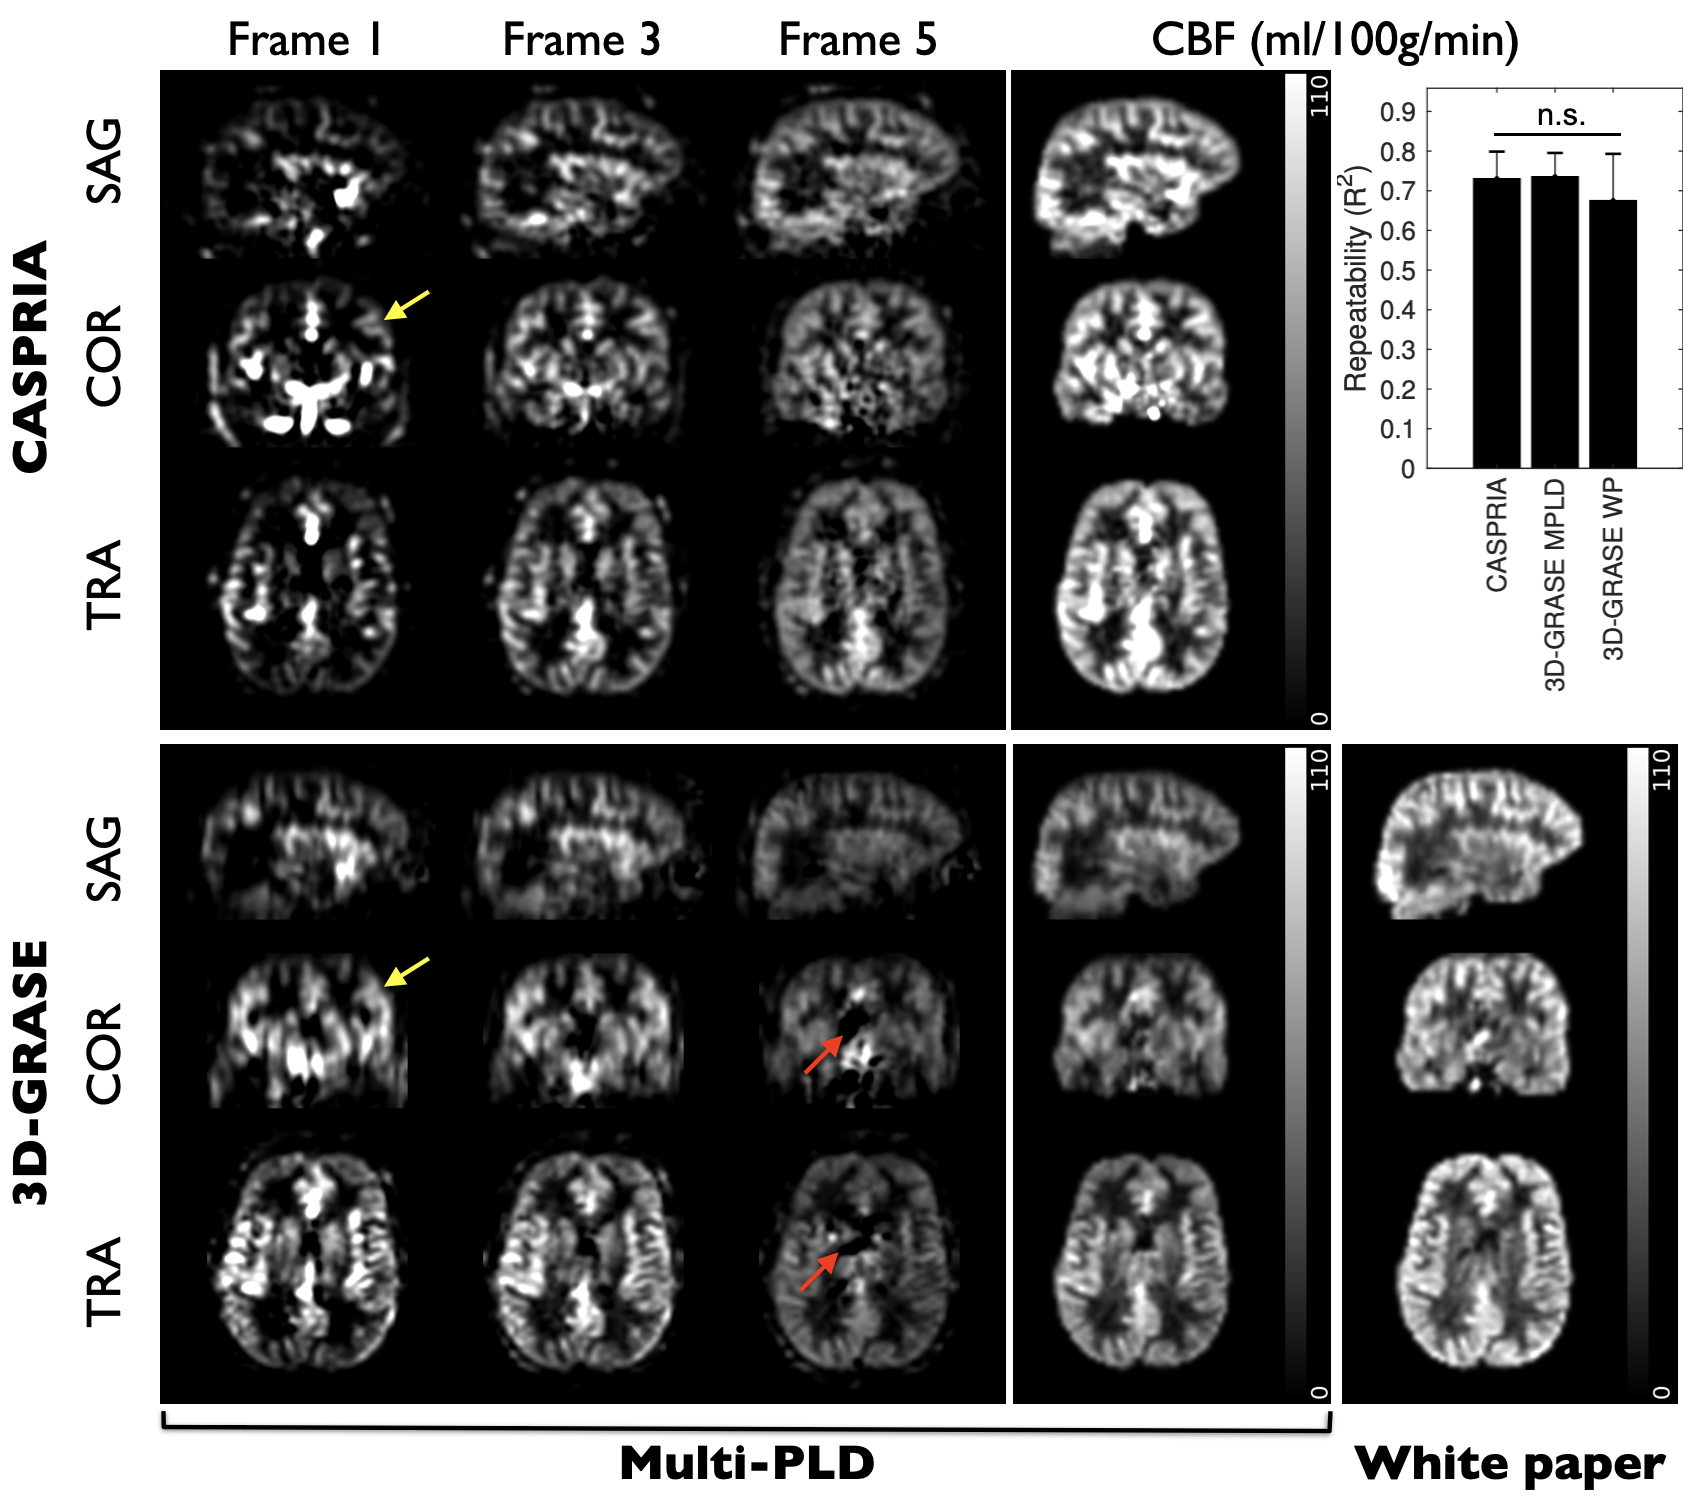
Figure 4: CASPRIA perfusion images (3.1 mm isotropic, 327 ms temporal resolution, 3.8x undersampled) and multi-delay 3D-GRASE data show similar blood flow dynamics, although some 3D-GRASE segmentation artefacts (red arrows) and minor through-slice blurring (yellow arrows) are evident. Quantitative CBF maps, including those from the single-delay white paper (“WP”) 3D-GRASE protocol, reveal similar features with slight scaling differences. Repeatability is very similar (n.s. = not significant).
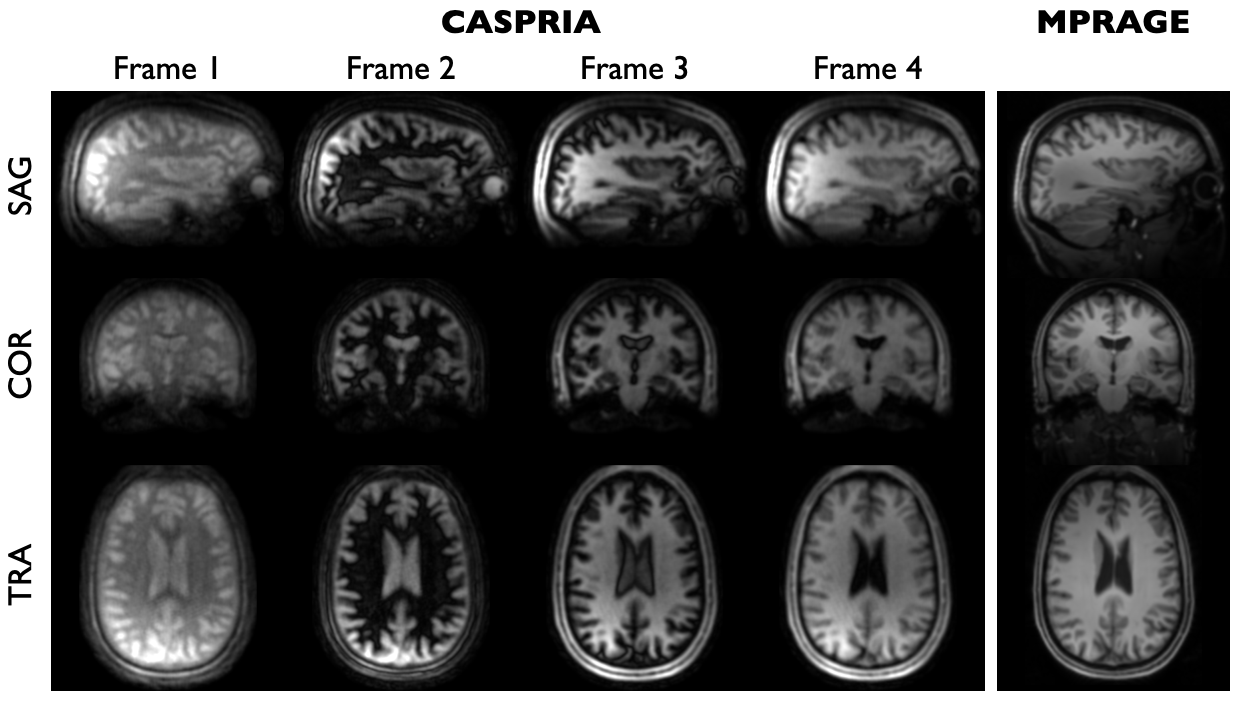
Figure 5: Example frames from the CASPRIA structural reconstruction (1.1 mm isotropic, 327 ms temporal resolution, 29x undersampled) showing the evolution of the tissue contrast across time, as expected from the simulations shown in Figure 2. Each frame is separately scaled. The conventional MPRAGE image is shown on the right for comparison.