0339
Development of perfusion technique with dynamic BOLD MRI and transient hypoxia in mouse1Department of Biomedical Engineering, Sungkyunkwan University, Suwon, Republic of Korea, Center for Neuroscience Imaging Research (CNIR), Institute for Basic Science (IBS), Suwon, Republic of Korea, Suwon, Korea, Republic of, 2Center for Neuroscience Imaging Research (CNIR), Institute for Basic Science (IBS), Suwon, Republic of Korea, Suwon, Korea, Republic of
Synopsis
Tissue perfusion can be measured by arterial spin labeling and dynamic susceptibility contrast (DSC) method. However, these methods cannot be easily applied to mouse. Alternatively, a bolus of paramagnetic deoxyhemoglobin induced by transient hypoxia may be used as an endogenous blood pool contrast agent. Dynamic BOLD MRI with hypoxic challenge was adopted in mice. A stimulus duration was determined, and its impact to animal physiology was investigated. With corrected arterial input function, quantitative CBF and CBV were determined. Overall, we successfully developed a technique with BOLD MRI and transient hypoxia.
INTRODUCTION
Perfusion is critically important for delivering oxygen and metabolites and removing wastes. To measure perfusion noninvasively, two MR approaches have been widely adopted, arterial spin labeling1-3 and dynamic susceptibility contrast (DSC)4-7. However, these two methods cannot be readily applied to mouse brain research due to its small body size-related issues and/or low sensitivity. To overcome this issue, short hypoxia stimulus was exploited for utilizing a bolus of paramagnetic deoxyhemoglobin as an endogenous contrast agent7. Adopting the hypoxic challenge for mouse research requires careful evaluation of various factors such as stimulation duration, physiological perturbation, and quantification. Here, we built hypoxia protocol at 9.4T MRI, and evaluated various physiological parameters associated with hypoxic challenge. Then, cerebral perfusion was quantified by modeling blood oxygenation level dependent (BOLD) dynamics during the passage of short transient hypoxia in normal mice.METHODS
Theory:To quantify perfusion values from dynamic BOLD responses, we adopted the DSC theory4,5,7. The change in deoxyhemoglobin concentration C(t) is directly related to △R*2 (t), C(t) is simply denoted to ΔR*2(t):
$$C(t) = \triangle R_2^*(t) = \frac{1}{k}.CBF.(C_{a}(t)\otimes R(t))$$ (1)
where Ca(t) is the arterial input function (AIF); R(t) is the tissue residue function; ⊗ indicates the convolution operation; and k is constant.
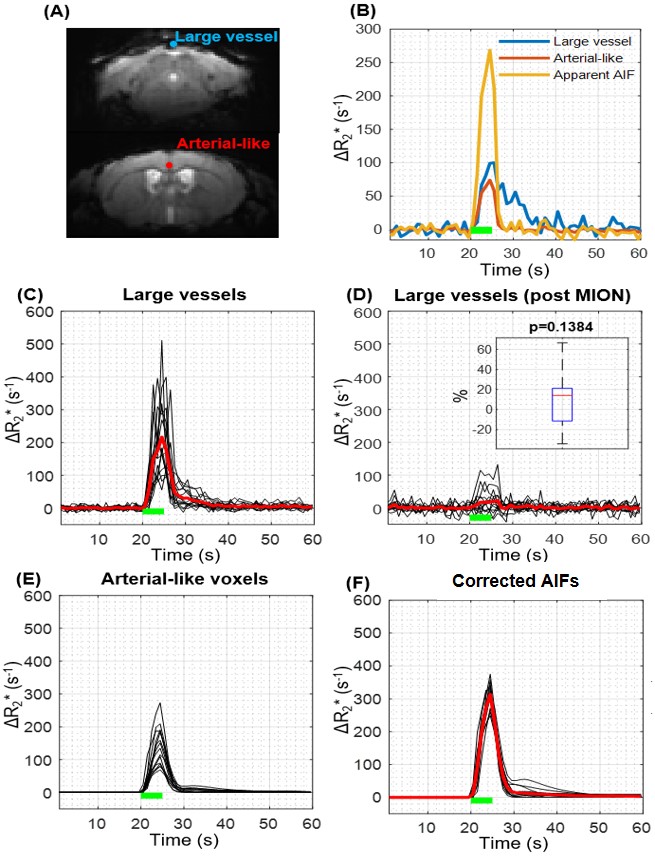
Since AIF cannot be accurately determined due to limited spatial resolution relative to arterial vessel size5-8, the partial volume effect (PVE) can be removed by scaling the response of partial volume-affected arterial-like vessel with that of no partial volume large vessels. Thus, the large blood vessel voxel with the largest value in the area under the ΔR2* curve was selected, assuming that △R*2,large vessel(t) originates only from the blood pool. Then, the time integral of the arterial voxel ΔR2*(t) was scaled to match that of the large vessel voxel:
$$ C_{a}(t) = \triangle R_2,artery^*(t).\frac{\int_{}^{}\triangle R_2,large vessel^*(t) }{\int_{}^{} \triangle R_2,artery^*(t)}$$ (2)
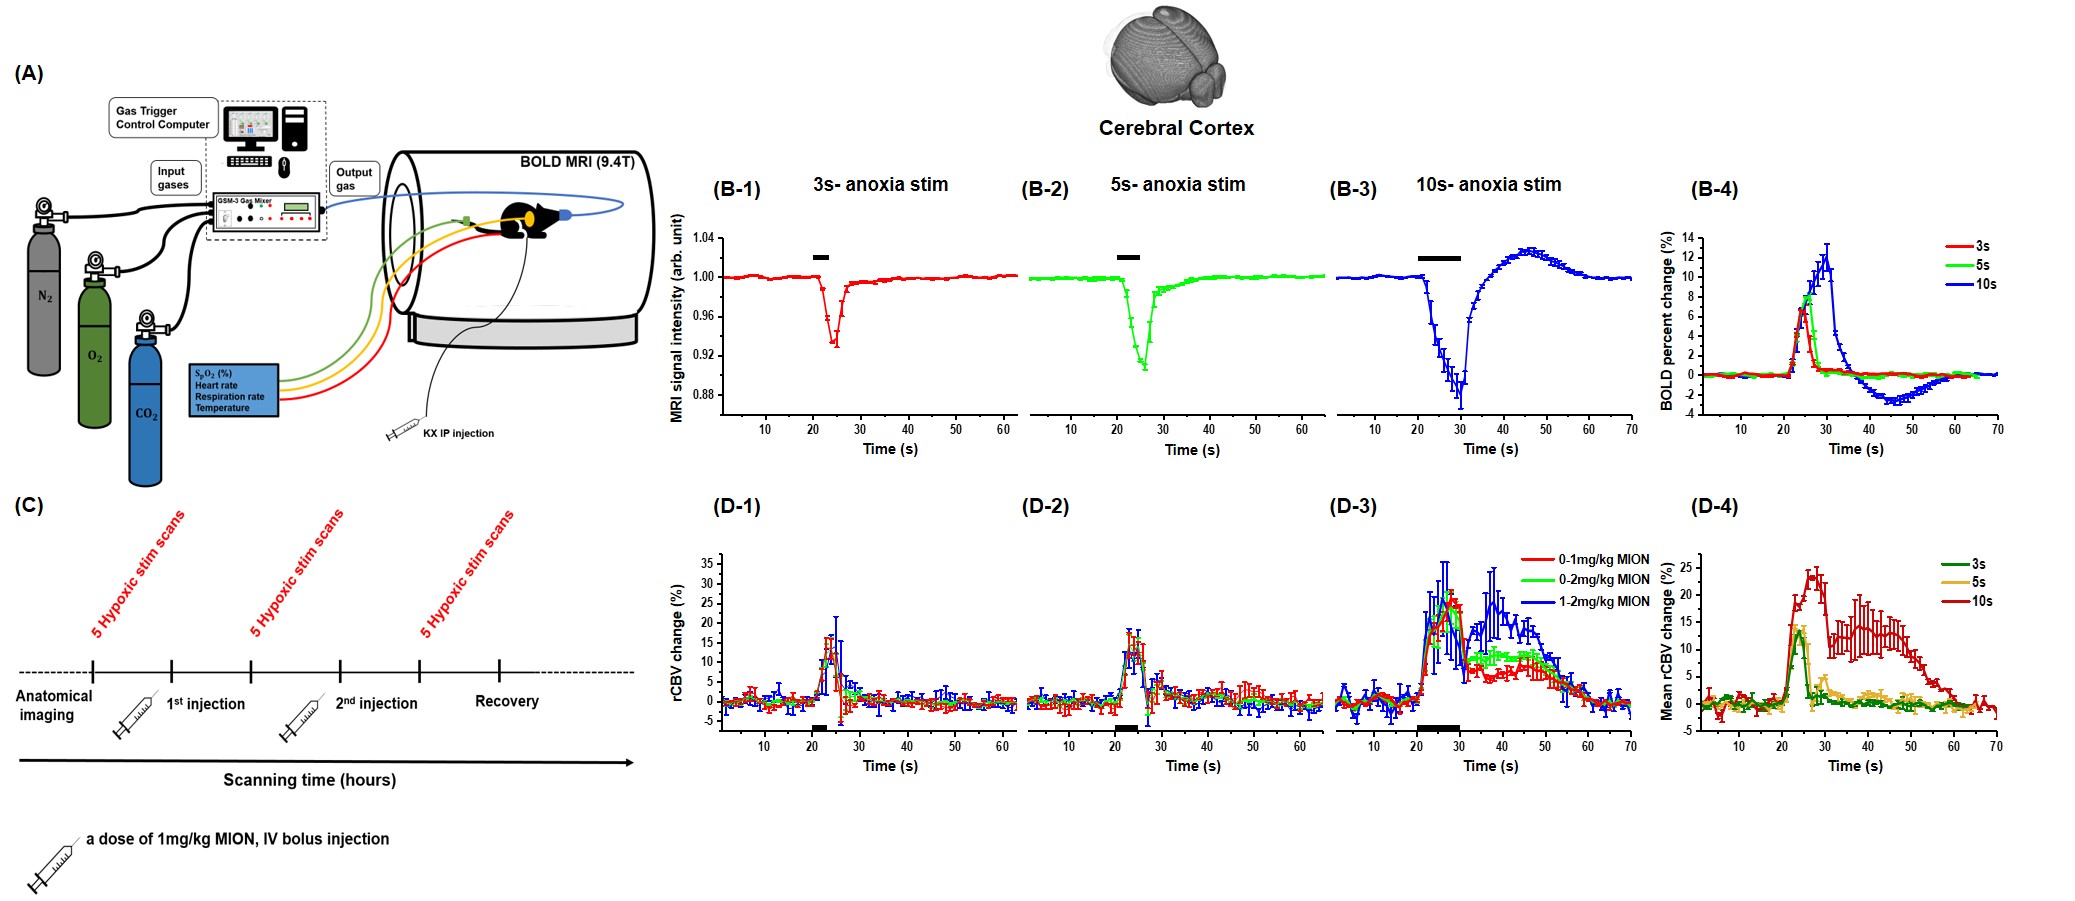
BOLD MRI: C57BL/6 mice were anesthetized with ketamine/xylazine9. BOLD MRI were acquired on a 9.4T MRI using GE-EPI sequence with: TR/TE = 1000/11ms, 156x156x500 μm3 resolution, 20 slices.
Transient hypoxia was induced by switching the FiO2 level from 44% (baseline) to 0% (Fig. 1.A). Then, a block stimulus of hypoxia was applied. Two experiments were performed. 1) three stimulus durations of 3, 5, and 10s were studied (n=9). 2) To quantify the relative CBV change, 1 μg Fe/g MION was introduced via tail vein two times (Fig. 1.C) (n=6).
RESULTS
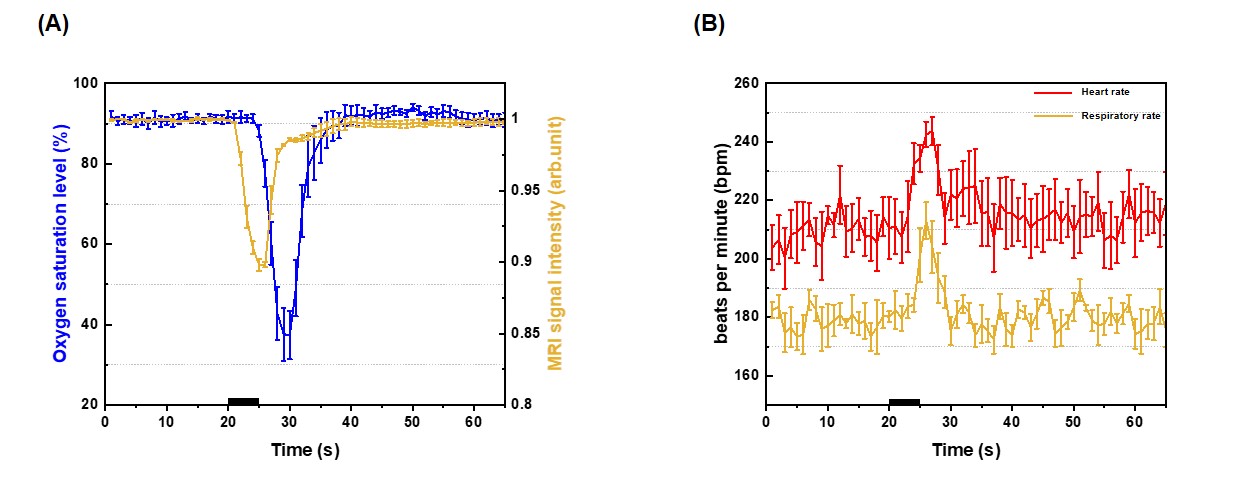
Characterization of stimulus duration: During hypoxic stimulation, the BOLD signal decreased larger for longer stimulation due to a larger decrease in oxygen saturation level. Interestingly, the post-stimulus overshoot was observed for 10 s stimulus, which may be due to sustained increase in blood volume (Fig. 1.B). Transient 3s and 5s-hypoxia stimulus induced the relative CBV increase of 11.56±1.65% and 13.34±1.05% , and quickly returned to the pre-stimulus baseline. However, the 10s hypoxia stimulus induced a large change of 22.57±0.94%, which was prolonged for 30 s (Fig 1.D). To obtain a certain number of dynamic data points for AIF estimation, 5s-hypoxia was selected over 3 s hypoxia for further perfusion measurements.The 5s-hypoxia challenge induced the delayed peripheral oxygen saturation level (SpO2) measured at the tail (Fig. 2A). Then, we determined arterial oxygen saturation level (SaO2) from BOLD MRI at the steady state condition, it decreased to ~56% during 5s-hypoxia. Heart rate increased from 210 to 240 bpm and respiration increased from 180 to 230 bpm (Fig. 2B).
Quantification of perfusion: The arterial-like and large vessels were found and its ΔR2* curves were obtained (Fig. 3.A, B). To confirm that the BOLD signal from large vessel voxels mostly originates from the intravascular pool, we injected MION. The area under the large vessel curve decreased by 87.9±7.7% after MION injection, indicating that the PVE for large vessel voxels was negligible (Fig. 3.C,D). The corrected AIF showed consistent peak sizes and curve shapes (Fig. 3F), indicating that PVE correction is effective.
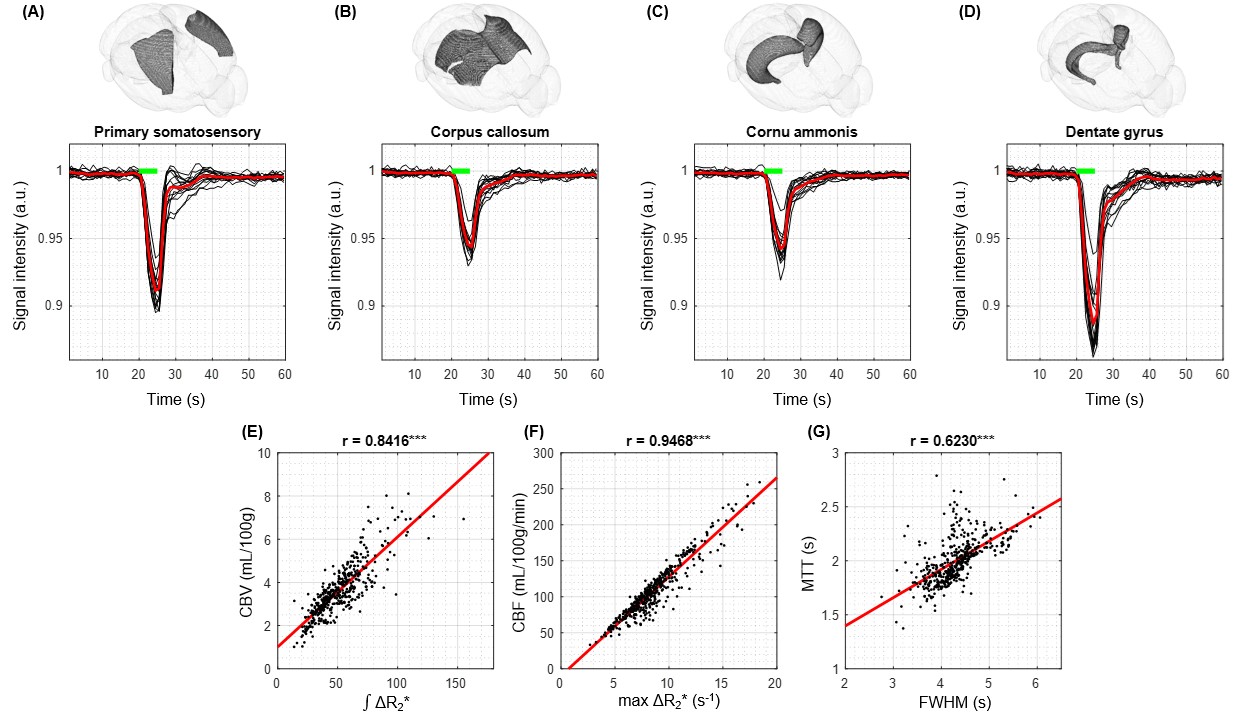
The representative brain regions were selected in 15 mice (Fig. 4A-D). Their BOLD responses to 5-s hypoxic challenge are consistent across all mice. CBF was calculated with Eq. 1, CBV was determined from integration of BOLD curves, and mean transit time (MTT) was determined from CBF and CBV. Quantitative perfusion parameters (CBV, CBF, and MTT) were well correlated with qualitative perfusion parameters (∫ΔR2*, max ΔR2*, and FWHM) (Fig. 4E-G). These indicate that qualitative parameters can be used to determine relative values among regions.
DISCUSSION AND CONCLUSION
We developed an approach using short transient hypoxic stimulation for non-invasive perfusion measurement in mouse. A short period of 5s hypoxia was utilized for obtaining sufficient sensitivity and AIF estimation. Since the BOLD signal is sensitive to oxygen saturation level, blood volume, and hematocrit level, the quantification of perfusion requires that 1) the BOLD response (ΔR2*) is linearly related to oxygen saturation level change, and 2) CBV or hematocrit level does not change. In the 5-s hypoxia stimulus, CBV increases ~10%, causing an overestimation of quantitative CBV. The hematocrit level difference between macrovessels and microvessels was considered in Eq. 1. Overall, a simple perfusion MRI technique with dynamic BOLD MRI and transient hypoxia does not require any sophisticated pulse sequence, hardware, or catherization, thus it is implementable for whole-brain perfusion mapping in rodents.Acknowledgements
This research was supported by the Institute of Basic Science (IBS-R015-D1).References
1. Wong, E. C., Buxton, R. B. & Frank, L. R., et al. Implementation of quantitative perfusion imaging techniques for functional brain mapping using pulsed arterial spin labeling. NMR in Biomedicine: An International Journal Devoted to the Development and Application of Magnetic Resonance In Vivo. 1997; 10(4-5): 237-249.
2. Wong, E. C., Buxton, R. B. & Frank, L. R., et al. A theoretical and experimental comparison of continuous and pulsed arterial spin labeling techniques for quantitative perfusion imaging. Magnetic resonance in medicine. 1998; 40(3): 348-355.
3. Golay, X., Hendrikse, J. & Lim, T. C., et al. Perfusion imaging using arterial spin labeling. Topics in Magnetic Resonance Imaging. 2004; 15(1): 10-27.
4. Østergaard, L., et al. High resolution measurement of cerebral blood flow using intravascular tracer bolus passages. Part I: Mathematical approach and statistical analysis. Magnetic Resonance in Medicine. 1996; 36(5): 715-725.
5. L, Ø., et al. Principles of cerebral perfusion imaging by bolus tracking. J Magn Reson Imaging. 2005; 22(6):710-717.
6. Calamante F, G. D., Connelly A., et al. Quantification of perfusion using bolus tracking magnetic resonance imaging in stroke: assumptions, limitations, and potential implications for clinical use. Stroke. 2002; 33(4): 1146-1151.
7. Vu C, C. Y., Coloigner J, Nederveen AJ, Borzage M, Bush A, Wood JC., et al. Quantitative perfusion mapping with induced transient hypoxia using BOLD MRI. Magn Reson Med. 2021; 85(1): 168-181.
8. Calamante, F., et al. Arterial input function in perfusion MRI: a comprehensive review. Progress in nuclear magnetic resonance spectroscopy. 2013; 74: 1-32.
9. You, T., Im, G. H. & Kim, S. G., et al. Characterization of brain-wide somatosensory BOLD fMRI in mice under dexmedetomidine/isoflurane and ketamine/xylazine. Sci Rep. 2021; 11:13110.
Figures