0338
Subject-specific optimization of background suppression for arterial spin labeling MRI using a real-time feedback loop on the scanner1Leiden University Medical Center, Leiden, Netherlands, 2Philips, Best, Netherlands
Synopsis
Background suppression (BGS) in arterial spin labeling (ASL) leads to perfusion images with a higher temporal signal-to-noise ratio (tSNR) compared to ASL without BGS. The optimal inversion times (TIs), and therefore the quality of the BGS, depend on the T1 relaxation times of the underlying tissue and on inhomogeneities of the scanner’s magnetic fields (B0, B1+). In this work, we designed and implemented a feedback mechanism that optimized the quality of background suppression in real time on the scanner. The results show an increased tSNR for the subject-specific optimization of BGS compared to standard BGS in 12 healthy volunteers.
Introduction
Suppression of background signal in arterial spin labeling (ASL) leads to perfusion images with a higher temporal signal-to-noise ratio (tSNR) compared to ASL without background suppression (BGS)1. BGS is obtained by applying multiple inversion pulses before and during the post-label delay (PLD). The optimal inversion times (TIs), and therefore the quality of the BGS, depend on the T1 relaxation times of the underlying tissue and on inhomogeneities of the scanner’s magnetic fields (B0, B1+)2. These parameters differ between subjects3 and can therefore result in inter-subject variability of image quality. Nevertheless, current ASL protocols use one set of predefined inversion times for all subjects, because these inter-scan variations are not known at the start of the exam. This means that the quality of the resulting perfusion images is not optimal for all subjects. In this work, we designed and implemented a feedback mechanism that optimized the quality of single-slice ASL perfusion images in real time on the scanner. Specifically, we optimized the timings of four BGS pulses by minimizing the signal intensity in the label image, while maximizing the perfusion signal. By doing this, we aimed to improve the performance of the BGS and therefore the tSNR of the perfusion images.Methods
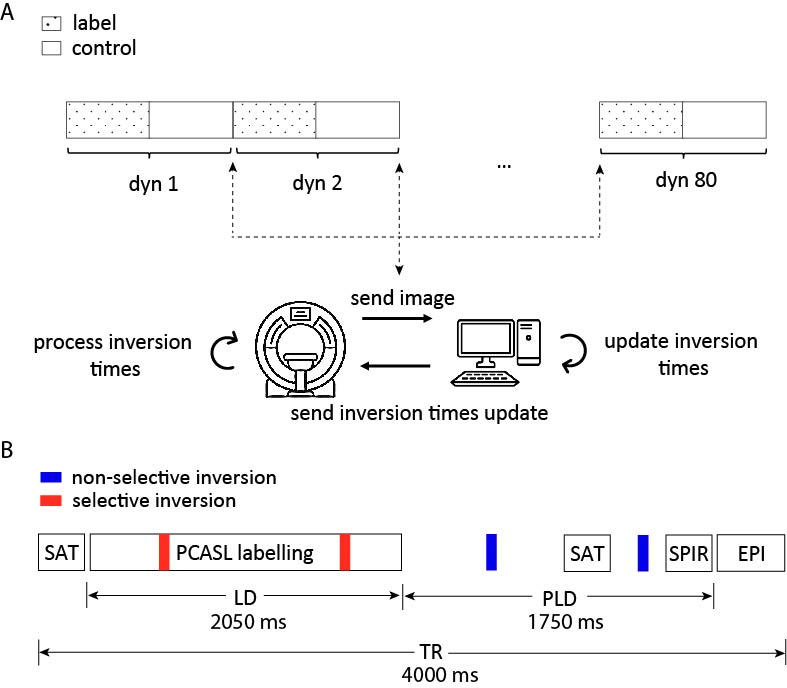
Feedback mechanism: After each dynamic, label/control images were sent to an external computer via the remote connection software XTC (Philips, NL)4. On this computer, a Python tool receives and processes the images in real time. Updated TIs were sent back to the scanner and imported during scanning (Fig. 1A).Data acquisition: Experiments were performed in 12 subjects (informed consent obtained), using a 3T MR system (Philips, NL) with a 32-channel head coil. PCASL data were acquired with a single-shot EPI readout: label duration/PLD=2050/1750ms, TE/TR=17/4000ms, scan time = 10 min (Fig. 1B). Initial TI (683/1948/2980/3597ms) were optimized via simulations for suppression of CSF, gray matter, white matter and corpus callosum.
TI optimization: 4 TIs (2 during labelling, 2 after) were optimized in real-time using Nelder-Mead5 (80 dynamics), such that the label signal was minimized while maximizing the perfusion signal to avoid magnitude subtraction errors for near-optimal BGS, i.e.
$$\hat{\text{TI}}=\text{argmin}_{\text{TI}}||\mathbf{u_L}(\text{TI})||_2-\lambda||\mathbf{u_C}-\mathbf{u_L}||_2,$$
with $$$\mathbf{u_{L/C}}$$$ the label/control image obtained with $$$\text{TI} = [\text{TI}_1,\text{TI}_2,\text{TI}_3,\text{TI}_4]^T$$$.
Results
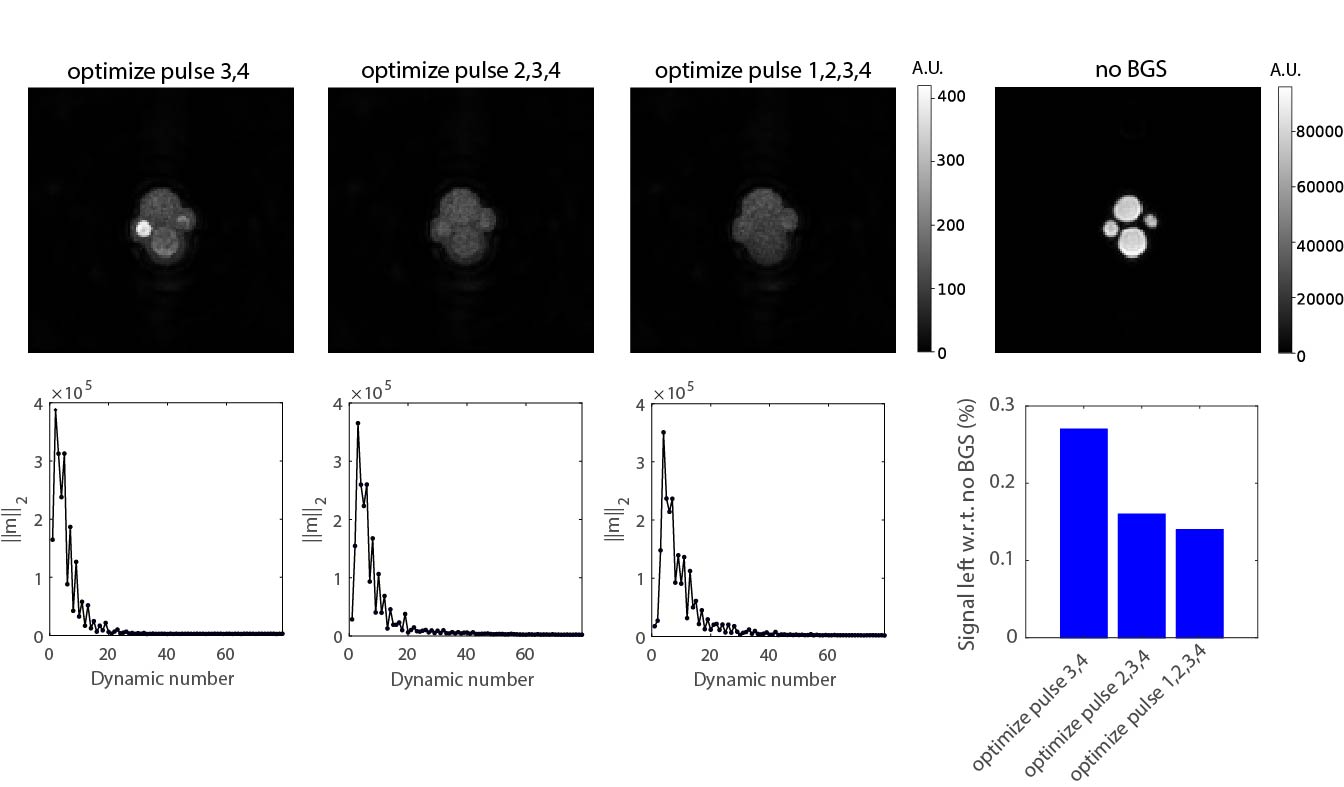
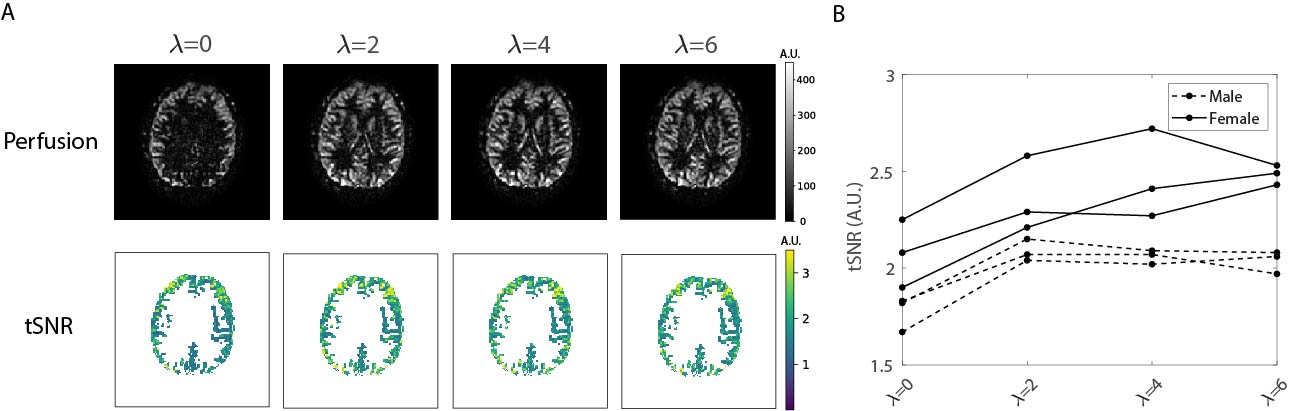
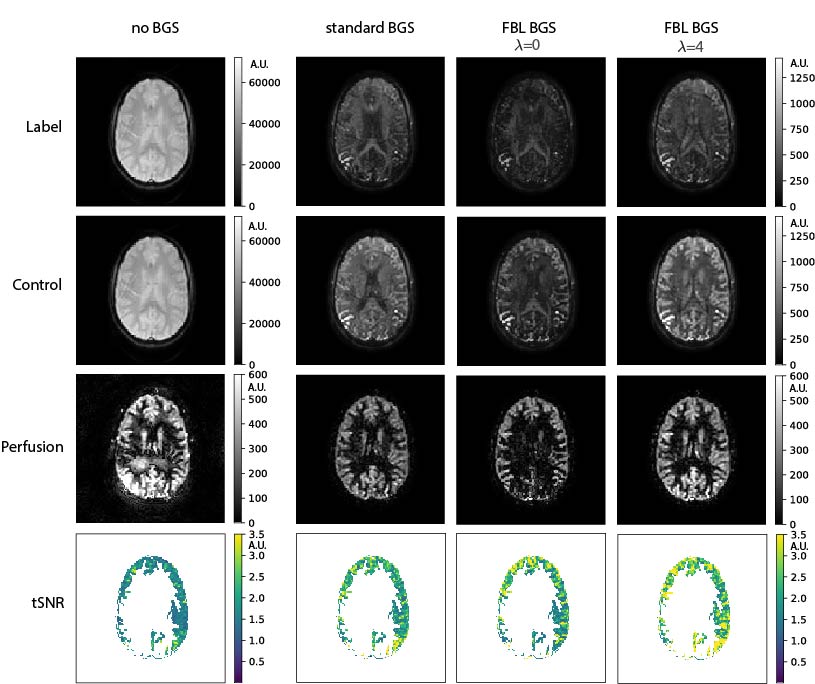
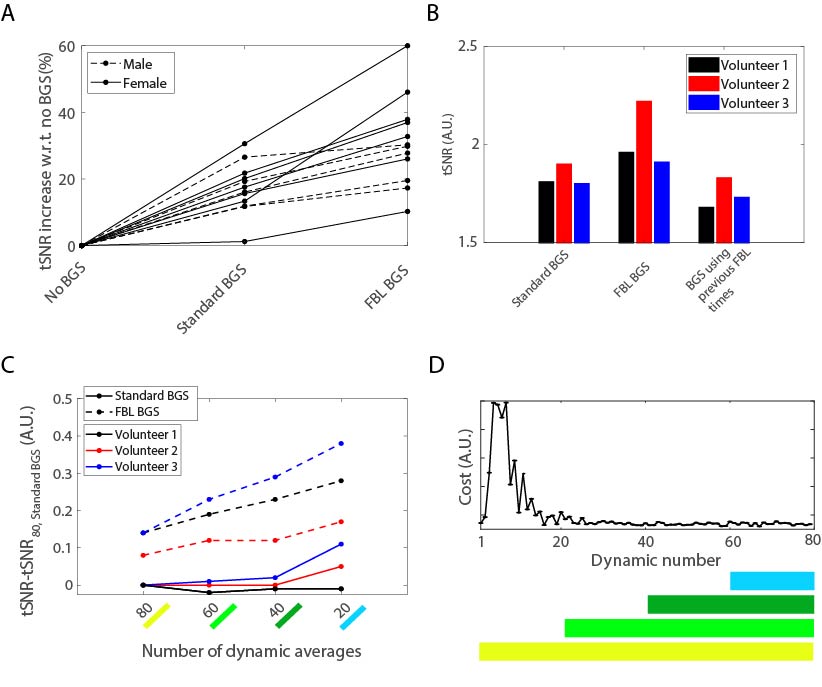
Figure 2 shows the performance of the FBL scan in a 4-tube phantom for a varying number of optimized inversion pulses. Optimizing all four pulses resulted in the best BGS, leaving 0.14% signal compared to without BGS. Figure 3 shows the performance of the FBL scan for different regularization parameters in one volunteer, showing an optimal tSNR at $$$\lambda=4$$$. Figure 4 shows that, using $$$\lambda=4$$$ the FBL resulted in averaged perfusion images with a higher tSNR in the gray matter region compared to standard BGS. This difference was tested statistically significant ($$$P=2\cdot 10^{-4}$$$) in 12 volunteers, with an increase of 10-60% for the FBL compared to 1-30% for standard BGS compared to no BGS, as shown in Fig. 5A. Reusing the individually optimized timings from a previously scanned subject resulted in a lower tSNR compared to individually optimizing the BGS in each of the three volunteers (Fig. 5B). Figures 5C,D furthermore show that the individually optimized BGS still outperformed standard BGS in terms of tSNR when more and earlier dynamics were used to compute the averaged perfusion image, even though earlier dynamics correspond with a higher cost and therefore a higher variance of the perfusion signal.Discussion
Individually optimizing the BGS using a FBL improved the quality of the perfusion images compared with standard BGS. Even though the updates of the inversion times (~15 ms) with respect to the initial timings were relatively small, they resulted in a statistically significant increase in tSNR. Reusing the optimized timings from a different volunteer resulted in a lower tSNR compared with individually optimizing the BGS, suggesting that optimal perfusion quality cannot be achieved with one single protocol. The individually optimized timings furthermore resulted in control images from which the perfusion signal can directly be appreciated. This can be used to track the neuronal activation in stimulus scans at twice the temporal resolution. Further research is needed to minimize the number of initial acquisitions during which the performance of background suppression is reduced compared to standard BGS, and to extend this technique to multi-slice or 3D acquisitions.Conclusion
In conclusion, a FBL mechanism can be used to optimize the performance of BGS in single-slice ASL scans. This leads to optimal perfusion quality for each subject in the scanner and can be seen as a first attempt towards subtraction-less ASL.Acknowledgements
This publication is part of the project HTSM (with project number 17104) which is financed by the Dutch Research Council (NWO).References
[1] Ye FQ, Frank JA, Weinberger DR, et al. Noise reduction in 3D perfusion imaging by attenuating the static signal in arterial spin tagging (ASSIST). Magnetic Resonance in Medicine. 2000;44(1):92–100.
[2] Maleki N, Dai W, Alsop DC. Optimization of background suppression for arterial spin labeling perfusion imaging. Magnetic Resonance Materials in Physics, Biology and Medicine. 2012;25(2):127–133.
[3] Wansapura JP, Holland SK, Dunn RS, et al. NMR relaxation times in the human brain at 3.0 Tesla. Journal of Magnetic Resonance Imaging. 1999;9(4):531–538.
[4] Smink J, Häkkinen M, Holthuizen R, et al. eXTernal Control (XTC): a flexible, real-time, low-latency, bi-directional scanner interface. In: Proceedings of the 19th Annual Meeting of ISMRM. 2011. p. 1755.
[5] Nelder JA, Mead R. A Simplex Method for Function Minimization. The Computer Journal. 1965;7(4):308–313.
Figures