0337
Deoxyhemoglobin versus Gadolinium as Contrast in Dynamic Susceptibility Perfusion Imaging: Simulations and Scan Validations1Medical Biophysics, University of Toronto, Toronto, ON, Canada, 2Physiology, University of Toronto, Toronto, ON, Canada, 3Joint Department of Medical Imaging and the Functional Neuroimaging Lab, University Health Network, Toronto, ON, Canada, 4Department of Anaesthesia and Pain Management, University Health Network, Toronto, ON, Canada, 5Techna Institute & Koerner Scientist in MR Imaging, University Health Network, Toronto, ON, Canada
Synopsis
DSC-MRI requires bolus administration of gadolinium, an exogenous contrast agent with notable limitations. We used simulations to compare gadolinium with a deoxyhemoglobin bolus generated in the lungs as perfusion contrast and verified the findings in healthy human subjects. We found that the calculated cerebral blood volume is dependent on the contrast agent, the magnitude of deoxyhemoglobin concentration increase (dosage), and the baseline oxygen saturation. We also found a reduction of macrovascular contamination with deoxyhemoglobin contrast. This work reveals novel insights for the use of deoxyhemoglobin, an endogenous and safe contrast agent for determining perfusion in the human brain.
Introduction
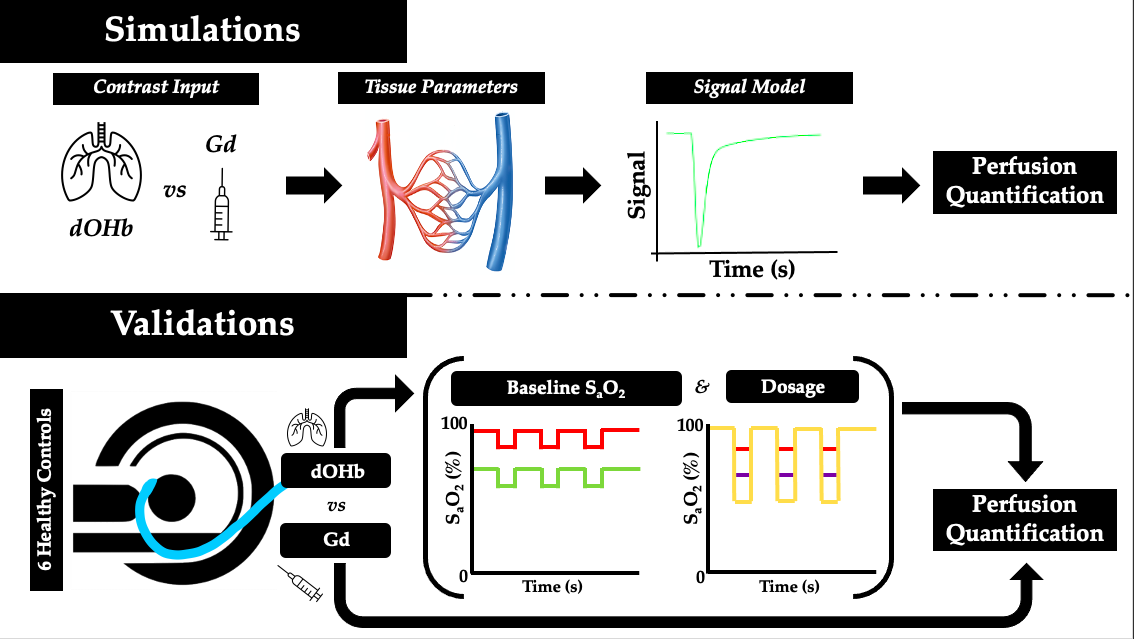
Contrast in perfusion imaging is typically obtained with gadolinium (Gd), an exogenous metal. Unfortunately, Gd has been shown to accumulate in the brain and bones, interfere with aquatic ecosystems, and cause disease in patients with kidney dysfunction.1,2,3,4 Deoxyhemoglobin (dOHb), formed when oxyhemoglobin loses oxygen, is paramagnetic and thus capable of disturbing the magnetic field in and around the blood vessels, similarly to Gd.5 Recent research has shown that a dOHb bolus formed in the lungs by inhaling hypoxic gases elicits signal change in dynamic susceptibility contrast.6 However, there is no work thus far which has evaluated the quantitative capacity of [dOHb] contrast in perfusion imaging and how it compares with gadolinium-based contrast. Therefore, our work aimed to use a mathematical model for simulations7 and perfusion scans in healthy subjects to determine the best practices for dOHb contrast in research and healthcare.Methods
Magnetic resonance imaging signal at 3T in response to Gd and dOHb contrast was simulated by incorporating a full signal intensity model;7 extravascular and intravascular relaxation effects;7 cerebral tissue, arterial, and venous characteristics observed in the literature;8 contrast input profiles;9 and residue function properties for tissue and vein.10 Once simulated, conventional dynamic susceptibility contrast calculations were conducted to attain cerebral blood volume (CBV).11 To uncover relationships which could later be verified in experimental scans, CBV was calculated in response to gadolinium versus dOHb contrast, dOHb dosage, and baseline arterial oxygen saturation (SaO2). Relationships shown to be present in numerical simulations were then assessed experimentally; this included the dOHb dosage, conducted at small (98% to 90% SaO2), medium (98% to 84% SaO2), and large (98% to 75% SaO2) hypoxic drops, along with baseline SaO2, conducted at high (98% to 90% SaO2) and low (88% to 80% SaO2) levels, with each drop lasting roughly 30 seconds. Thus, we generated dOHb contrast under five conditions in six healthy subjects, with SaO2 controlled by the RespirAct (Thornhill Medical Inc.).12 This was followed by a standard injection of Gd (5 mL Gadovist injected at 5 mL/sec followed by 30 mL of saline at 5 mL/sec). Note that when dOHb was compared to Gd (Figure 3), the dOHb boluses were averaged to increase the signal to noise. Perfusion scans were conducted on a 3T GE scanner with the following parameters: GRE sequence, TR/TE = 1500/30ms, Flip angle = 73o, 3 mm isotropic voxels with 29 contiguous slices – no interslice gap. The same quantification steps performed in numerical simulations were then applied to the experimental data to obtain estimates of CBV.Results
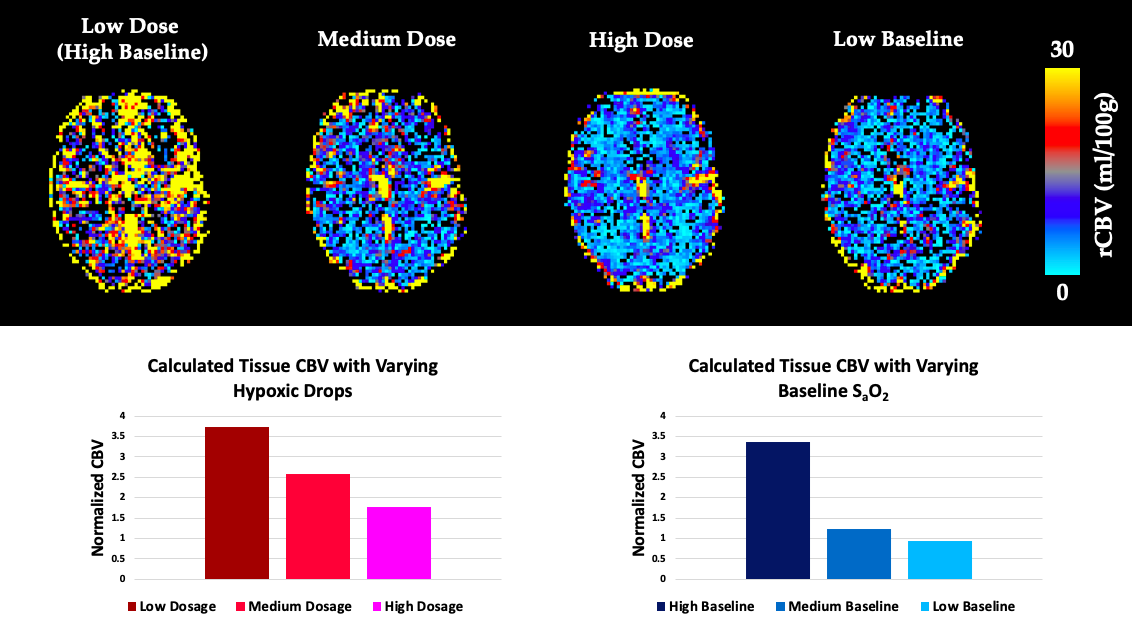
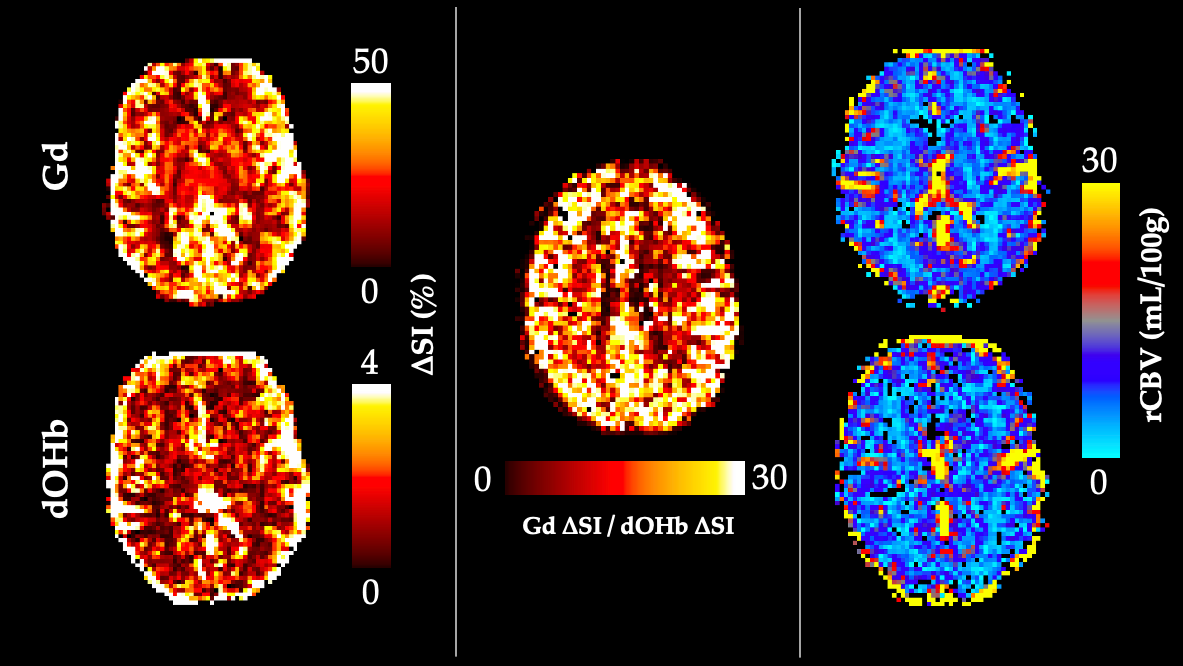
The simulations predicted that the calculated CBV using dOHb as contrast is dependent on the dosage of contrast and baseline SaO2, particularly when tissue is normalized to an arterial input voxel with high intravascular content (not shown). Here, higher dosage or lower baseline SaO2 results in estimations of lower CBV (Figure 2). This same observation was somewhat present but much less pronounced for Gd, which typically provided a more accurate estimate of the true CBV in simulations. The simulation results were confirmed by the experimental data for baseline SaO2 and dosage dependencies when using dOHb contrast (Figure 2). Of note, while scan data revealed Gd contrast to result in higher signal than dOHb, the scaling between signal maps was not homogeneous; the ratio of gray matter to white matter signal was higher with Gd than with dOHb contrast (Figure 3). Finally, CBV maps calculated from Gd and dOHb varied between subjects, but were generally in agreement with each other, particularly when high dosage dOHb was applied (Figure 3).Discussion
Through interrogating the simulations, we discovered that the dependency of CBV calculations on baseline SaO2 and contrast dosage follows from the quadratic nature of intravascular relaxation, which dominates in voxels containing large vessels. Here, linear changes in dosage result in linear changes in the relaxation rate for tissue voxels, but not for arterial voxels which are selected as an arterial input function. This non-linearity produced by the quadratically dependent relaxation rate is less prevalent with Gd due to its higher molar susceptibility than dOHb. The dosage and baseline SaO2 dependencies for the normalizing artery provide reason to scale the artery by signal in a venous voxel, which attains more accurate blood volume estimates and does not depend on dosage or baseline SaO2 (not shown). Finally, although there are likely other factors to consider, the inhomogeneous signal scaling between contrast types is hypothesized to result from macrovascular contamination of the grey matter in Gd contrast which is much less prevalent in response to dOHb, owed to its smaller macrovascular response.Conclusion
The experimental results agreed with predictions from simulations: perfusion quantification in dynamic susceptibility contrast is dependent on whether Gd or dOHb contrast is used, the magnitude of dOHb concentration change (dosage), and level of baseline SaO2. This work can be used to inform better clinical and research practices when employing safer contrast to attain higher signal to noise and consistent perfusion quantification between scans.Acknowledgements
The Government of Canada (CIHR: CGS-M)
The Department of Medical Biophysics at the University of Toronto
TECHNA Institute at UHN
Thornhill Medical Inc.
The study was supported by the Institute for Basic Science, Suwon, Republic of Korea (IBS-R015-D1) to Kamil Uludag
References
1) Kanda, T., Fukusato, T., Matsuda, M., Toyoda, K., Oba, H., Kotoku, J., Haruyama, T., Kitajima, K., & Furui, S. (2015). Gadolinium-based Contrast Agent Accumulates in the Brain Even in Subjects without Severe Renal Dysfunction: Evaluation of Autopsy Brain Specimens with Inductively Coupled Plasma Mass Spectroscopy. Radiology, 276(1), 228–232.
2) Lord, M. L., Chettle, D. R., Gräfe, J. L., Noseworthy, M. D., & McNeill, F. E. (2018). Observed Deposition of Gadolinium in Bone Using a New Noninvasive in Vivo Biomedical Device: Results of a Small Pilot Feasibility Study. Radiology, 287(1), 96–103.
3) Rogowska, J. (2018). Gadolinium as a new emerging contaminant of aquatic environments. Environmental Toxicology and Chemistry, 37(6), 1523 – 1534.
4) Schlaudecker, J. D., & Bernheisel, C. R. (2009). Gadolinium-associated nephrogenic systemic fibrosis. American Family Physician, 80(7), 711–714.
5) Bren, K. L., Eisenberg, R., & Gray, H. B. (2015). Discovery of the magnetic behavior of hemoglobin: A beginning of bioinorganic chemistry. Proceedings of the National Academy of Sciences of the United States of America, 112(43), 13123–13127.
6) Poublanc, J., Sobczyk, O., Shafi, R., Sayin, E. S., Schulman, J., Duffin, J., Uludag, K., Wood, J. C., Vu, C., Dharmakumar, R., Fisher, J. A., & Mikulis, D. J. (2021). Perfusion MRI using endogenous deoxyhemoglobin as a contrast agent: Preliminary data. Magnetic Resonance in Medicine, (n/a).
7) Uludağ, K., Müller-Bierl, B., & Uğurbil, K. (2009). An integrative model for neuronal activity-induced signal changes for gradient and spin echo functional imaging. NeuroImage, 48(1), 150–165.
8) Vovenko, E. (1999). Distribution of oxygen tension on the surface of arterioles, capillaries and venules of brain cortex and in tissue in normoxia: An experimental study on rats. Pflugers Archiv: European Journal of Physiology, 437(4), 617–623.
9) Calamante, F. (2013). Arterial input function in perfusion MRI: A comprehensive review. Progress in Nuclear Magnetic Resonance Spectroscopy, 74, 1–32.
10) Mehndiratta, A., Calamante, F., MacIntosh, B. J., Crane, D. E., Payne, S. J., & Chappell, M. A. (2014). Modeling the residue function in DSC-MRI simulations: Analytical approximation to in vivo data. Magnetic Resonance in Medicine, 72(5), 1486–1491.
11) Vu, C., Chai, Y., Coloigner, J., Nederveen, A. J., Borzage, M., Bush, A., & Wood, J. C. (2021). Quantitative perfusion mapping with induced transient hypoxia using BOLD MRI. Magnetic Resonance in Medicine, 85(1), 168–181.
12) Slessarev, M., Han, J., Mardimae, A., Prisman, E., Preiss, D., Volgyesi, G., Ansel, C., Duffin, J., Fisher, J.A. (2007). Prospective targeting and control of end-tidal CO2 and O2 concentrations. Journal of Physiology, 581(3), 1207-1219.
Figures