0336
Enhanced superselective pseudo-Continuous Arterial Spin Labeling using parallel transmission with B1 phase shimming at 7T1Laboratory of FMRI Technology (LOFT), Mark & Mary Stevens Neuroimaging and Informatics Institute, Keck School of Medicine, University of Southern California, Los Angeles, CA, United States, 2Department of Neurology, Keck School of Medicine, University of Southern California, Los Angeles, CA, United States
Synopsis
Superselective pseudo-Continuous Arterial Spin Labeling (SS-pCASL) suffers from low labeling efficiency due to B1 inhomogeneity at 7T. An enhanced SS-pCASL using parallel transmission with B1 phase shimming was proposed. B1 phase shimming algorithm was designed to penalize low and high B1 amplitude in the labeled and unlabeled ICA, respectively. B1 amplitude was increased by 40% for the labeled ICA and decreased by 90% for the unlabeled ICA. Simulation and in-vivo results demonstrated that enhanced SS-pCASL improved labeling efficiency for the labeled ICA and suppressed labeling oscillation for the unlabeled ICA.
Background
Superselective pseudo-Continuous Arterial Spin Labeling (SS-pCASL) which integrates time-varying in-plane gradients into a typical pCASL labeling has been introduced to selectively label an individual artery at 3T1,2. At 7T, however, labeling efficiency (LE) of SS-pCASL could be compromised by insufficient and/or inhomogeneous transmit B1. A recent study addressed B1 inhomogeneities at labeled arteries to improve LE and labeling symmetry of pCASL at 7T using parallel transmission (pTx) with B1 phase shimming3. Instead of improving B1 amplitude symmetrically, B1 phase shimming could selectively generate bright and dark spots of B1 field in the labeling plane. In this study, an enhanced SS-pCASL scheme was introduced with B1 phase shimming to improve LE for a labeled internal carotid artery (ICA) while reducing LE oscillation (i.e., residual labeling) for an unlabeled ICA.Methods
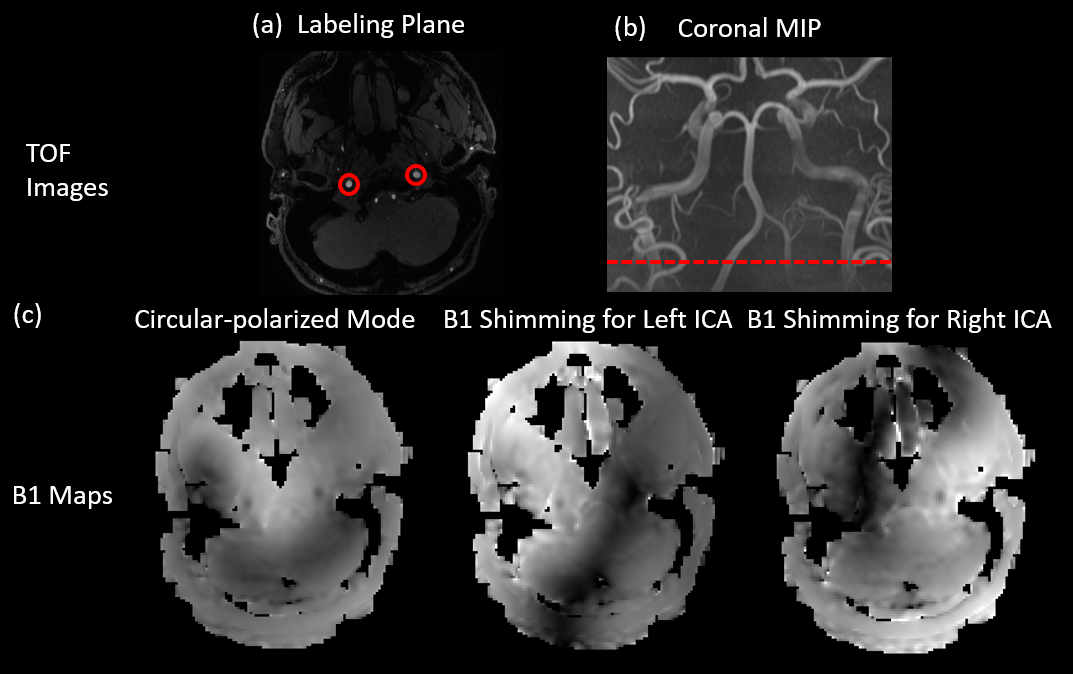
Two ROIs (indicated in Fig.1(a)) of ICAs were drawn in the angiography image at the labeling plane. Voxel-wise values from B1 maps within ROIs were fed into the B1 phase shimming algorithm that minimizes the cost function defined by Eq. 1,$$Cost=-||B_{labeled}\cdot u||^{2}+w\cdot ||B_{unlabeled}\cdot u||^{2}$$
where Blabeled and Bunlabeled include channel-specific B1 scaling factors of voxels within the labeled and unlabeled ROIs, respectively, u is a vector of complex weights for transmit channels, and w controls the weighting of losses from two terms. The first term penalizes low B1 amplitude in the labeled artery, while the second term penalizes high B1 amplitude in the unlabeled artery.
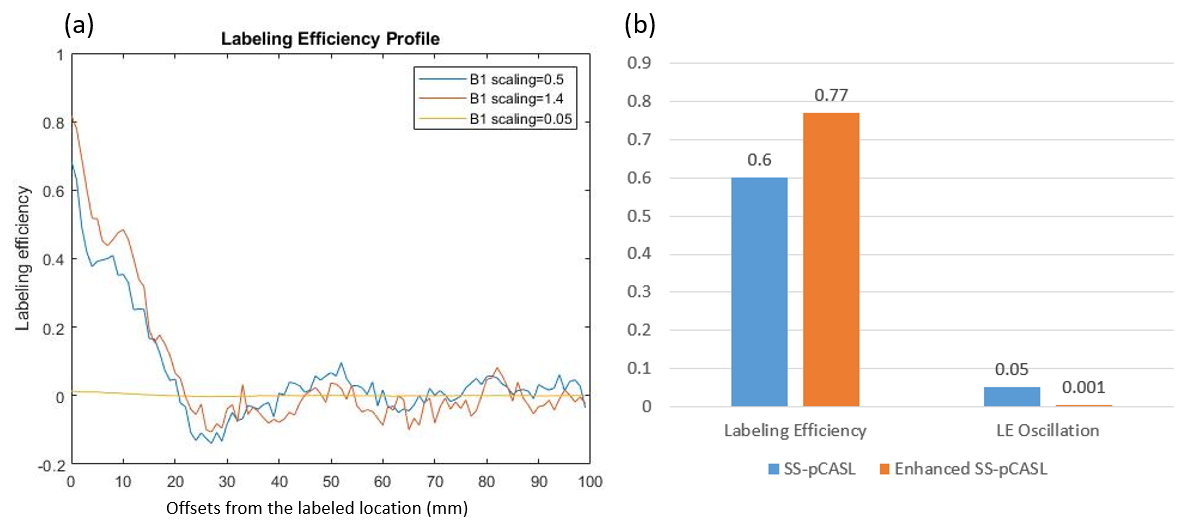
Bloch simulation was performed based on the identical parameters described below for in-vivo studies and the B1 scaling factors of 0.05, 1.4, and 0.5 which represent the in-vivo values in unlabeled ICA in enhanced SS-pCASL, labeled ICA in enhanced SS-pCASL, and ICAs in standard SS-pCASL, respectively. Laminar flow with Vmax=40cm/s was assumed. LE was calculated for offsets of 0-3mm based on the radius of ICA, and LE oscillation was calculated as the standard deviation of LE for offsets of 20-100mm.
In-vivo studies were performed on a Siemens 7T Terra with a Nova 8Tx/32Rx head coil. Non-selective pCASL images were acquired by an optimized labeling (TR=6000ms, labeling duration=1000ms, post labeling delay=1500ms, peak RF amplitude=6.5μT, RF duration=300μs, RF gap=190μs, Gave/ Gmax=0.6/6mT/m, and 38 measurements for 3:50mins) with 2D turbo-FLASH readout3. Imaging parameters were: FOV=210×192mm, matrix size=96×88, 9 slices with slice thickness=5mm, TR=150ms, TE=1.38ms, FA=8°. SS-pCASL images with selective labeling of an ICA at each time were acquired by applying modified RF phases and additional in-plane gradients to pCASL that rotate at the frequency of 23Hz with a peak amplitude of 5mT/m. Amplitude modulation was used to suppress LE oscillation according to2. Besides, angiography images were obtained using time-of-flight (TOF) sequence to locate the labeling plane (indicated in Fig.1(b)), and channel-specific B1 maps were acquired at the labeling plane and converted into B1 scaling factors according to4.
Control and label volumes were subtracted and averaged to generate perfusion images. Hand-drawn masks for the left and right hemispheres of the brain were used to extract mean perfusion signals. Relative LEs of SS-pCASL were calculated by dividing the signal of SS-pCASL to that of non-selective pCASL. Contrast-to-noise ratio (CNR) between two hemispheres was analyzed as the ratio of the difference signal (perfusion<0 was set to 0) to the noise measured from gray matter (GM).
Results and discussion
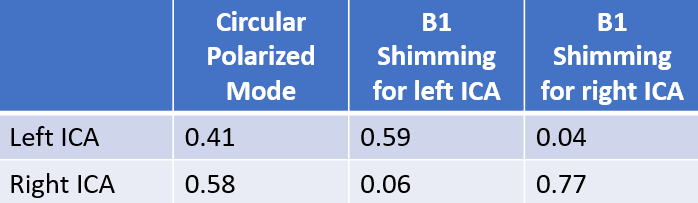
Figure 1(c) shows a B1 map of circular polarized (CP) mode and B1 maps that were shimmed for left or right ICA, and Table 1 lists the measured B1 scaling factors for the left and right ICA in the three conditions. In CP mode, ICAs were located at regions with suboptimal B1 scaling factors of 0.41 for left ICA and 0.58 for right ICA. After optimization, a bright region with an averaged 1.4-fold improvement of B1 delivery can be observed for the labeled ICA, while only 10% of the original B1 amplitude can be received by the unlabeled ICA where a dark spot occurred.The advantages of enhanced SS-pCASL were demonstrated by the simulated LE profiles in Fig. 2. In SS-pCASL with B1 factor of 0.5 for both ICA, a moderate LE of 0.6 and a high LE oscillation of 0.05 at remote offset locations were reported. In enhanced SS-pCASL, LE was raised to 0.77 for the labeled location, while LE oscillation was reduced to 0.001 for unlabeled locations.
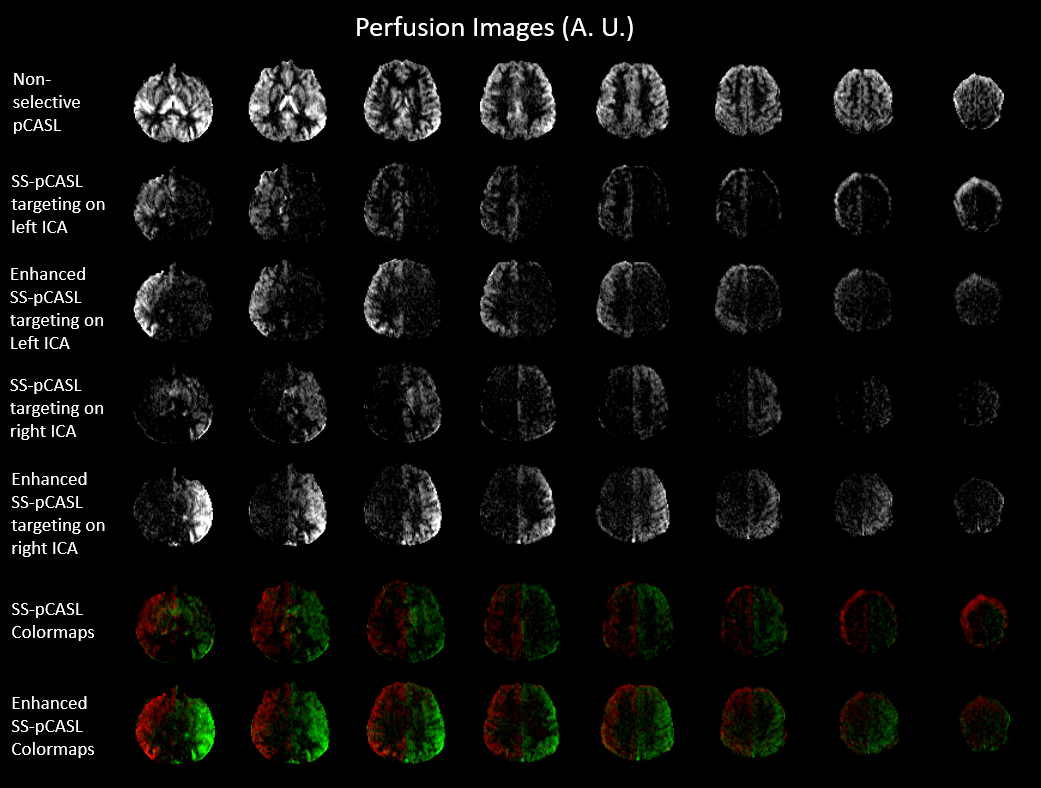
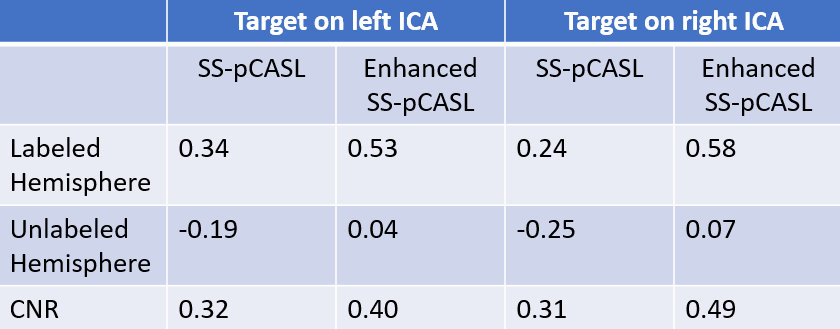
Figure 3 shows perfusion images of non-selective pCASL, SS-pCASL, enhanced SS-pCASL, and colormaps. Table 2 lists measured LE values for the labeled and unlabeled hemisphere and CNR. A significant increase of perfusion signal (1.9-fold on average) was observed for the labeled hemisphere in enhanced SS-pCASL.Suppressions of LE oscillation were illustrated by the correction of LE from -0.22 to 0.05 in the unlabeled hemisphere by SS-pCASL. Enhanced SS-pCASL also resulted in a 1.4-fold higher CNR, and a stronger visual enhancement in colormaps compared to SS-pCASL.
Conclusion
We proposed and evaluated an enhanced SS-pCASL using pTx with B1 phase shimming at 7T. Our preliminary results show that B1 phase shimming may lead to 1.4-fold and 0.1-fold B1 amplitude for labeled and unlabeled ICA, respectively, compared to standard SS-pCASL with CP mode. Therefore, compared to SS-pCASL, enhanced SS-pCASL could increase LE in labeled ICA and reduce LE oscillation in unlabeled ICA.Acknowledgements
This work was supported by National Institute of Health (NIH) grant S10-OD025312, R01-EB032169 and R01-EB028297.References
[1] Helle, Michael, et al. "Superselective pseudocontinuous arterial spin labeling." Magnetic resonance in medicine 64.3 (2010): 777-786.
[2] Dai, Weiying, et al. "Modified pulsed continuous arterial spin labeling for labeling of a single artery." Magnetic resonance in medicine 64.4 (2010): 975-982.
[3] Wang, Kai, et al. "Optimization of pseudo‐continuous arterial spin labeling at 7T with parallel transmission B1 shimming." Magnetic Resonance in Medicine (2021).
[4] Siemens Healthcare. "IDEA User’s Manual." Siemens Healthcare GmbH (2018).
Figures