0335
Dual-module velocity-selective arterial spin labeling (dm-VSASL) using velocity-selective saturation and inversion pulses1Bioengineering, University of California Riverside, Riverside, CA, United States, 2Center for Advanced Neuroimaging, University of California Riverside, Riverside, CA, United States
Synopsis
Recently velocity-selective saturation (VSS) based dual-module (dm-) preparation and velocity-selective inversion (VSI) based preparation have demonstrated improved SNR efficiency in velocity-selective arterial spin labeling (VSASL) than conventional single-module VSS based preparation. In this study, a novel strategy was developed to allow dm-VSI labeling to further improve the SNR efficiency. Implementation of dm-VSASL were evaluated for VSS and/or VSI combinations. The theoretical performance was compared via ASL signal modeling, and then validated by in vivo human experiments with an increase of 6.6%. Dm-VSASL is capable of providing further improved SNR performance, with potentially better suppression of diffusion attenuation/eddy current artifacts.
Introduction
Velocity-selective ASL (VSASL) 1 is insensitive to inhomogeneous arterial transit times (ATT) among ASL methods 1, 2, offering an SNR advantage when ATT is long. VS saturation (VSS) based labeling has relatively low signal-to-noise ratio (SNR). Recent development on improving the SNR includes: 1) multi-module VSS preparation 2, and 2) VS inversion (VSI) preparation 3. An SNR improvement in the range of 20 ~ 30% compared to single-module (sm-) VSS based preparation has been reported using both methods 2-4. A novel labeling strategy is invented to enable dual-module (dm-) VSI labeling to further improve the SNR efficiency, which also benefits VSS labeling.Theory and Methods
Similar to the dm-VSS preparation 2, two groups of spins are considered for dm-VSI: 1) one labeled by only the first VS module; 2) one labeled by both VS modules. The evolution of the magnetization for dual-VSS and dual-VSI is shown in Figure 1, and SigASL=ΔMz1·TI1.+ΔMz2·TI2.Dm-VSI labeling: VSI pulses invert the stationary spins, therefore flipping the label/control condition in the second VSI is required to avoid signal canceling. Additional benefits include: 1) the sensitivity to motion, diffusion attenuation and eddy current (EC) effects are better balanced in the label/control images, potentially reducing artefacts and improving quantification accuracy; 2) the inversion effects allow more efficient background suppression (BS).
Dm-VSS labeling: 1) VSS+VSS as described previously 2; 2) VSSinv+VSS or VSSinv+VSSinv to allow a more balanced label/control design as described above. VSSinv can be implemented in several ways 2, 4, such as adding a phase of π to the last segment of the symmetric BIR-8 (sBIR8) pulse.
Dm-VSASL using VSS and VSI: VSS+VSI, VSI+VSS and their inverted variants. Label/control condition should be flipped in the second VS module when necessary.
Modeling and simulation
A kinetic ASL model 5 was used to model the ASL signals, including Pulsed ASL (PASL) and Pseudo-Continuous ASL (PCASL) 6. The SNR efficiency, SigASL/sqrt(2TR), was evaluated with and without T2 relaxation for VSASL, and realistic labeling efficiencies for PASL and PCASL 7. The maximal bolus durations were: 2s for VSASL 2, 1s for PASL and unlimited for PCASL.
In vivo experiments
Four healthy human subjects (1F, age 23-38) were studied on a 3T scanner (Siemens Prisma, Erlangen, Germany) under an IRB approval. Symmetric BIR-8 8 and sinc-VSI 4 pulses were used for VSS and VSI labeling, respectively. ASL scans were acquired in a randomized order with BS: 1) PASL: FAIR 9, 10 Q2Tips 11, TI1=0.8s, TI=2.4s, 2 BS pulses; 2) VSSinv: TI=1.4s, 1 BS pulses; 3) VSS+VSSinv: TI1/2=1.16/0.83s, 1 BS pulses; 4) VSSinv+VSS: TI1/2=1.45/0.54s, 1 BS pulses; 5) VSI: TI=1.4s, 1 BS pulses; 6) VSI+VSI: TI1/2=1.45/0.54s, 2 BS pulses. Other parameters were: 2-interleaved 3D GRASE EPI readout, FOV=220x220mm (64x64), 24 slices, 4mm thickness, TR=4s (PASL) and 5s (VSASL), 15 and 12 label/control pairs for PASL and VSASL, cutoff velocity=2cm/s along S/I in VSASL. Reference images were acquired for quantification.
Results
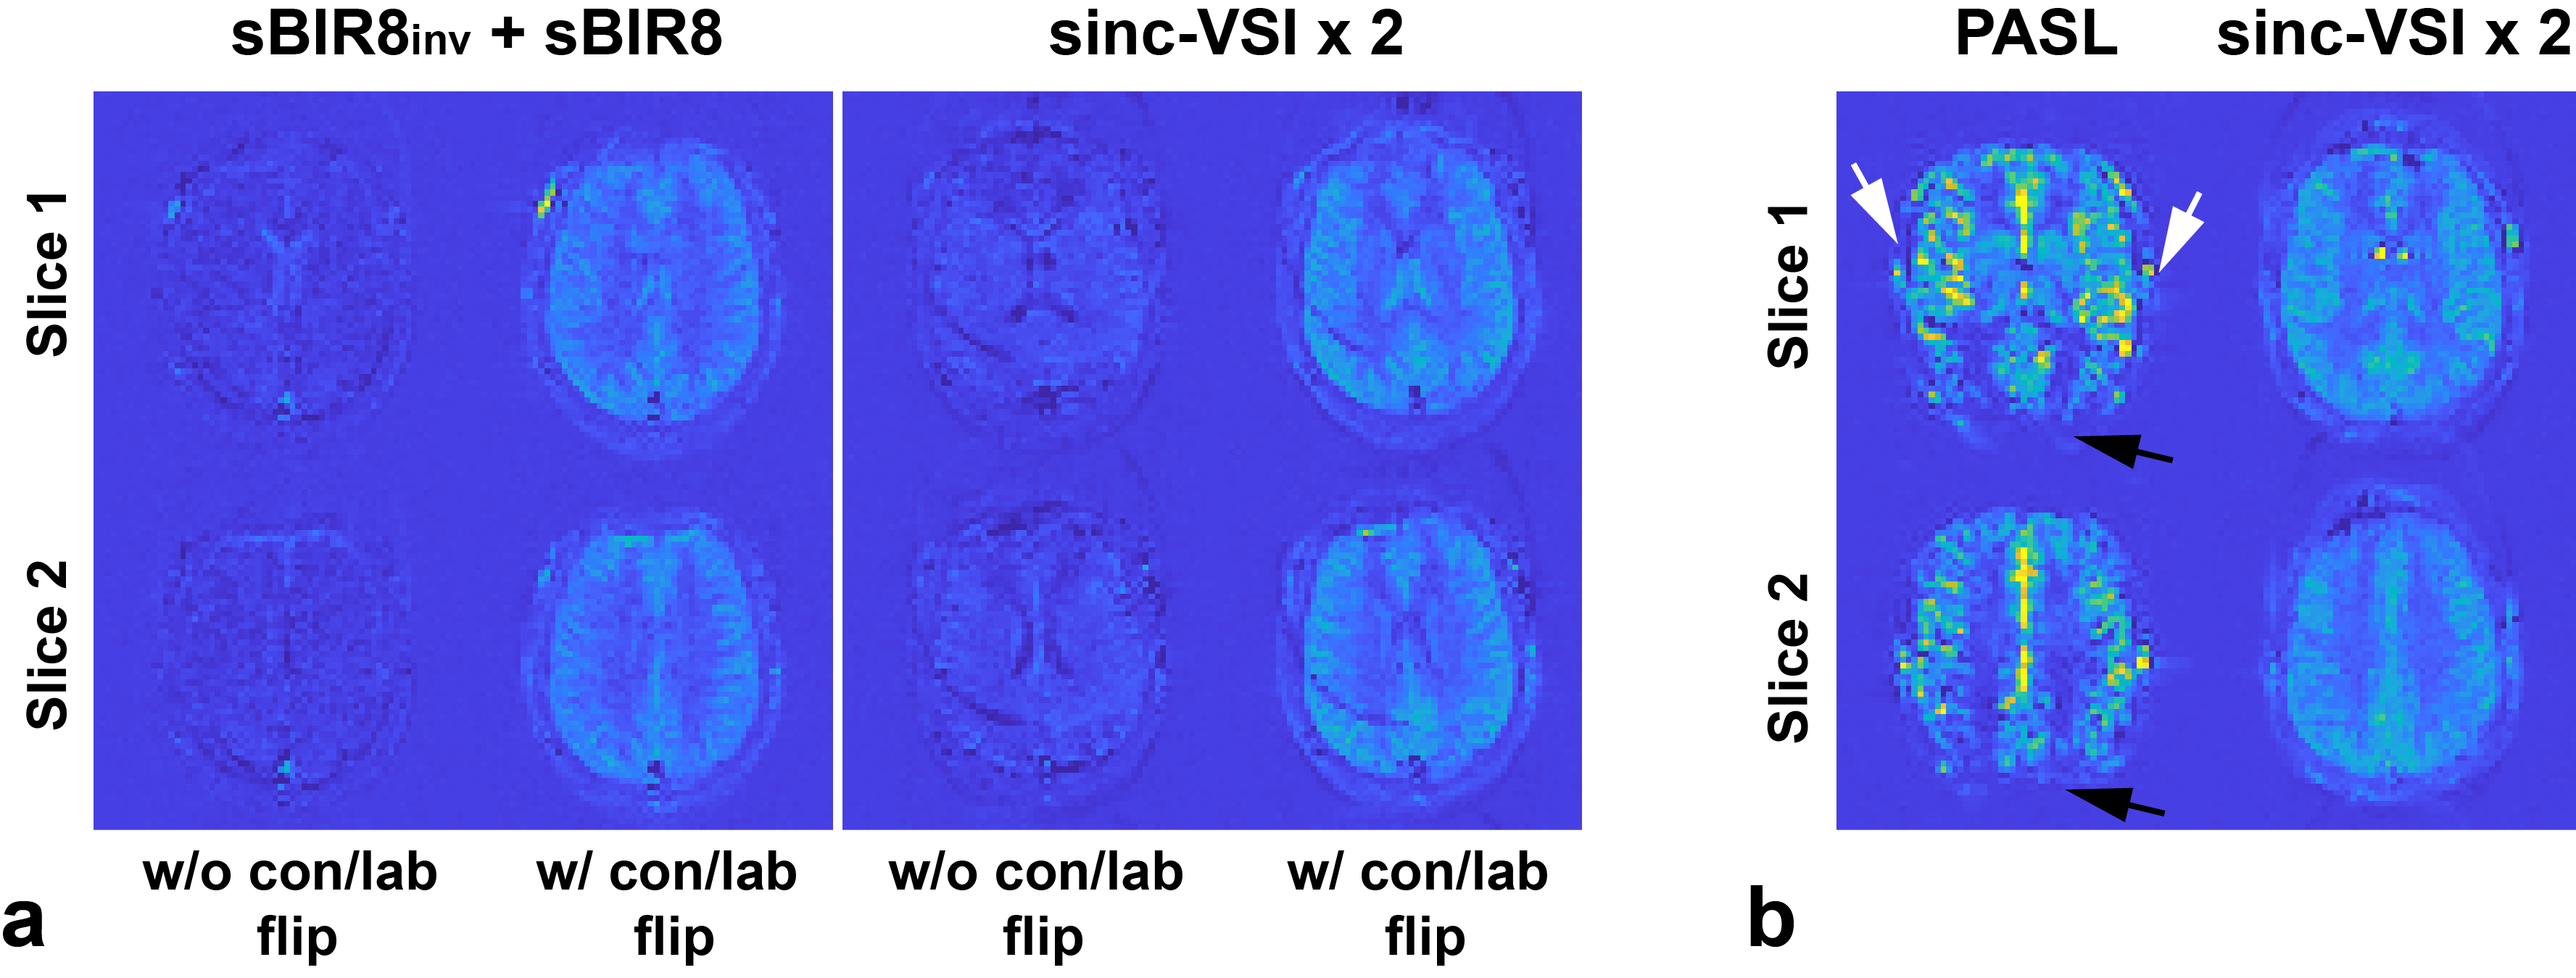
SNR efficiencies of different ASL methods from simulation are shown in Figure 2. Compared to sm-VSI, the maximal SNR efficiency of dm-VSI was increased by 11.8% without T2 relaxation; and was the same with T2 relaxation.Figure 3a demonstrates the necessity of the label/control flipping in the second VS module in VSSinv+VSS and VSI+VSI. Figure 3b shows ATT artefacts with PASL in an early testing in sub. 3, while VSASL demonstrated excellent ATT insensitivity.
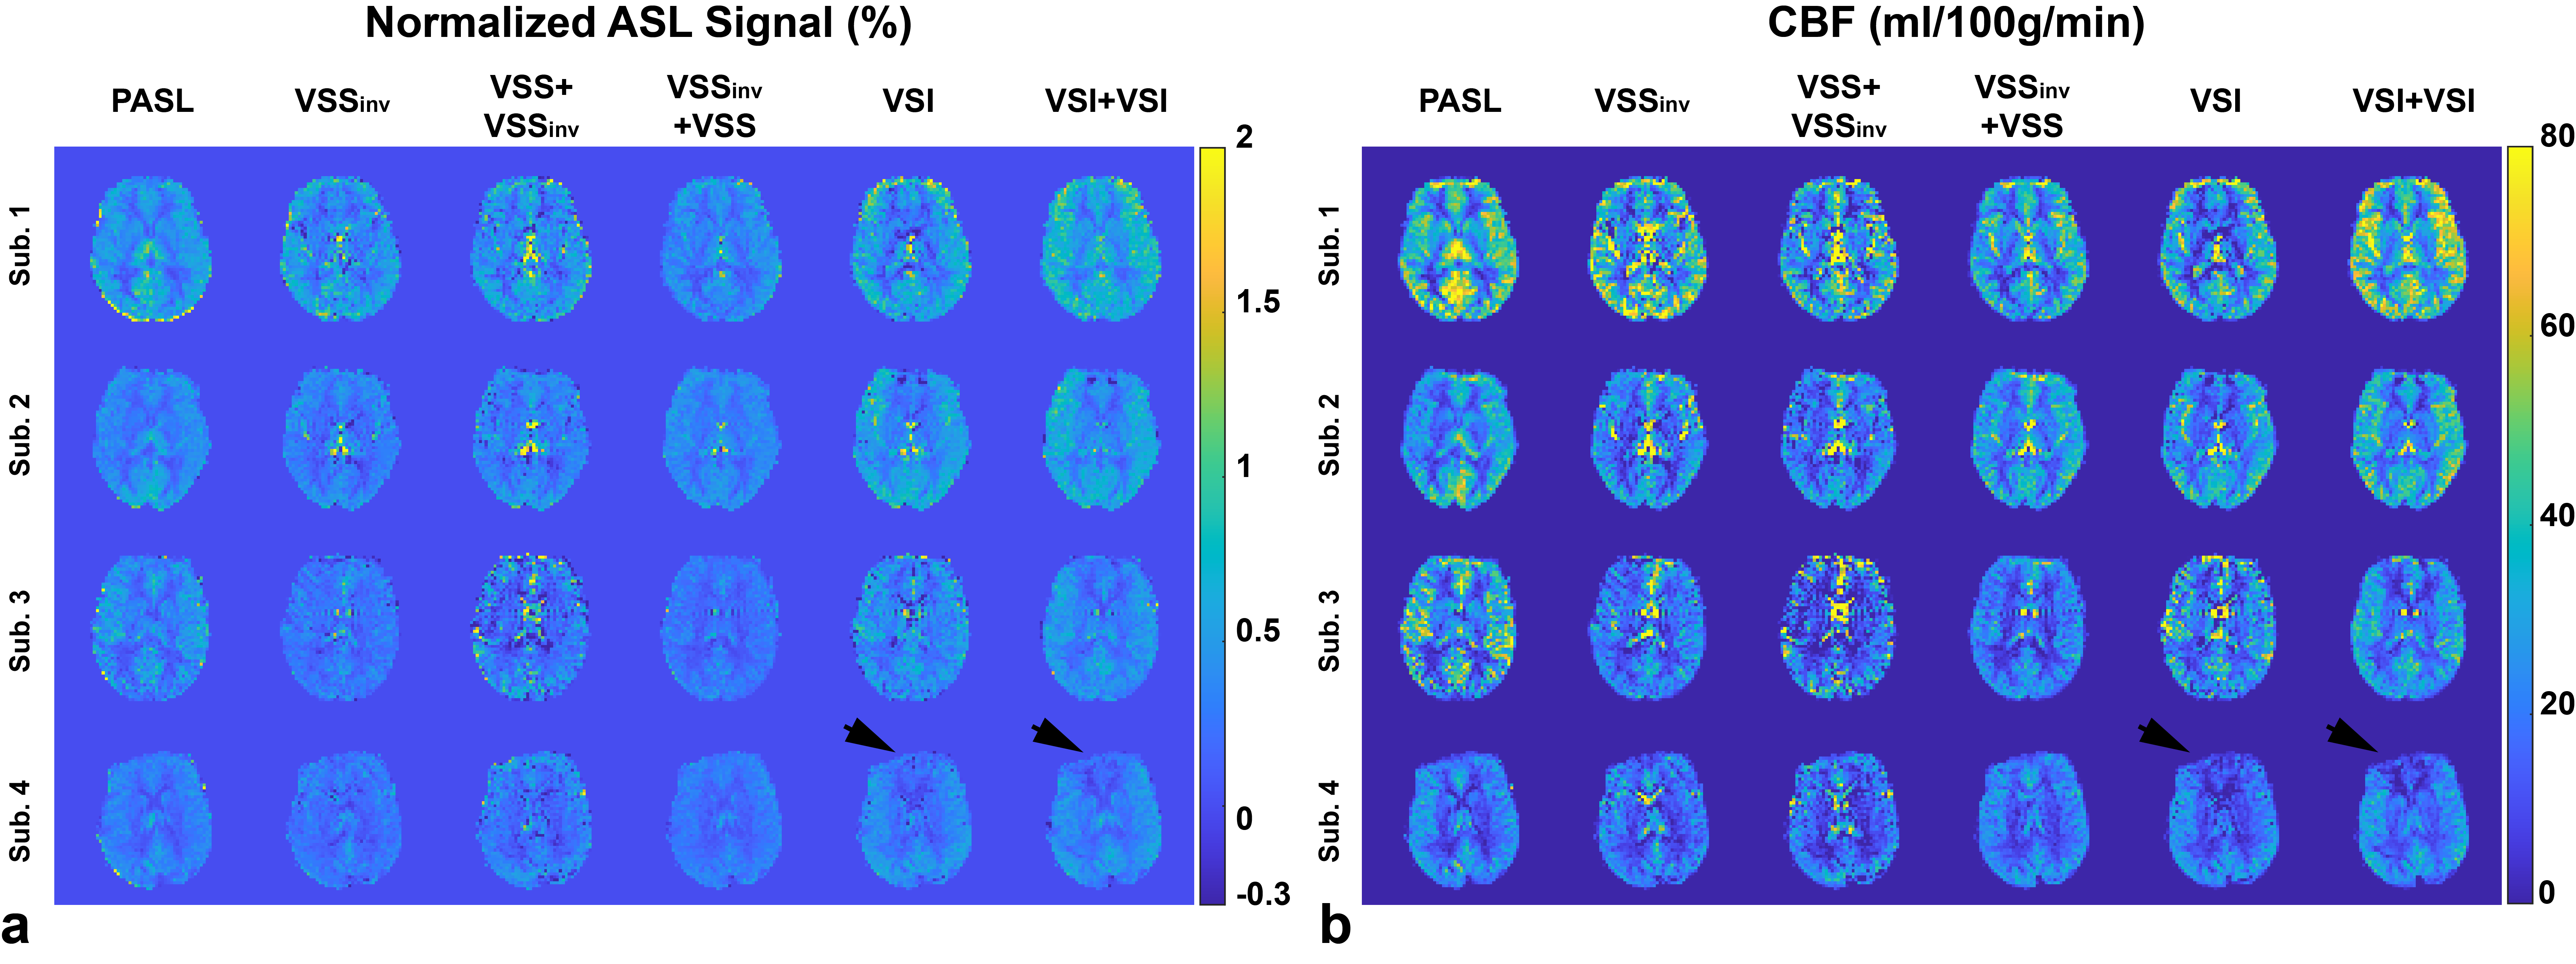
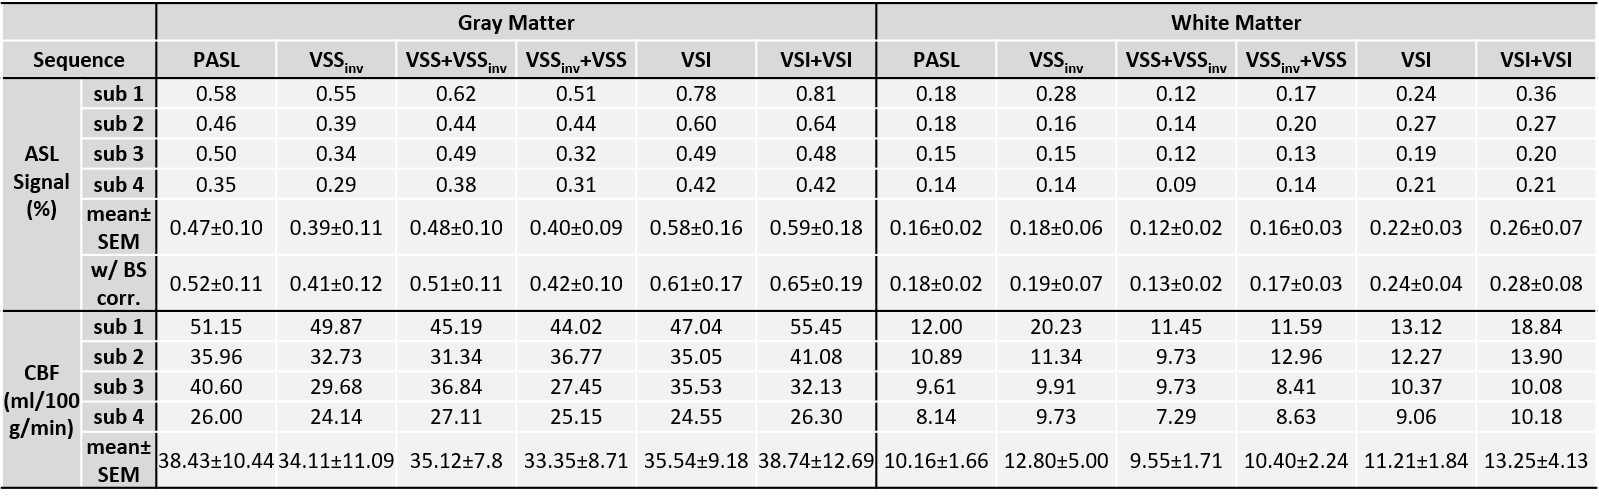
Normalized ASL signal and cerebral blood flow (CBF) maps are shown in Figure 4. Averaged values in gray matter (GM) and white matter (WM) are summarized in Table 1. After correcting for the signal attenuation from BS (5% reduction each), dm-VSI produced the highest signal in GM, followed by sm-VSI, and VSS+ VSSinv. Dm-VSI showed a trend of increasing the signal by 6.6% (p=0.062) compared to sm-VSI labeling; VSS+VSSinv increased ASL signal by 24.4% (p=0.025) compared to sm-VSS, consistent with previous findings 2, 4; VSSinv+VSS showed a marginal increase of 2.4% (p=0.91). Dm-VSI and sm-VSI increased ASL signal by 50% (p≤0.01) compared to sm-VSS. There was no significant difference in CBF between labeling methods (p=0.19 in GM, and p=0.070 in WM). In addition, the temporal SNR was doubled with dm-VSASL in GM (details reported in another abstract). A regional ASL signal reduction was observed in sub. 4 using VSI labeling (Figure 4).
Discussion
For dm-VSI vs. sm-VSI, in vivo experiments measured a signal increase of 6.6%, higher than that predicted by simulation, likely due to more stable labeling with dual-module labeling. Sinc-VSI is preferred to rect-VSI because of a shorter effective TE (eTE, 29.4ms vs. 37.6ms using the same timings in the study). Further reduction of eTE should increase the SNR advantage of dm-VSASL.It is important to arrange VS modules properly to accumulate ASL signals constructively. It is required to flip the label/control condition in the second VS module if the first one inverts stationary spins. This can help reduced diffusion attenuation/EC artifacts. Consistent with the findings in a recent study 4, further reduction of the sensitivity to field inhomogeneities is needed for VSI pulses.
Conclusion
Dual-module VSS and VSI can be implemented with improved SNR efficiency and/or temporal SNR with potentially reduced artefacts, may be a preferred VSASL labeling strategy for clinical applications.Acknowledgements
The authors thank Dr. Jason Langley for data acquisition, and Dr. Divya Bolar for sharing code for pulse sequence development.
References
1. Wong EC, Cronin M, Wu W-C, Inglis B, Frank LR, Liu TT. Velocity-selective arterial spin labeling. Magn Reson Med. 2006;55(6):1334-41.
2. Guo J, Wong EC. Increased SNR efficiency in velocity selective arterial spin labeling using multiple velocity selective saturation modules (mm-VSASL). Magn Reson Med. 2015;74(3):694-705.
3. Qin Q, van Zijl PC. Velocity-selective-inversion prepared arterial spin labeling. Magn Reson Med. 2016;76(4):1136-48.
4. Guo J, Das S, Hernandez-Garcia L. Comparison of velocity-selective arterial spin labeling schemes. Magn Reson Med. 2021;85(4):2027-39.
5. Buxton RB, Frank LR, Wong EC, Siewert B, Warach S, Edelman RR. A general kinetic model for quantitative perfusion imaging with arterial spin labeling. Magn Reson Med. 1998;40:383-96.
6. Dai WY, Garcia D, de Bazelaire C, Alsop DC. Continuous Flow-Driven Inversion for Arterial Spin Labeling Using Pulsed Radio Frequency and Gradient Fields. Magn Reson Med. 2008;60(6):1488-97.
7. Alsop DC, Detre JA, Golay X, Gunther M, Hendrikse J, Hernandez-Garcia L, et al. Recommended implementation of arterial spin-labeled perfusion MRI for clinical applications: A consensus of the ISMRM perfusion study group and the European consortium for ASL in dementia. Magn Reson Med. 2015;73(1):102-16.
8. Guo J, Meakin JA, Jezzard P, Wong EC. An optimized design to reduce eddy current sensitivity in velocity-selective arterial spin labeling using symmetric BIR-8 pulses. Magn Reson Med. 2015;73(3):1085-94.
9. Kim SG. Quantification of relative cerebral blood flow change by flow-sensitive alternating inversion recovery (FAIR) technique: application to functional mapping. Magn Reson Med. 1995;34(3):293-301.
10. Kwong KK, Chesler DA, Weisskoff RM, Donahue KM, Davis TL, Ostergaard L, et al. MR perfusion studies with T1-weighted echo planar imaging. Magn Reson Med. 1995;34(6):878-87.
11. Luh WM, Wong EC, Bandettini PA, Hyde JS. QUIPSS II with thin-slice TI1 periodic saturation: a method for improving accuracy of quantitative perfusion imaging using pulsed arterial spin labeling. Magn Reson Med. 1999;41(6):1246-54.
Figures