0332
Automatic Segmentation of the Great Arteries for Robust Hemodynamic Assessment1University College London, London, United Kingdom, 2Great Ormond Street Hospital, London, United Kingdom
Synopsis
Computational fluid dynamics (CFD) are useful in the assessment of blood flow conditions in patients with congenital heart disease. A necessary, time-consuming step in the creation of CFD models is the segmentation of the anatomy of interest. In this work, a neural network was trained to segment the aorta and the pulmonary arteries in 3D MRI, and its performance was evaluated in the context of a CFD application. The network performs well in terms of Dice score and is shown to lead to accurate pressure and flow velocity fields, with errors at the level of inter-observer variability.
Introduction
Computational fluid dynamics (CFD) is increasingly used for the assessment of blood flow conditions in patients with congenital heart disease (CHD) 1. This requires patient-specific anatomy, typically obtained from segmented 3D CMR. However, segmentation is time-consuming and requires expert input. This study aims to develop and validate a machine learning (ML) method for segmentation of the aorta and the pulmonary arteries.Methods
90 CHD patients were retrospectively recruited for this study. 3D whole-heart, balanced steady-state free precession (bSSFP) images with an isotropic spatial resolution of 1.56 mm were segmented by an experienced observer to obtain ground truth (GT) background, aorta and pulmonary artery labels. In addition, a secondary observer (SO) segmented the test data (see below) to enable investigation of inter-observer variability.The segmentation labels were arranged into a one-hot encoded tensor with 3 channels (background, aorta and pulmonary arteries). The images and corresponding labels were either cropped or zero-padded to a fixed matrix size of 160×96×64 (superior-inferior, anterior-posterior, left-right). Finally, a random train-validation-test split of 70-10-10 examples was performed.
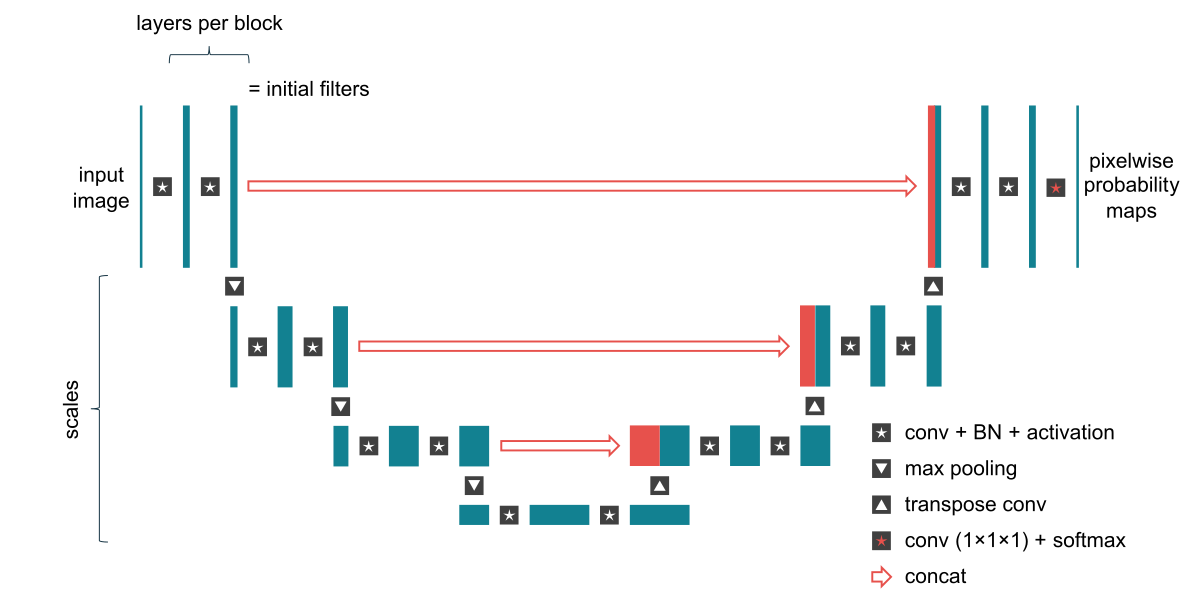
A U-Net 2 convolutional neural network, implemented in TensorFlow, was trained to perform the segmentation. We used the Hyperband algorithm 3 to optimize several hyperparameters (Figure 1). The primary evaluation metric was the mean validation Dice score. Weights were initialized using He’s method 4 and optimized using the Adam algorithm 5.
The optimized ML model was evaluated using per-vessel Dice score on the test set against the ground truth segmentations (ML vs GT). Additionally, the Dice score was calculated for the secondary observer’s segmentation against the ground truth (SO vs GT), and between the ML model and the secondary observer (ML vs SO).
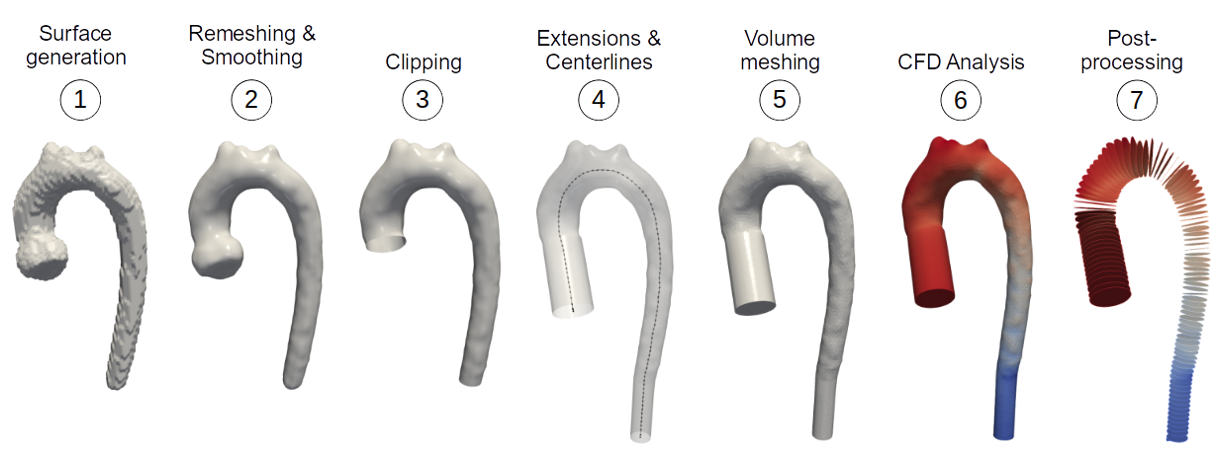
The segmentation masks were converted into finite element volume meshes as shown in Figure 2. CFD simulations were used to estimate the pressure and flow velocity fields in the vessels. To compare 3D flow fields between unstructured meshes, pressures and velocities were averaged across each of 99 planes taken along the centreline. The resulting ML, GT and SO pressure and velocity arrays were compared in a pairwise fashion using the mean absolute percentage error (MAPE).
Friedman tests for repeated measurements were performed to compare ML vs GT, SO vs GT and ML vs SO Dice scores and flow field errors, for both aorta and pulmonary artery segmentations. A p-value < 0.05 was considered statistically significant.
Results
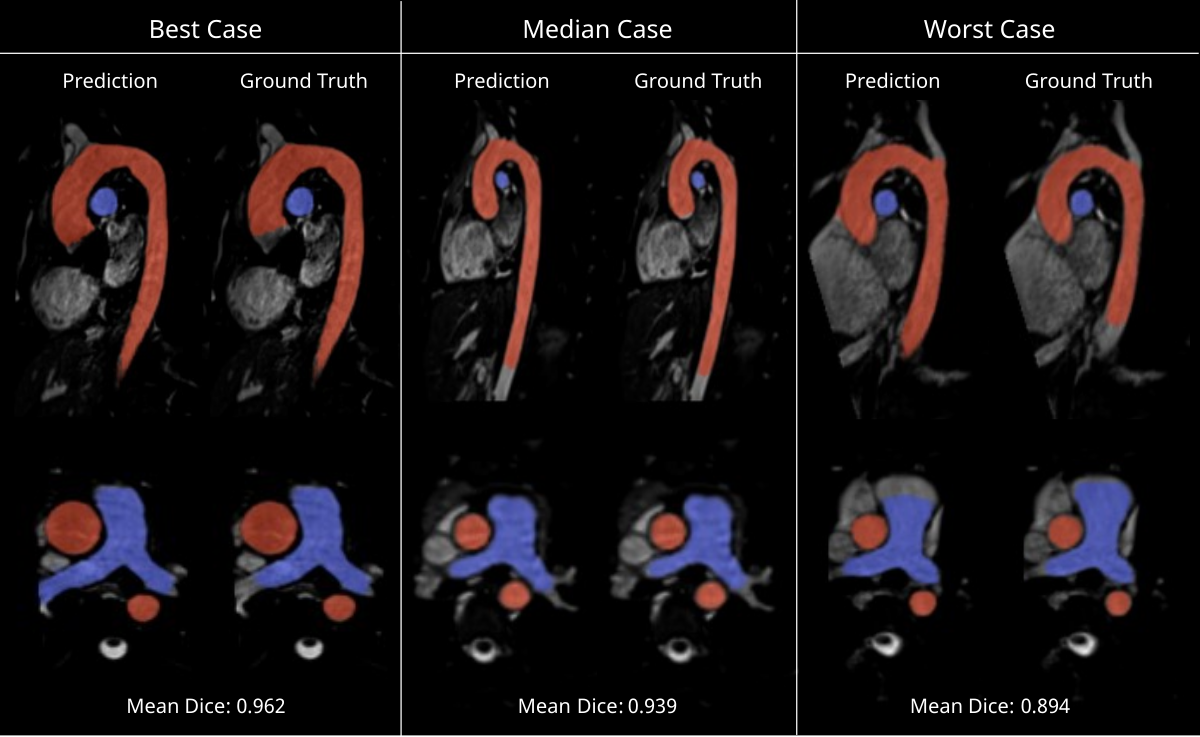
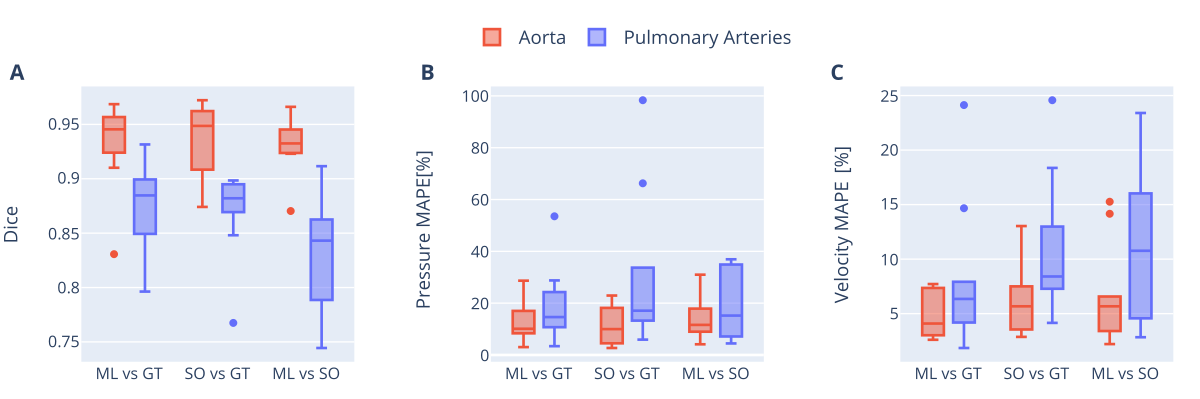
The best performing hyperparameter configuration was as follows: scales = 3, layers per block = 2, base filters = 64, learning rate = 3.46x10⁻⁴, batch size = 2, and loss function = focal Tversky.Segmentation overlays from the test set are shown in Figure 3. The network’s median Dice score (ML vs GT) was 0.945 (interquartile range: 0.929–0.955) for the aorta and 0.885 (0.851–0.899) for the pulmonary arteries (Figure 4A). The inter-observer Dice score (SO vs GT) was 0.949 (0.916–0.960) for the aorta and 0.882 (0.870–0.894) for the pulmonary arteries. Differences between ML vs GT, SO vs GT and ML vs SO Dice scores were not statistically significant (p = 0.741, p = 0.061).
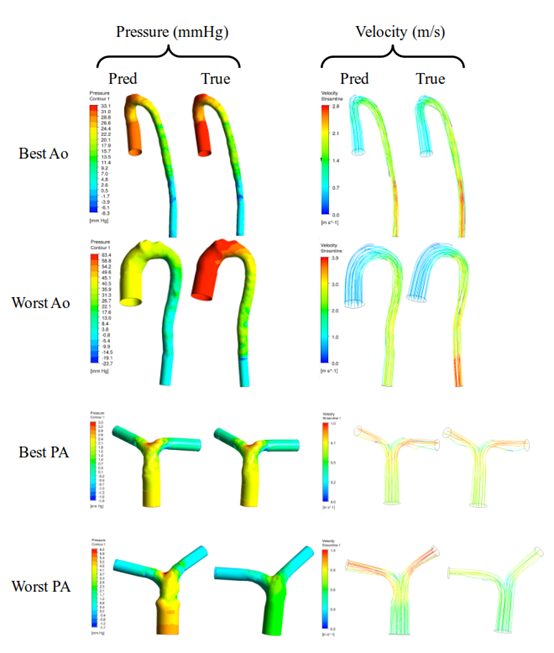
Figure 5 shows volumetric pressure and velocity fields for ML and GT segmentations. Median ML vs GT pressure and velocity errors were 10.1% (8.5–15.7) and 4.1% (3.1–6.9) for the aorta, and 14.6% (11.5–23.2) and 6.3% (4.3–7.9) for the pulmonary arteries. Median inter-observer (SO vs GT) pressure and velocity errors were 10.0% (5.4–16.7) and 5.7% (4.0–7.3) for the aorta, and 17.1% (13.4–32.4) and 8.4% (7.3–12.2) for the pulmonary arteries. Differences between ML vs GT, SO vs GT and ML vs SO pressure and velocity errors were not statistically significant (p > 0.2, see Figure 4B-C).
Discussion
The proposed network achieved high performance in terms of image-based segmentation metrics, in line with previous results 6,7. Visual inspection reveals a few differences, including a tendency of the ML model to classify blood pixels which lie beyond the manually defined proximal and distal vessel limits. A similar effect is observed at the root of arterial branches.There was reasonable agreement between ML- and GT-derived flow fields, and these errors were approximately at the level of inter-observer variability (SO vs GT). However, there were some differences, especially for pressure fields. This might be because of local deviations in surface geometry causing local velocity field derangement, but global upstream pressure errors.
Limitations of this study include the use of a simplified CFD model (laminar, steady state with no patient-specific parameters) and potential loss of local details to the use of plane-averaged data in the flow field comparisons. Future studies should investigate more complex CFD models and include more advanced data analysis techniques.
Conclusion
A neural network was optimized and trained for segmentation of the aorta and the pulmonary arteries. The network errors, in terms of Dice score and flow fields, are at the level of inter-observer error. This fast, automatic method improves the reproducibility of CFD models and reduces the time and effort needed for advanced hemodynamic analysis, making CFD more attractive for routine clinical use.Acknowledgements
We gratefully acknowledge funding support from UK Research and Innovation (UKRI) and Heart Research UK.References
1. Biglino G, Capelli C, Bruse J, Bosi GM, Taylor AM, Schievano S. Computational modelling for congenital heart disease: How far are we from clinical translation? Heart 2017;103:98–103 doi: 10.1136/heartjnl-2016-310423.
2. Ronneberger O, Fischer P, Brox T. U-Net: Convolutional networks for biomedical image segmentation. In: Lecture Notes in Computer Science (including subseries Lecture Notes in Artificial Intelligence and Lecture Notes in Bioinformatics). Vol. 9351. Springer Verlag; 2015. pp. 234–241. doi: 10.1007/978-3-319-24574-4_28.
3. Li L, Jamieson K, Rostamizadeh A, Talwalkar A. Hyperband: A novel bandit-based approach to hyperparameter optimization. J. Mach. Learn. Res. 2018;18:1–52.
4. He K, Zhang X, Ren S, Sun J. Delving deep into rectifiers: Surpassing human-level performance on ImageNet classification. In: Proceedings of the IEEE International Conference on Computer Vision. Institute of Electrical and Electronics Engineers Inc.; 2015. pp. 1026–1034. doi: 10.1109/ICCV.2015.123.
5. Kingma DP, Ba JL. Adam: A method for stochastic optimization. In: 3rd International Conference on Learning Representations, ICLR 2015 - Conference Track Proceedings. International Conference on Learning Representations, ICLR; 2015.
6. Berhane H, Scott M, Elbaz M, et al. Fully automated 3D aortic segmentation of 4D flow MRI for hemodynamic analysis using deep learning. Magn. Reson. Med. 2020;84:2204–2218 doi: 10.1002/MRM.28257.
7. Payer C, Štern D, Bischof H, Urschler M. Multi-label Whole Heart Segmentation Using CNNs and Anatomical Label Configurations. Lect. Notes Comput. Sci. (including Subser. Lect. Notes Artif. Intell. Lect. Notes Bioinformatics) 2017;10663 LNCS:190–198 doi: 10.1007/978-3-319-75541-0_20.
Figures