0331
A 3D Dense-U-Net for fully automated 5D flow MRI segmentation1Department of Radiology, Northwestern University, Feinberg School of Medicine, Chicago, IL, United States, 2Department of Biomedical Engineering, Northwestern University, Evanston, IL, United States, 3Self-employed, Chicago, IL, United States, 4Department of Radiology, Lausanne University Hospital (CHUV) and University of Lausanne (UNIL), Lausanne, Switzerland, 5Center for Biomedical Imaging, Lausanne, Switzerland
Synopsis
Recently, a free-running 5D flow framework was introduced and validated. However, some 5D flow MRI is based on 3D radial imaging, which is limited by reduced SNR that can result in challenges with 3D segmentation. A number of previous studies have investigated automatic segmentation for 4D flow MRI, however these have been traditionally optimized for Cartesian datasets, which are typically acquired over much smaller spatial matrices and cover only one respiratory position. The purpose of this study was thus to adapt and expand a deep-learning framework to cardiac 5D flow MRI data for automatic segmentation of the thoracic aorta.
Introduction
Recently, a fully self-gated, 3D radial, free-running 5D flow (4D flow+respiration) framework was introduced and validated for the assessment of respiratory and cardiac motion-resolved 3D hemodynamics.1, 2 While 5D flow MRI attempted to address traditional limitations associated with respiration control, ECG gating, and scan inefficiency, it is based on 3D radial imaging, which is limited by reduced SNR that can result in challenges related to data post-processing such as the 3D segmentation of cardiac chambers and vessels. Manual 3D segmentation of the thoracic aorta, for example, can take up to 20-30 minutes, and in 5D flow imaging, needs to be repeated for each reconstructed respiratory time point. A number of previous studies have investigated 3D autosegmentation for 4D flow MRI, however these have been traditionally optimized for Cartesian 4D flow datasets, which are typically acquired over much smaller spatial matrices and cover only one respiratory position.3, 4 Kolarik et al. recently introduced an open source 3D Dense-U-Net network that was optimized for high resolution datasets on accessible hardware, with 99% accuracy on autosegmentation of anatomic brain MRI and thoracic vertebrae CT datasets.5 The purpose of this study was thus to adapt and expand this framework to cardiac 5D flow MRI data for deep learning-based automatic segmentation of the thoracic aorta for evaluation of respiratory and cardiac-resolved hemodynamics.Methods
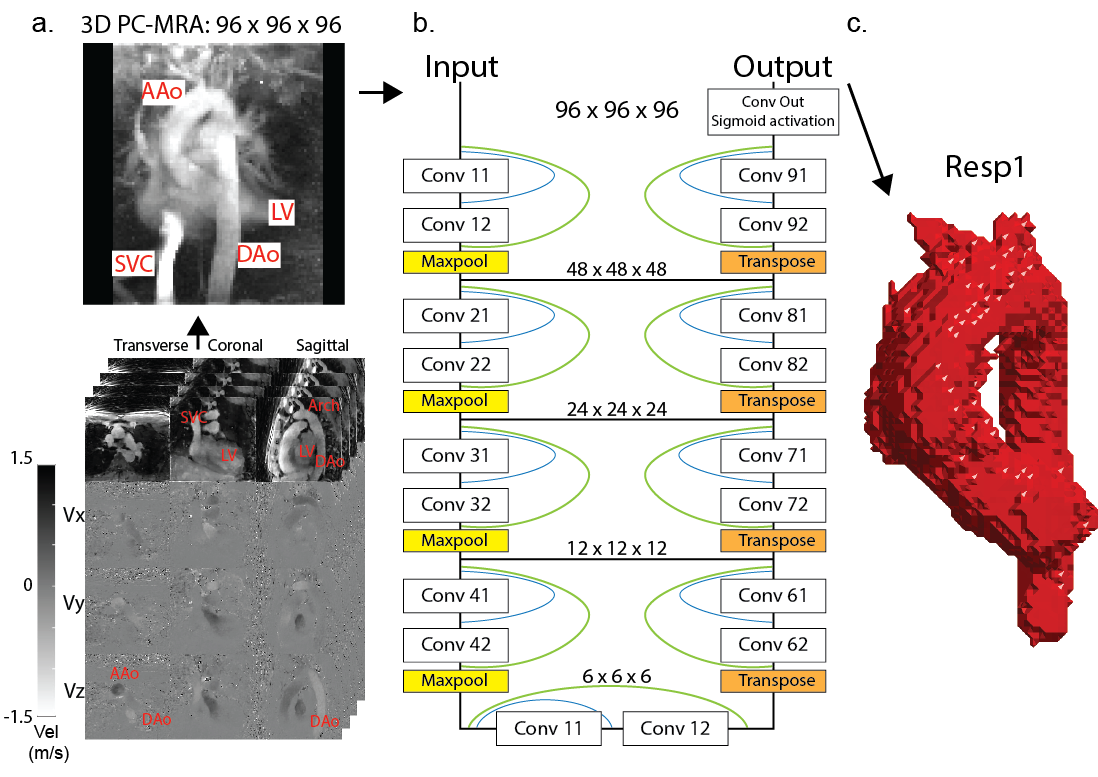
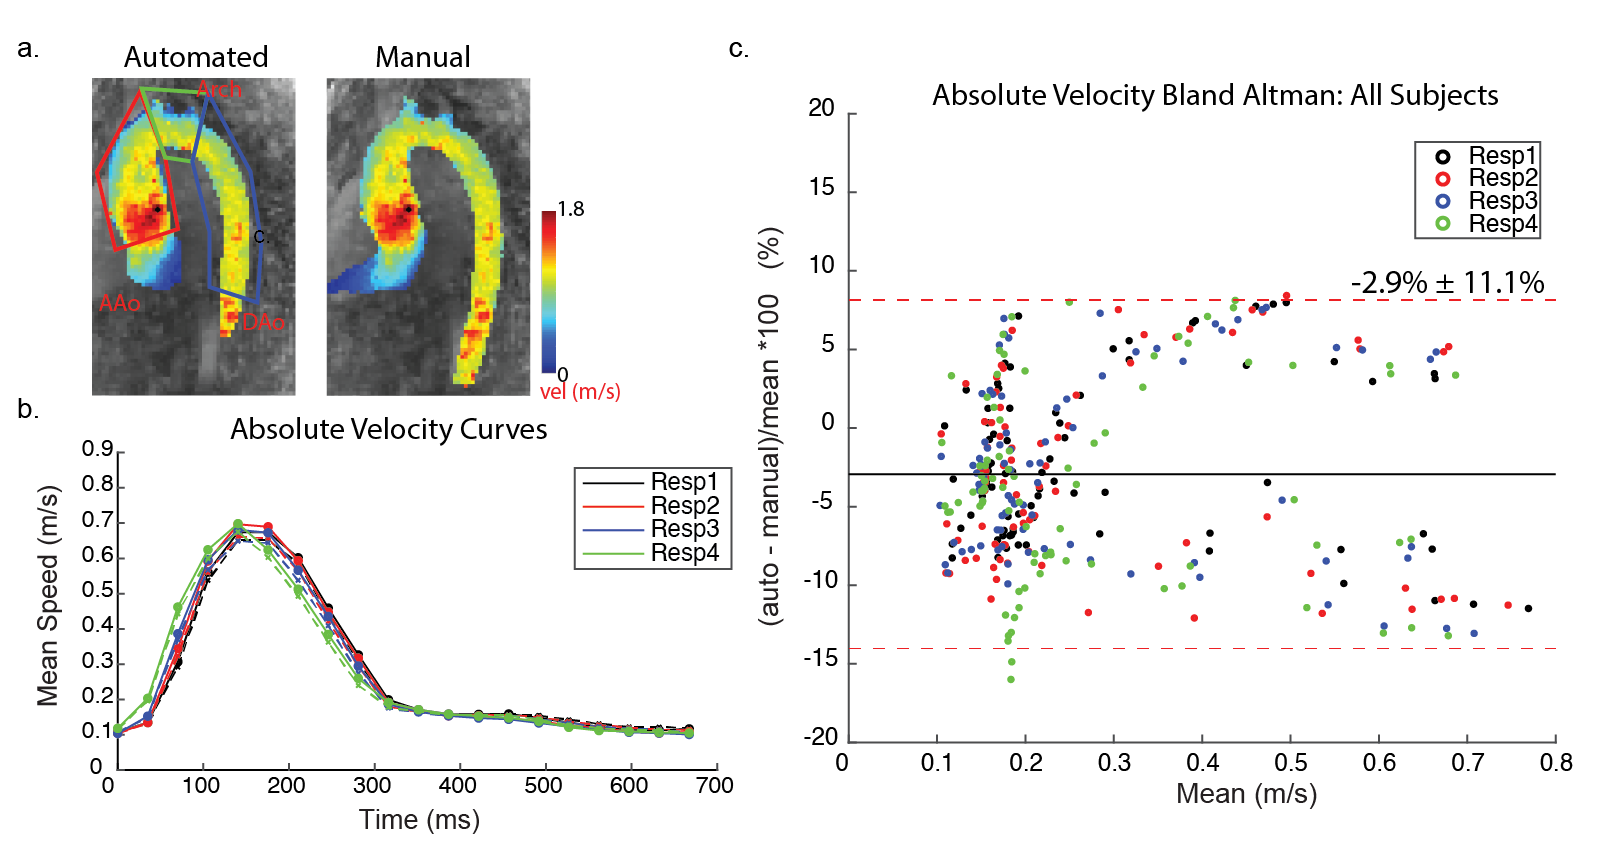
The study included 20 previously described patients with aortic valve/aortic disease who underwent a prototype 5D flow MRI scan (mean age, 49 ± 17 years, 18 men, ~8 minute scan time).2 5D flow MRI (vx, vy, vz + cardiac + respiration) data can also be considered as four separate 4D flow (vx, vy, vz + cardiac) datasets corresponding to four different respiratory positions. A cardiac timepoint-averaged 3D phase-contrast MRA was calculated using both magnitude and velocity data (figure 1a) for each respiratory phase (Resp1-4, end-expiration to end-inspiration) and used to manually segment the thoracic aorta. In total, 4 x 20 patients = 80 aorta segmentations were thus available as labeled ground truth data for network training and testing. A 3D Dense U-Net (figure 1b) was trained on an Alienware m17 R3 personal laptop with 6 cores, 16 Gb RAM, and Nvidia GeForce RTX 2070 GPU. 16 patient datasets were used for training, while 4 were used for testing. Respiratory phases were treated as separate datasets (i.e., 16 patients*4 respiratory phases = 64 datasets used for training, 4 patients*4=16 for testing). Dice similarity coefficients (DSC) were used to evaluate segmentation accuracy. Hemodynamic parameters based on both manual and automated segmentations were evaluated using 2D peak systolic velocity maximum intensity projections (MIP, figure 4a), where peak systolic velocities were calculated in the ascending aorta (AAo), arch, and descending aorta (DAo) for all testing datasets. Time-resolved absolute velocity time curves were calculated by averaging the absolute velocity ($$$ \sqrt{v_x^2+v_y^2+v_z^2} $$$) over the entire segmentation volume, and plotting this value for each cardiac time point (figure 4b).Results
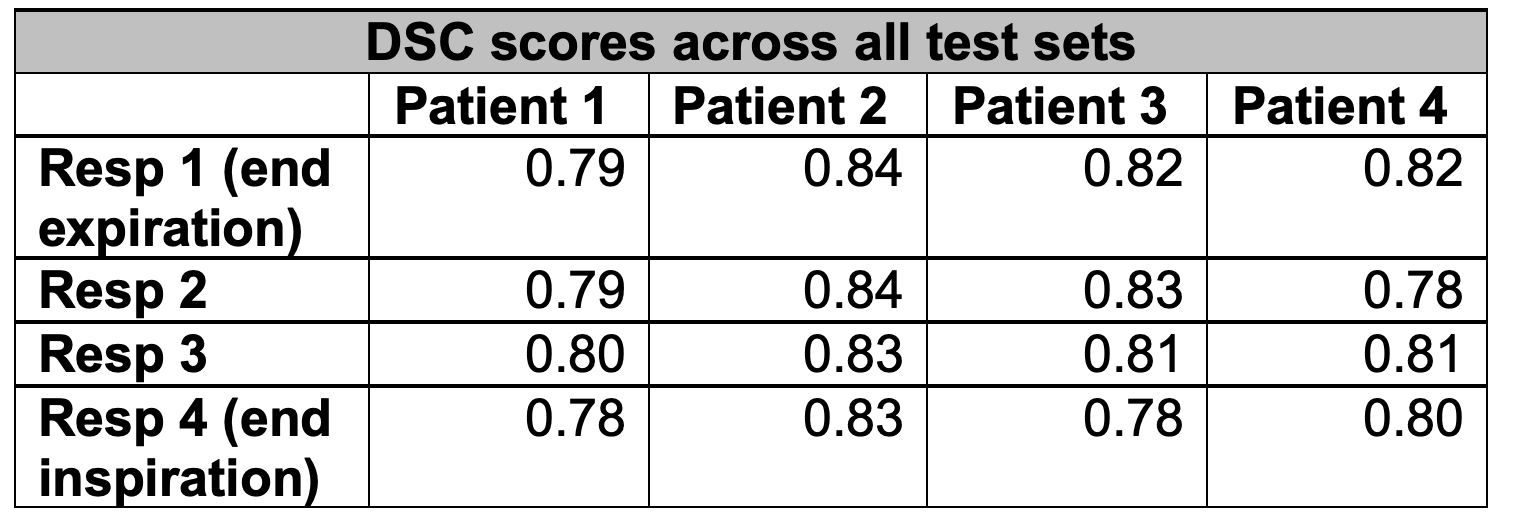
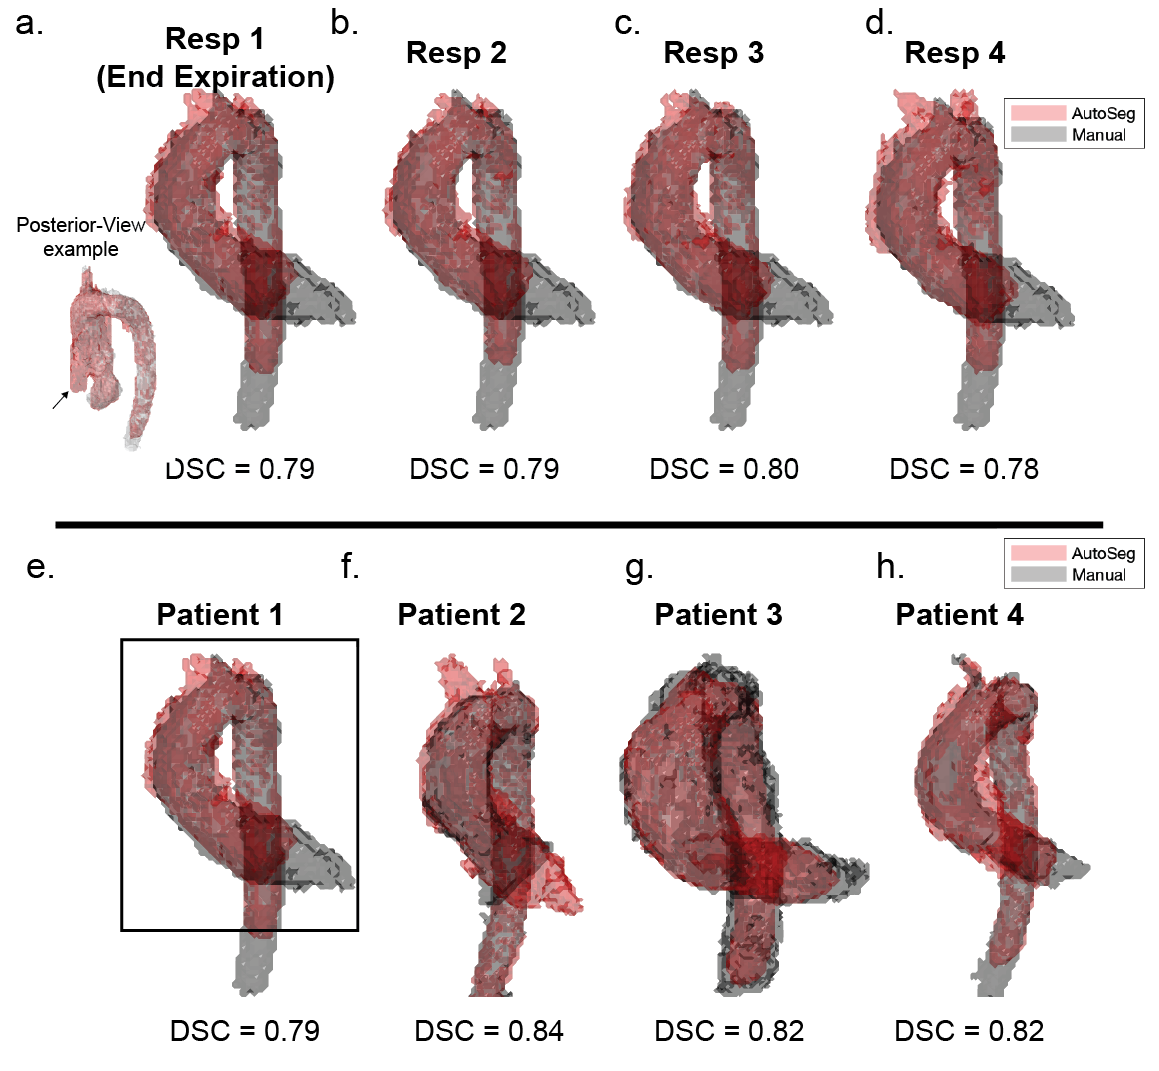
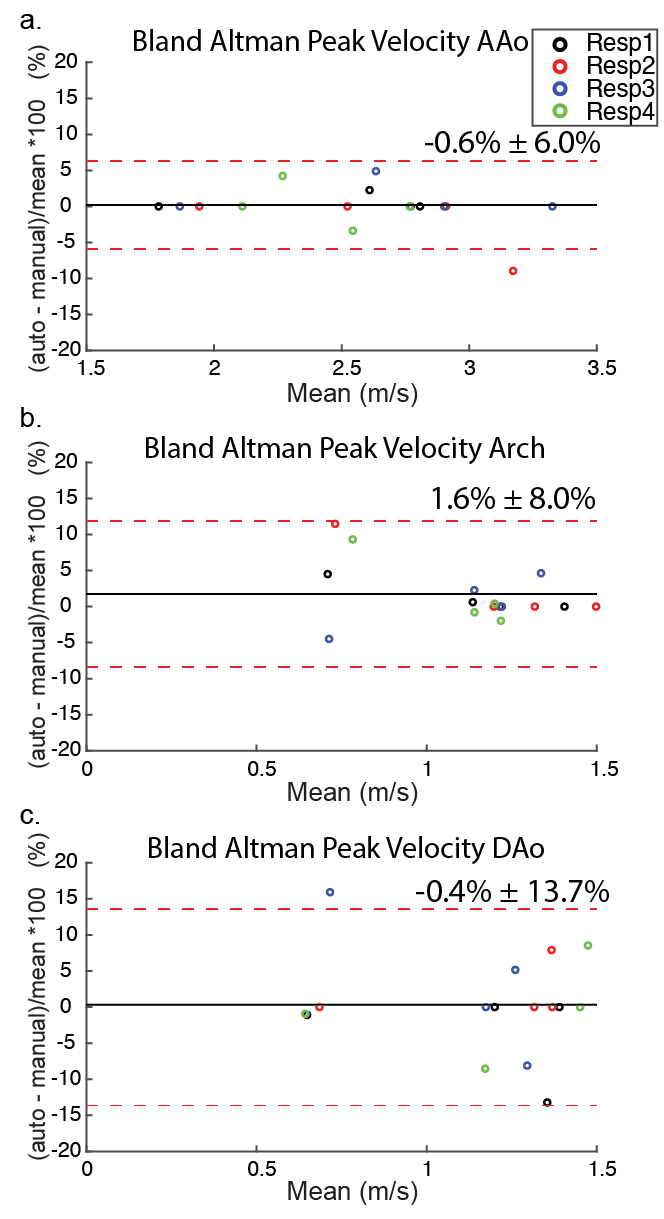
The 3D Dense U-Net architecture was adapted to 5D flow data and trained in a single batch for 50 epochs (training time=35.6 minutes). Automated segmentation of all testing datasets was performed in 5.7 seconds. DSC scores for all patients and respiratory phases ranged from 0.78 to 0.83 (figure 2). End-expiratory (Resp1) automated and manual segmentations for all patients in the testing group are shown in figure 3b. Automated segmentations tended to crop the distal DAo relative to manual segmentations. Thus, manual segmentations were cropped to comparable points of the distal DAo for quantitative comparisons (figure 3e, black box).Peak velocity MIPs showed excellent visual agreement between automated and manual segmentations (figure 4a). Regional peak velocities also showed good-to-excellent agreement between automatic and manual segmentations (auto vs. manual, AAo: 2.56±0.47 m/s vs. 2.56±0.44 m/s , Arch: 1.12±0.26 vs. 1.13 ±0.25, DAo: 1.16±0.31 vs. 1.16±0.30, p>0.05). Bland-Altman analysis demonstrated increasing limits of agreement (LOA) from AAo to DAo (figure 5). Autosegmentation-derived absolute velocity showed good agreement over velocity time curves (figure 4b). Bland-Altman analysis of absolute velocity over all patients further demonstrated good agreement (figure 4c), but a statistically significantly decrease over all respiratory phases and time points compared to manual segmentation (auto: 0.267±0.163 m/s, manual: 0.275±0.168 m/s, p<0.05).
Discussion/Conclusions
This study demonstrated the feasibility of expanding a 3D Dense U-Net for fully automated 3D segmentation of 5D flow MRI data for investigation of cardiac and respiratory-resolved hemodynamics on commercially available hardware. While mean absolute velocities tended to be underestimated by the autosegmentation, this underestimation was well within 10% of the manually-derived values. In addition, peak velocity LOA was increased in the DAo, potentially due the fact that peak velocities in the distal aorta are often closer to the vessel wall, increasing susceptibility to eroded contours as well as segmentation size.While the initial results are promising, this study was limited by the small sample size. In addition, high pressure systems like the thoracic aorta are not primarily influenced by respiratory variation, with major respiratory effects seen primarily in the low-pressure pulmonary circulation. Future studies will include larger sample sizes, K-fold cross-validation, optimization of hyperparameters, as well as segmentation of additional vascular structures included in the 5D flow MR volume.
Acknowledgements
Grant support by NHLBI R01HL115828, NHLBI F30HL137279, NHLBI R21AG055954, and SNF 320030-173129.References
[1] Di Sopra, L., et al., An automated approach to fully self‐gated free‐running cardiac and respiratory motion‐resolved 5D whole‐heart MRI. Magnetic resonance in medicine, 2019
[2] Ma, L.E., et al., 5D flow MRI: a fully self-gated, free-running framework for cardiac and respiratory motion–resolved 3D hemodynamics. Radiology: Cardiothoracic Imaging, 2020. 2(6): p. e200219.
[3] Berhane, H., et al., Fully automated 3D aortic segmentation of 4D flow MRI for hemodynamic analysis using deep learning. Magnetic resonance in medicine, 2020. 84(4): p. 2204-2218.
[4] Bustamante, M., et al., Atlas-based analysis of 4D flow CMR: automated vessel segmentation and flow quantification. Journal of Cardiovascular Magnetic Resonance, 2015. 17(1): p. 1-12.
[5] Kolařík, M., et al., Optimized high resolution 3D dense-U-Net network for brain and spine segmentation. Applied Sciences, 2019. 9(3): p. 404.
Figures