0327
Quantitative imaging of brain to cerebrospinal fluid molecular clearance1Department of Applied Physics and Electronics, Umeå University, Umeå, Sweden, 2Umeå Center for Functional Brain Imaging (UFBI), Umeå University, Umeå, Sweden, 3Department of Radiation Sciences, Umeå University, Umeå, Sweden, 4Department of Clinical Science, Umeå University, Umeå, Sweden
Synopsis
The pathways of brain molecular clearance and potential glymphatic efflux to extracerebral cerebrospinal fluid is a matter of intense research. We investigated possible contrast enrichment in cerebrospinal fluid of the subarachnoid space following intravenous contrast injection. This approach utilizes a subtle but widespread contrast leakage across the blood-brain barrier that potentially enables the investigation of glymphatic function. Using T1-mapping as well as dynamic scanning during contrast infusion, we present data consistent with a model where molecules cleared from the brain enter subarachnoid space cerebrospinal fluid. This approach could be a clinically feasible alternative for investigating brain molecular clearance in humans.
Introduction
Human brain clearance of metabolic waste depends on multiple routes including the blood-brain barrier1 and the recently described glymphatic system2 where cerebrospinal fluid (CSF) flushes the central nervous system. According to glymphatic system theory, there is a bulk flow through the cerebral interstitial fluid that brings molecules out of the brain via several possible pathways. Whether glymphatic efflux leads directly out of the central nervous system or into the (extracerebral) CSF circulation is a matter of intense discussion3. Here we investigated possible contrast enrichment in CSF of the subarachnoid space during and at delayed time-points after intravenous contrast injection using quantitative imaging. This concept utilizes a widespread small leakage of contrast across the blood-brain barrier4 that potentially enables the investigation of glymphatic flow.Methods
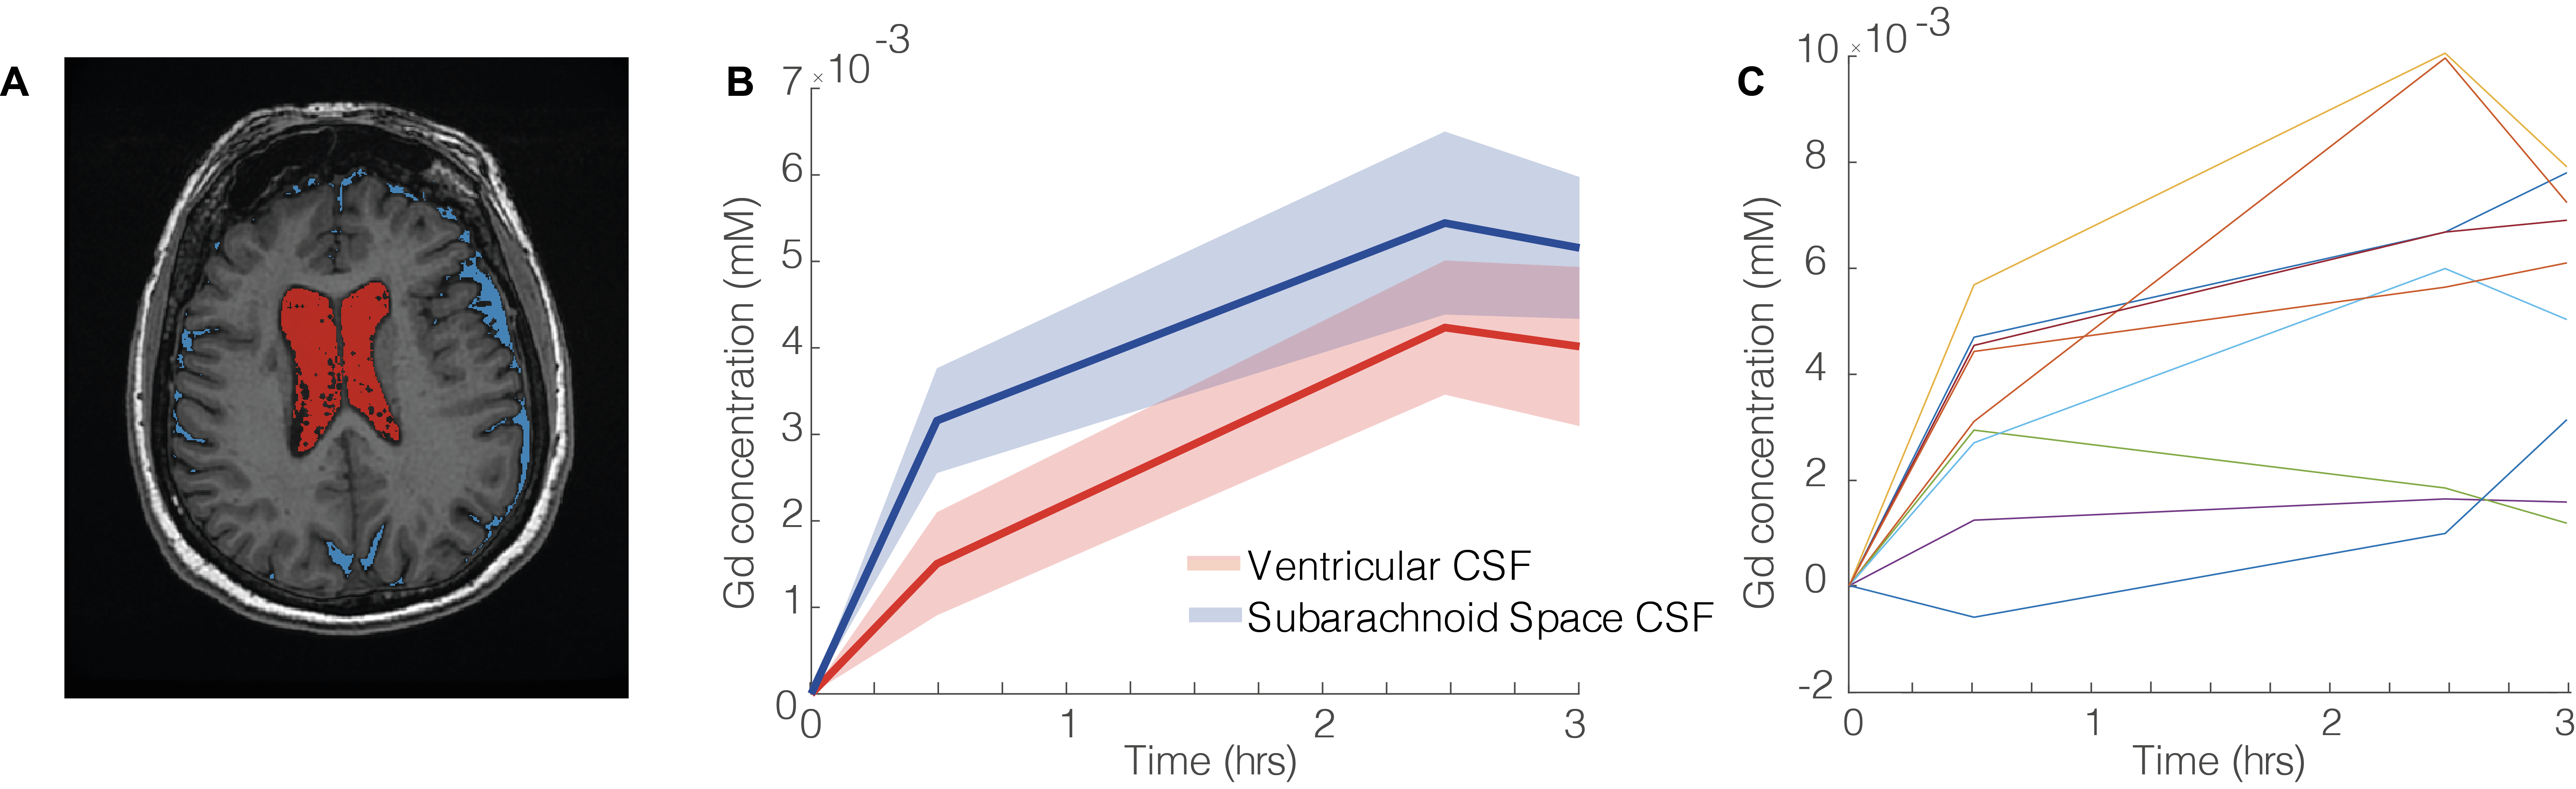
The present study included nine older individuals selected from the general population (age 76±4 years). All participants underwent scanning with 3T MRI (Discovery MR 750, General Electric) with two complementary quantitative imaging approaches: (1) high-resolution T1 mapping at baseline and at three delayed time-points following an intravenous gadolinium injection and (2) a 17.5 minute long high resolution dynamic contrast enhanced imaging sequence following the uptake. High-resolution T1 mapping was based on the variable flip angle method using a spoiled gradient echo sequence (SPGR) and scan parameters were: TR/TE = 8.2ms/3.2ms and FA=12 °and 2°, with isotropic 1mm acquisition voxel size. The imaging parameters for the dynamic contrast enhanced imaging SPGR sequence were: TR/TE = 4.5ms/1.6ms and FA=12 °, with isotropic 1.5 mm acquisition voxel size with partial Fourier 6/8 and parallel imaging factor of 2 to increase sample rate (temporal resolution was 17.5 seconds). A low-resolution B1 map was collected to correct for spatial variations in the effective flip angle. Using the T1 maps as well as the dynamic imaging data, the contrast concentration in CSF was calculated. To infer whether a choroid plexus leakage was driving contrast enhancement, separate analyses were performed for ventricular and subarachnoid space CSF. Three conditions were utilized to isolate pure CSF voxels in the lateral ventricles; C1: CSF probability according to SPM12’s “segment”-tool of greater than 50%, C2: Baseline T1 between 4000 ms and 10000 ms and C3: lateral ventricles label in segmentation computed using Freesurfer v7.0. The mask was constructed using the expression C1 ∩ C2 ∩ C3 and erosion of 1 voxel was implemented to reduce partial volume effects. CSF of subarachnoid space was segmented using an identical expression except that condition C3 was changed to include only voxels unlabeled by Freesurfer (Fig. 1A).Inspired by the approach to determine subtle blood-brain barrier leakage5, a Patlak analysis was performed on the dynamic imaging data to determine the rate of molecular clearance into CSF (K), under the assumption of irreversible uptake. For this analysis, a vascular input function was derived using a manually drawn region of interest in the superior sagittal sinus. A multiple regression approach was employed to determine K.
Differences in contrast enrichments derived from high resolution T1 maps were evaluated using one-sample t-tests. Associations between K and contrast enrichments derived from high resolution T1 maps were calculated using Pearson correlation. Due to the limited sample size, one-tailed tests were employed.
Results
Quantitative T1 mapping for ventricular and subarachnoid CSF revealed a largely synchronized contrast enrichment present on the first post-contrast scan (~0.5 hours), peaking on the second post-contrast scan (~2.5 hours), and finally beginning to decrease at the last post-contrast scan (3 hours), see Fig. 1B and 1C. Importantly, the concentration at the second post-contrast time point was greater than for the first post-contrast time point for both ventricle and subarachnoid space CSF (P=0.013 and P=0.009, respectively), indicating ongoing clearance to CSF. In addition, the initial contrast concentration in the subarachnoid space surpassed that of the cerebral ventricles (P=0.037), indicating that choroid plexus leakage alone could not have generated the observed subarachnoid space enrichment. The dynamic imaging revealed an average molecular clearance rate, K, to subarachnoid space CSF of 0.38±0.18 (× 10-3 min-1), significantly different from zero (P=1.2 × 10⁻⁴). There was a correlation between K and the level of subarachnoid space CSF contrast enrichment determined from the high resolution T1 mapping at the first post-contrast time point (R=0.58, P=0.049). This association was attenuated for the two later time points (R=0.29 and R=0.26, respectively). Importantly, molecular clearance rate to ventricular CSF was unrelated to subarachnoid space CSF contrast concentration determined from the high resolution T1 mapping (P>0.5 for all time points).Discussion & Conclusion
We observed that intravenous contrast administration caused contrast enhancement in the subarachnoid space CSF that was not driven by choroid plexus leakage during the time-scales employed in our experiment. This is a potentially important difference compared to contrast studies performed in rats where ventricular enhancement leads subarachnoid space enhancement6. Importantly, the image derived CSF contrast concentrations observed in this study agrees with observations from mass-spectroscopy (experiments that cannot separate choroid plexus leakage from direct subarachnoid space enrichment)7. We believe that our observations open up for new strategies to study human brain clearance that may be feasible in clinical settings.Acknowledgements
We want to acknowledge research nurse Hanna Ackelind for excellent handling of research persons.
The study was supported by the Swedish Research Council and the Swedish Foundation for Strategic Research.
References
1. Tarasoff-Conway, J. M. et al. Clearance systems in the brain - Implications for Alzheimer disease. Nature Reviews Neurology 11, 457–470 (2015).
2. Xie, L. et al. Sleep drives metabolite clearance from the adult brain. Science (80-. ). (2013). doi:10.1126/science.1241224
3. Mogensen, F. L. H., Delle, C. & Nedergaard, M. The glymphatic system (En)during inflammation. Int. J. Mol. Sci.22, 1–20 (2021).
4. Montagne, A. et al. Blood-Brain barrier breakdown in the aging human hippocampus. Neuron 85, 296–302 (2015).
5. Thrippleton, M. J. et al. Quantifying blood-brain barrier leakage in small vessel disease: Review and consensus recommendations. Alzheimer’s Dement. 15, 840–858 (2019).
6. Jost, G. et al. Penetration and distribution of gadolinium-based contrast agents into the cerebrospinal fluid in healthy rats: a potential pathway of entry into the brain tissue. Eur. Radiol. 27, 2877–2885 (2017).
7. Nehra, A. K. et al. Accumulation of gadolinium in human cerebrospinal fluid after gadobutrol-enhanced MR imaging: A prospective observational cohort study. Radiology 288, 416–423 (2018).
Figures