0326
On the origin of a potential clearance marker: The contribution of enlarged perivascular fluid diffusion to a 7T IVIM interstitial fluid proxy1Department of Radiology & Nuclear Medicine, Maastricht University Medical Center, Maastricht, Netherlands, 2School for Mental Health & Neuroscience, Maastricht University, Maastricht, Netherlands, 3Department of Biomedical Engineering, Eindhoven University of Technology, Eindhoven, Netherlands, 4Siemens Healthcare, Erlangen, Germany, 5Department of Psychiatry & Neuropsychology, Maastricht University, Maastricht, Netherlands, 6School for Cardiovascular Disease, Maastricht University, Maastricht, Netherlands, 7Department of Electrical Engineering, Eindhoven University of Technology, Eindhoven, Netherlands
Synopsis
Between the parenchymal and microvascular diffusion components, a third, intermediate component can be derived with cerebral IVIM. Its fraction (fint) seems a promising biomarker for altered cerebral clearance function. fint has been suggested to both be driven by fluid diffusivity within enlarged perivascular spaces (ePVS) and interstitial fluid between parenchymal cells. Using 7T MRI, this study determined a higher fint within the ePVS (through segmented masks) compared to surrounding non-ePVS tissue. Thereby, this study illustrates the contribution of ePVS fluid diffusivity to fint and highlights the ability to specifically assess ePVS fluid diffusion using a non-invasive MRI method.
Introduction
Recently, an intermediate component (fint) was identified between the two traditional components of cerebral intravoxel incoherent motion (IVIM) (i.e., microvascular and parenchymal), which is considered to represent increased interstitial fluid (ISF).1,2 fint has previously been found to be associated to both vascular and neurodegenerative markers in a memory clinic sample, and was suggested to relate to alterations in cerebral clearance.2A previous study demonstrated that fint is related to the number of enlarged perivascular spaces (ePVS) in the basal ganglia (BG),1 a region known for the presence of ePVS.3 Additionally, it was suggested that fint relates to the ISF-volume between the parenchymal cells.1,2 However, it remains unclear to what extent elevated fint is representative of increased fluid within the ePVS or larger ISF-volume between cells. Both of these factors play a crucial role in the clearance system. Where PVS are the fluid-filled spaces which surround cerebral blood vessels and transport fluid from the subarachnoid space into the parenchyma, ISF is the fluid through which waste products are flushed through the parenchyma.4 To enable potential future usage of fint as a non-invasive marker of cerebral clearance, more knowledge on the underlying fluid diffusivity of the intermediate component is required.
Ultrahigh-field MRI (7T) allows for a high spatial resolution and enables automatic segmentation of ePVS.5 By identifying voxels containing ePVS,6 fint values within these voxels can be compared with fint values from surrounding tissue. If fint would be driven, at least to some extent, by diffusion of fluid within ePVS, it is expected that fint is elevated within the ePVS compared to surrounding non-ePVS tissue.
Methods
Subjects: Sixteen healthy elderly subjects were included in this study (Age (mean±SD): 63.9±5.3 years, 14 female).MRI acquisition: All subjects underwent high-field MRI (7T research system, Siemens Healthcare, Erlangen, Germany) using a 32-element channel phased-array head coil. Diffusion MR images (acquired with a prototype sequence) and anatomical T1-weighted and T2-weighted images were acquired for all subjects (Table 1).
Anatomical image analysis: The BG were automatically segmented using the T1-weighted images (Freesurfer, version 5.1.0). After coregistering the T1-weighted image to T2-weighted space (FLIRT, FSL),7 enhanced perivascular space contrast (EPC) images were calculated by dividing the T1-weighted image by the T2-weighted image6 (Figure 1) (Matlab 2019b; MathWorks). From the EPC images, the BG were extracted. The ePVS mask was derived through the multiplication of an intensity filtered EPC image and a Frangi filtered EPC image.8
Resulting BG and ePVS masks were coregistered to native IVIM image space (FLIRT, FSL).7 The non-ePVS mask was calculated by subtracting the ePVS mask from the BG mask, and subsequently slightly eroded (1 voxel) to reduce partial volume effects.
IVIM image analysis: Trace images were calculated, corrected for geometric susceptibility induced distortions (topup, FSL version 6.0.1),9 head displacements and eddy currents (ExploreDTI version 4.8.4).10
Spectral analysis using non-negative least squares (NNLS) was conducted to analyse the IVIM data in a voxel-based manner.1 The intermediate diffusion component (Dint) was identified as 1.5*10-3 mm2/s<Diffusivity<4.0*10-3 mm2/s. fint was calculated by dividing the amplitude(s) in the intermediate range by the sum of all amplitudes on the spectrum, while correcting for T1- and T2-relaxation effects (Figure 2).1 To solve the NNLS, 80 basis functions were used, logarithmically spaced between .1*10-3 and 200*10-3mm2/s. Additionally, a regularisation smoothing constraint was added, allowing a misfit between 2% and 2.5%. The median values of Dint and fint were extracted for the ePVS and eroded non-ePVS mask separately.
Statistical analysis: To examine whether part of the intermediate component is driven by diffusion of fluid within the ePVS, fint and Dint values from within the ePVS mask were compared with values from non-ePVS voxels in the BG using Wilcoxon Signed-Rank Tests (IBM SPSS statistics version 25).
Results
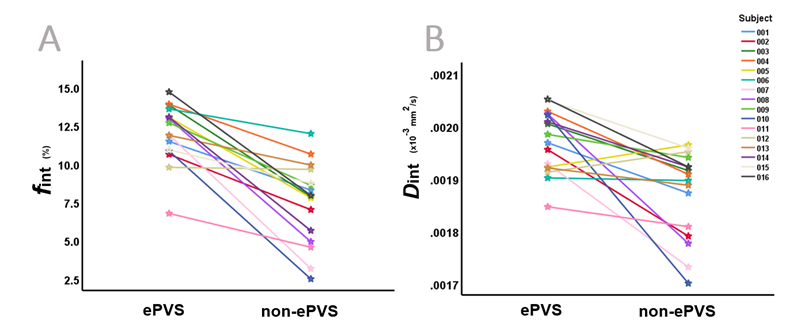
Figure 3 contains a graphic summary of the statistical comparison between the parameters of the intermediate component derived from the ePVS and non-ePVS voxels in the BG. Significantly higher Dint and fint are observed in the ePVS compared to the non-ePVS tissue (Figure 4).Discussion
In line with previous research indicating an association between fint and ePVS occurence,1 a higher IVIM-derived proxy of ISF and a higher ISF diffusivity were identified within the ePVS as compared with surrounding non-ePVS tissue.These findings endorse an influence of ePVS fluid diffusivity on fint. In contemporary IVIM analyses, the distinct contributions of fint in ePVS and non-ePVS to the total signal are not considered. By determining a higher fint in ePVS than in non-ePVS tissue, this study demonstrates that ePVS fluid diffusivity has an underlying effect on fint values in ROI-analyses that should be considered when interpreting fint.
Furthermore, higher ISF diffusivity (Dint) was observed within the ePVS. As ePVS are fluid-filled spaces surrounding cerebral blood vessels, water particles within the ePVS have more space to diffuse unrestrictedly in the directions parallel to the vessels than the ISF throughout the parenchyma.
By showing the possibility to disentangle the contribution of ePVS diffusivity to fint, the potential of this method to independently assess fluid diffusion values of ePVS and ISF is introduced. Thereby, valuable information could be obtained on which part of the clearance system is impaired in various neurological diseases.
Acknowledgements
This research was supported by Alzheimer Nederland (research grant WE.03-2018-02).References
1. Wong S, Backes W, Drenthen G, et al. Spectral Diffusion Analysis of Intravoxel Incoherent Motion MRI in Cerebral Small Vessel Disease. Journal of Magnetic Resonance Imaging. 2019.
2. van der Thiel MM, Freeze WM, Verheggen IC, et al. Associations of increased interstitial fluid with vascular and neurodegenerative abnormalities in a memory clinic sample. Neurobiology of Aging. 2021;106:257-267.
3. Wardlaw JM, Benveniste H, Nedergaard M, et al. Perivascular spaces in the brain: anatomy, physiology and pathology. Nature Reviews Neurology. 2020:1-17.
4. Iliff JJ, Wang M, Liao Y, et al. A paravascular pathway facilitates CSF flow through the brain parenchyma and the clearance of interstitial solutes, including amyloid β. Science translational medicine. 2012;4(147):147ra111-147ra111.
5. Barisano G, Law M, Custer RM, Toga AW, Sepehrband F. Perivascular space imaging at ultrahigh field MR imaging. Magnetic Resonance Imaging Clinics. 2021;29(1):67-75.
6. Sepehrband F, Barisano G, Sheikh-Bahaei N, et al. Image processing approaches to enhance perivascular space visibility and quantification using MRI. Scientific Reports. 2019;9(1):12351.
7. Jenkinson M, Bannister P, Brady M, Smith S. Improved optimization for the robust and accurate linear registration and motion correction of brain images. Neuroimage. 2002;17(2):825-841.
8. Frangi AF, Niessen WJ, Vincken KL, Viergever MA. Multiscale vessel enhancement filtering. 1998; Berlin, Heidelberg.
9. Andersson JL, Skare S, Ashburner J. How to correct susceptibility distortions in spin-echo echo-planar images: application to diffusion tensor imaging. Neuroimage. 2003;20(2):870-888.
10. Leemans A, Jeurissen B, Sijbers J, Jones D. ExploreDTI: a graphical toolbox for processing, analyzing, and visualizing diffusion MR data. Paper presented at: Proc Intl Soc Mag Reson Med2009.
Figures
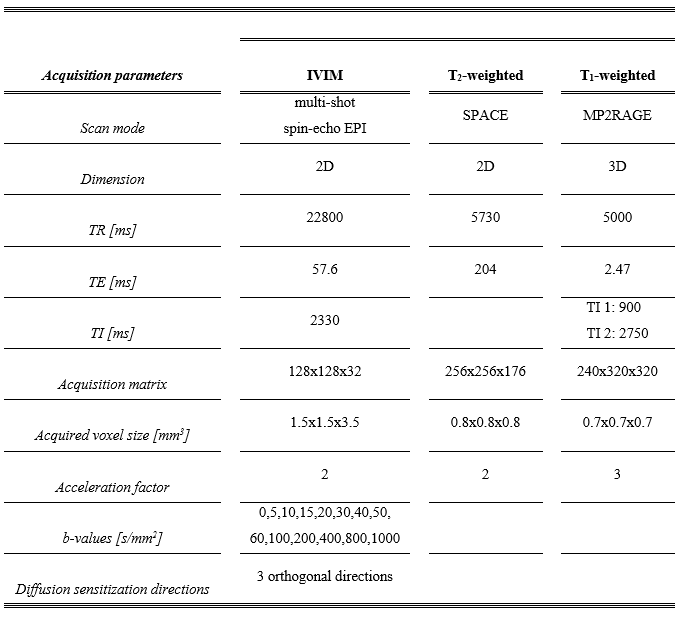
Abbreviations: IVIM, intravoxel incoherent motion; TR, repetition time; TE, echo time; TI, inversion time; EPI, echo planar imaging.
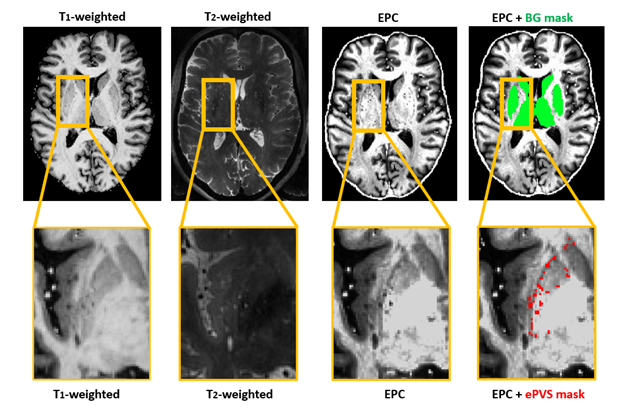
Abbreviations: EPC, enhanced perivascular space contrast; ePVS, enlarged perivascular space, BG = Basal ganglia.
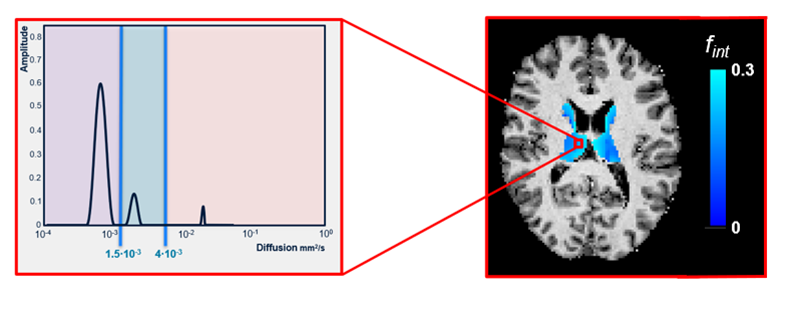
purple = parenchymal diffusion range, blue = intermediate diffusion range, pink = microvascular pseudodiffusion range.
Abbreviations: fint, intermediate peak fraction.
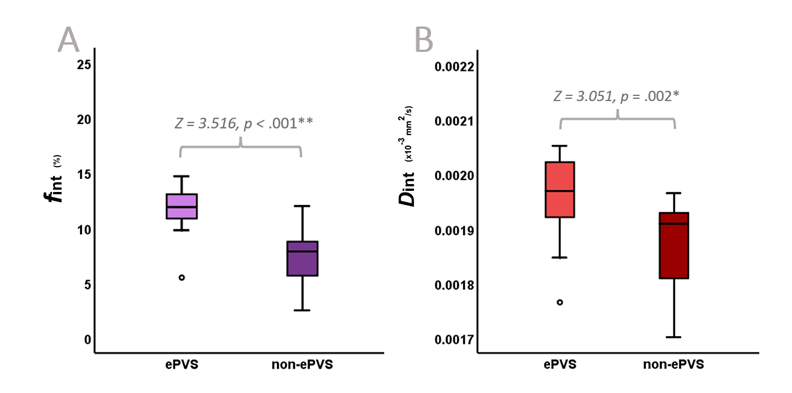
Figure 3. Boxplots visualizing the results of the Wilcoxon Signed-Rank Tests. Significant differences are found between the ePVS and surrounding non-ePVS tissue derived fint (A) and Dint (B) values within the basal ganglia.
After removal of the outliers, even larger differences are observed between ePVS and non-ePVS values. Therefore, we report the results based on the whole sample in this study, with the outliers included in analyses.
Abbreviations: ePVS, enlarged perivascular spaces; fint, intermediate peak fraction; Dint, intermediate peak diffusion.
*p ≤.01,**p ≤.001.
Abbreviations: ePVS, enlarged perivascular spaces; fint, intermediate peak fraction; Dint, intermediate peak diffusion