0325
Age dependent cerebrospinal fluid-tissue water exchange detected by non-invasive magnetization transfer indirect spin labeling MRI1F.M. Kirby Research Center for Functional Brain Imaging, Kennedy Krieger Research Institute, Baltimore, MD, United States, 2Department of Electronic Science, Xiamen University, Xiamen, China, 3Division of Neurobiology, The Johns Hopkins University School of Medicine, Baltimore, MD, United States, 4Russell H. Morgan Department of Radiology and Radiological Science, The Johns Hopkins University School of Medicine, Baltimore, MD, United States
Synopsis
Our understanding of the CSF exchange with surrounding tissues and its correlation with brain function is limited. We presented a non-invasive magnetization transfer indirect spin labeling (MISL) MRI method to quantify the water exchange between cerebrospinal fluid (CSF) and surrounding tissues in the brain by making use of the significantly different protein concentrations between CSF and other tissues. Water in the surrounding tissue is directly labeled by magnetization transfer from the abundant macromolecule pool. The reduction in the CSF signal corresponds to the water traveled to CSF, which is strongly age-dependent and weakly AQP4-dependent.
Introduction:
The CSF exchange with other tissues, e.g., the parenchyma and ependymal layers, and the correlation with brain function were not well documented. 1-4The CSF water exchange may also impact the recently discovered glymphatic system. Magnetization transfer indirect spin labeling (MISL) MRI is a non-invasive and translational MRI technique that assesses the CSF water exchanging process with surrounding tissues by selectively labeling water molecules in the other tissues, e.g., ependyma, parenchyma, and blood (Fig. 1a).Method:
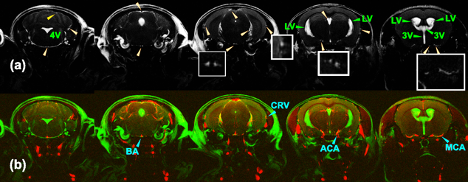
MISL sequences label the macromolecules in the brain tissues, e.g., ependyma, parenchyma, and blood. The labeled magnetization transfers from the macromolecules’ protons to water. The MT pulses do not attenuate the CSF signal due to the trace protein concentration (200 times lower than blood plasma).1 The signal reduction of CSF is due to water exchange between tissues and CSF. Therefore, the CSF water exchange can be monitored. (Fig. 1b) To determine the perivascular space in a mouse brain, the mouse brain angiography was collected with the time-of-flight sequence based on the fast low angle shot (FLASH) with the identical geometry as the TSE sequence (Fig. 2) (n=3, age 12-month).In the pulsed MISL, we implemented a short Gaussian selective pulse (150 ms pulse width and 8 µT peak power) followed by a post-labeling delay to allow the labeled tissue water exchange with CSF before an MRI acquisition with a long echo time (LongTE-TSE) (Fig. 1c) to read the CSF, perivascular space, and the glymphatic vessels and to suppress the parenchyma MRI signal.
In the continuous MISL, a train of Gaussian saturation pulses (30 ms pulse width, 4 µT peak power, 100 pulse number) was applied. MISL signal (∆Z) was obtained by subtracting the label MRI at -3.5 ppm from the control MRI at 200 ppm (Fig. 1d). Cerebrospinal fluid (CSF) was extracted from the mouse ventricles for the MISL optimization and validation. The sequence is identical to the conventional pulsed and continuous wave CEST sequence, except one PLD can be added before the MRI readout. The MRI readout is identical to the pulsed MISL method for multi-PLD study, i.e., single-slice LongTE-TSE readout, while a multi-slice LongTE-TSE was used for the single PLD study.
Results:
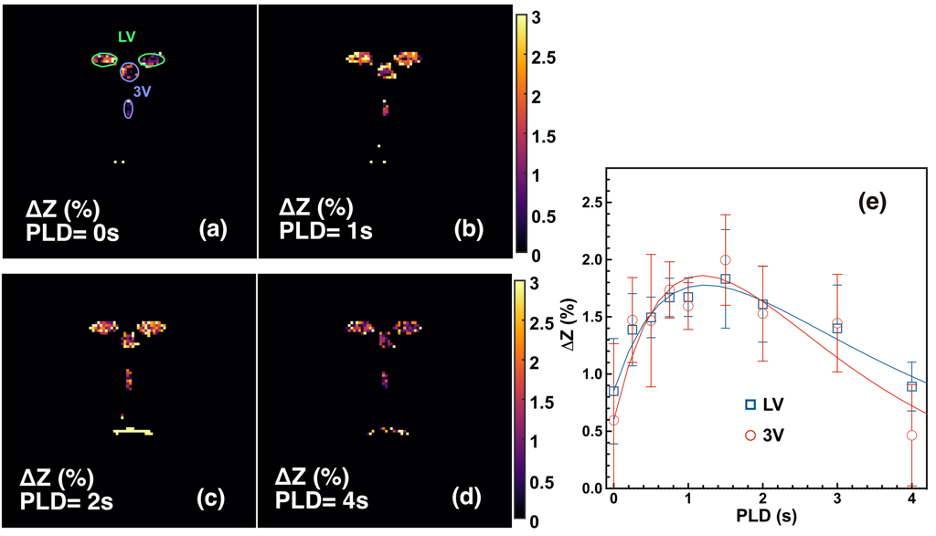
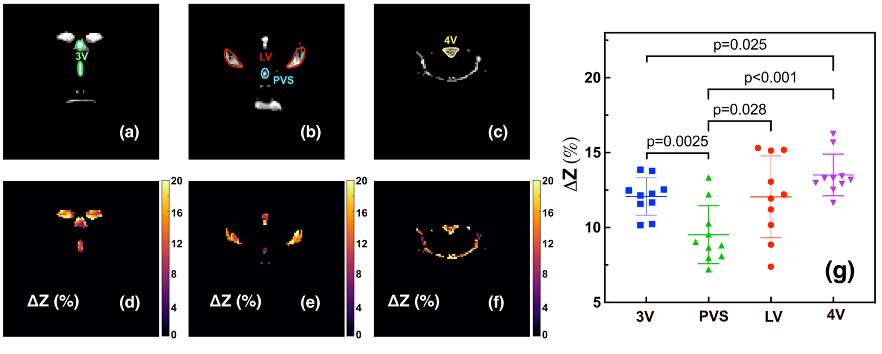
With pulsed-MISL, the kinetic curve peaked at 1.5 s, with 1.8±0.4% for the lateral ventricle (LV) and 2.0±0.4% for the third ventricle (3V). CSF water exchange value= 1320±600 ml/100ml/min and R1a=1.25±0.5 s-1 were determined for 3V (Fig. 3e).With the continuous-MISL, the 4V showed the highest ∆Z signal (13.5±1.4 %), and the 3V (12.0±1.3 %) had a similar ∆Z as LV (12.0±1.8 %). The PVS ∆Z (9.5±1.9 %) was significantly lower than the ventricles ∆Z (p<0.028). The CSF water exchange value =1083±400 ml/100ml/min for LV and R1a=1.25±0.34 s-1 were extracted from fitting the pulsed MISL buildup curves with Eq.9. CSF water exchange value =1320±600 ml/100ml/min and R1a=1.25±0.5 s-1 were determined for 3V (Fig. 4e). Significant differences were obtained between young WT and adult WT for all the ventricles (LV: 13.7% reduction; 3V:18.7 % reduction; 4V: 9.3 % reduction), while the PVS ∆Z values of adult WT were not significantly lower than the young WT in trend. For the AQP4-/- mice, the LV and 4V ∆Z and CSF water exchange values were smaller but not significant than those of the age-matched WT mice (LV:8.3% reduction; 4V: 5.9% reduction; LV: p=0.33; 4V: p=0.16) (Fig. 5), while the 3V and PVS values were similar for the age-matched WT and AQP4-/- mice.
Discussion:
The result highlights the sensitivity of the MISL approach in the non-invasive assessment of CSF water exchange in the brain. The measured CSF water exchange by continuous MISL (830±40 ml/100ml/min) was slightly lower than that obtained by pulsed MISL (1083-1320 ml/100ml/min). The binding of water molecules to the endymal layer may cause higher ∆Z values since the water-binding process is also a buildup curve as a function of PLD by pulsed MISL. 5-6 The water-binding significantly impacted the pulsed MISL due to the much lower CSF water exchange signal than the continuous MISL. The results indicated that young mice (2-3 months) had significantly higher CSF water exchange than their adult counterparts (9-10 months). The AQP4-/-mice did not show significant CSF water exchange reduction compared to their age-matched wild-type counterparts. Differences between regional signal reduction show that water exchange is not uniform across ventricles. This non-invasive MRI method provided a technically achievable tool to examine the potential association between CSF water exchange and functional decline in many neurodegeneration diseases.Conclusion:
The results suggested that the novel MISL method has a far-reaching impact on studying, diagnosing, and treating a range of brain diseases, given their association with CSF water exchange. The current method only included the mouse brain, but it could be readily implemented on human scanners from low fields to high fields since the MT line shape covers an extensive range of frequencies.Acknowledgements
Grant support from NIH: P41EB031771, R01HL149742, R21NS118079, and R21AG065794. We thank Drs. Ole Petter Ottersen, Michael Levy, Harry Quigley for providing the AQP4-/- mice, and Ms. Lizzie Kimball in helping us breed the AQP4-/- mice.References
1. Huhmer AF, Biringer RG, Amato H, Fonteh AN, Harrington MG. Protein analysis in human cerebrospinal fluid: Physiological aspects, current progress and future challenges. Dis Markers 2006;22(1-2):3-26.
2. Matsumae M, Sato O, Hirayama A, Hayashi N, Takizawa K, Atsumi H, Sorimachi T. Research into the Physiology of Cerebrospinal Fluid Reaches a New Horizon: Intimate Exchange between Cerebrospinal Fluid and Interstitial Fluid May Contribute to Maintenance of Homeostasis in the Central Nervous System. Neurol Med Chir (Tokyo) 2016;56(7):416-441.
3. Oreskovic D, Klarica M. The formation of cerebrospinal fluid: nearly a hundred years of interpretations and misinterpretations. Brain Res Rev 2010;64(2):241-262.
4. Milhorat TH. Structure and function of the choroid plexus and other sites of cerebrospinal fluid formation. Int Rev Cytol 1976;47:225-288.
5. Chen L, Xu X, Zeng H, Chan K, Yadav NN, Cai S, Schunke KJ, Faraday N, van Zijl PCM, Xu J. Separating Fast and Slow Exchange Transfer and Magnetization Transfer Using Off-resonance Variable Delay Multiple Pulse (VDMP) MRI. Magn Reson Med 2018;80(4):1568-1576.
6. Gochberg DF, Gore JC. Quantitative imaging of magnetization transfer using an inversion recovery sequence. Magn Reson Med 2003;49(3):501-505.
Figures