0324
Contrast Agent Transport in Mouse Glymphatic System Observed by Dynamic Contrast-Enhanced MRI1Department of Biomedical Engineering, Case Western Reserve University, Cleveland, OH, United States, 2Cardiovascular Research Institute, Case Western Reserve University, Cleveland, OH, United States, 3Department of Medicine, Case Western Reserve University, Cleveland, OH, United States, 4Department of Radiology, Case Western Reserve University, Cleveland, OH, United States, 5Case Comprehensive Cancer Center, Case Western Reserve University, Cleveland, OH, United States, 6Department of Pediatrics, Case Western Reserve University, Cleveland, OH, United States, 7Imaging Research Core, Case Western Reserve University, Cleveland, OH, United States, 8Cancer Imaging Program, Case Western Reserve University, Cleveland, OH, United States, 9Department of Physiology and Biophysics, Case Western Reserve University, Cleveland, OH, United States
Synopsis
This study compared the transport of three MRI contrast agents with different molecular sizes (Gd-DTPA, GadoSpin, and H217O) in the mouse glymphatic system with dynamic contrast-enhanced MRI. Dynamic signal changes in the whole-brain and selected regions of interest (ROI) were analyzed. The results showed drastically different kinetics of the three tracers, indicating differences in glymphatic transport routes and rates. The current work lays the foundation for future studies employing genetically manipulated mouse models for mechanistic understanding of the regulation of glymphatic function in normal and diseased conditions.
Introduction
The glymphatic system is a paravascular cerebrospinal fluid (CSF) pathway that drives waste clearance in the brain. Glymphatic dysfunction has been associated with various neurodegenerative diseases,1 highlighting the importance of evaluating the glymphatic function in vivo. Dynamic contrast-enhanced MRI (DCE-MRI) provides the opportunity to assess whole-brain glymphatic dynamics in vivo by directly tracking the transport of CSF tracers.2 A previous study in rats showed significant differences in the influx and transport of two Gd-based contrast agents with different molecular weights (MW), Gd-DTPA (MW=661.8 Da) and GadoSpin (MW=200 kDa).3 A recent study using 17O-enriched water (H217O, MW=19 Da) reported strikingly increased transport of H217O over Gd-DTPA in the rat brain.4 These studies suggest that delineation of the glymphatic dynamics is dependent on the molecular size of the CSF tracer.In the current study, we compared the transport kinetics of intracisternally administered Gd-DTPA, GadoSpin, and H217O in the mouse brain. Our results showed drastically different kinetics of the three tracers in both the brain parenchyma and lateral ventricle, suggesting size-dependent pathways and kinetics of molecular transport in the glymphatic system.
Methods
Experimental Setup: All MRI data were acquired on a Bruker 9.4T scanner. Adult C57BL/6 mice were randomly assigned to three groups with intracisternal infusion of 1) 12.5 mM Gd-DTPA (n=2); 2) 6.25 mM GadoSpin (n=2); and 3) 40% H217O (n=2). Mice were anesthetized with isoflurane. A polyethylene catheter was inserted into the cisterna magna and secured with cyanoacrylate glue.5 The animal was then transferred to the scanner. Following the baseline scans, 10 μL of contrast agent was infused at 1 μL/min. The transport of the contrast agents in the brain was assessed using either T1-weighted (Gd-DTPA and GadoSpin) or T2-weighted (H217O) MRI. To validate the intracisternal injection method, two additional mice were injected with either 5% Evans blue or a cocktail of FITC-dextran (MW=2000 kDa) and CF594 hydrazide (MW=759 Da) and imaged with bright-field microscopy and fluorescent cryoimaging, respectively.Gd-DTPA and GadoSpin Imaging: Gd-DTPA and GadoSpin were tracked using a T1-weighted 3D FLASH sequence with the following parameters: TR/TE, 50/2.5 ms; flip angle, 15°; FOV: 20×16×14 mm3; matrix, 200x80x70; NAV, 1, leading to an isotropic resolution of 200 μm and a temporal resolution of <5 min. 26 images were acquired continuously for ~130 min.
H217O imaging: H217O transport was imaged with a T2-weighted multislice RARE sequence. 28 slices were acquired with TR, 2500 ms; FOV, 20x16 mm2; matrix, 200x80; slice thickness, 0.5 mm. 8 echoes were acquired in each TR with an effective TE of 31 ms, leading to 25-s acquisition time. A total of 312 datasets were acquired continuously for ~130 min.
Data Analysis: All data analyses were performed using in-house developed MATLAB code. Baseline-normalized signal changes over time and the percentage signal changes from the baseline were evaluated in selected ROIs including the olfactory bulbs (OB), the lateral ventricle (LV), and the perfusion territory of the middle cerebral artery (MCA).
Results
Intracisternal administration of CSF tracers was confirmed by microscopy and cryoimaging (Figure 1). Evan blue and FITC-dextran were confined to the CSF space, while CF594 was transported into the parenchyma. Figure 2 shows representative images from mice injected with Gd-DTPA, GadoSpin, and H217O, respectively. Shown in Figure 3 are the time maximum intensity projection (tMIP) for Gd-DTPA and GadoSpin, and the time maximum intensity change projection (tMICP) for H217O. Gd-DTPA was first observed in the CSF-filled aqueduct, and then progressed along the ventral side of the brain in the subarachnoid space. Transport of Gd-DTPA into the parenchyma can be appreciated after 20 min. In contrast, GadoSpin was confined to the CSF spaces, while H217O showed more extensive penetration into the parenchyma.Figure 4 shows the time courses of signal changes in selected ROIs. Gd-DTPA and GadoSpin induced a signal increase in T1-weighted images, while H217O caused a decrease in T2-weighted images (Figure 4A). The time courses of percentage signal change from the baseline reflect the kinetics of contrast agent transport (Figure 4B). GadoSpin transport to the parenchyma (OB and MCA territory) was minimal, while the uptake of Gd-DTPA and H217O was delayed in the distal parenchyma (OB). Compared to Gd-DTPA, H217O showed a much faster uptake rate in both OB and MCA territory. Interestingly, the three tracers showed drastically different transport kinetics in LV. H217O transport to LV reached equilibrium rapidly, while Gd-DTPA showed continued accumulation over the entire course of imaging. Further, GadoSpin transport to LV was the fastest, accompanied by rapid washout. These observations suggest different transport pathways and kinetics in the glymphatic system that is size-dependent.
Discussion and Conclusion
Consistent with previous observations in rats3,4,6, GadoSpin transport in mice was confined to the CSF space, and H217O uptake in the parenchyma was faster than Gd-DTPA. In addition, remarkably different transport kinetics of the three contrast agents to LV were observed, suggesting the existence of size-dependent pathways for molecular transport in the glymphatic system. Our current work lays the foundation for future studies employing genetically manipulated mouse models for a mechanistic understanding of the regulation of glymphatic function in normal and diseased conditions.Acknowledgements
This work was supported by a grant from the U.S. National Institute of Health (R01 EB23704).
References
1. Iliff JJ, Wang M, Liao Y, et al. A paravascular pathway facilitates CSFflow through the brain parenchyma nad the clearance of interstitial solutes, including amyloid β. Sci Transl Med. 2012;4(147). doi:10.1126/scitranslmed.3003748
2. Taoka T, Naganawa S. Glymphatic imaging using MRI. J Magn Reson Imaging. 2020;51(1):11-24. doi:10.1002/jmri.26892
3. Iliff JJ, Lee H, Yu M, et al. Brain-wide pathway for waste clearance captured by contrast-enhanced MRI. J Clin Invest. 2013;123(3):1299-1309. doi:10.1172/JCI67677
4. Alshuhri MS, Gallagher L, Work LM, Holmes WM. Direct imaging of glymphatic transport using H217O MRI. JCI Insight. 2021;6(10):2-10. doi:10.1172/jci.insight.141159
5. Xavier ALR, Hauglund NL, Von Holstein-Rathlou S, et al. Cannula implantation into the cisterna magna of rodents. J Vis Exp. 2018;2018(135):1-6. doi:10.3791/57378
6. Lee H, Mortensen K, Sanggaard S, et al. Quantitative Gd-DOTA uptake from cerebrospinal fluid into rat brain using 3D VFA-SPGR at 9.4T. Magn Reson Med. 2018;79(3):1568-1578. doi:10.1002/mrm.26779
Figures
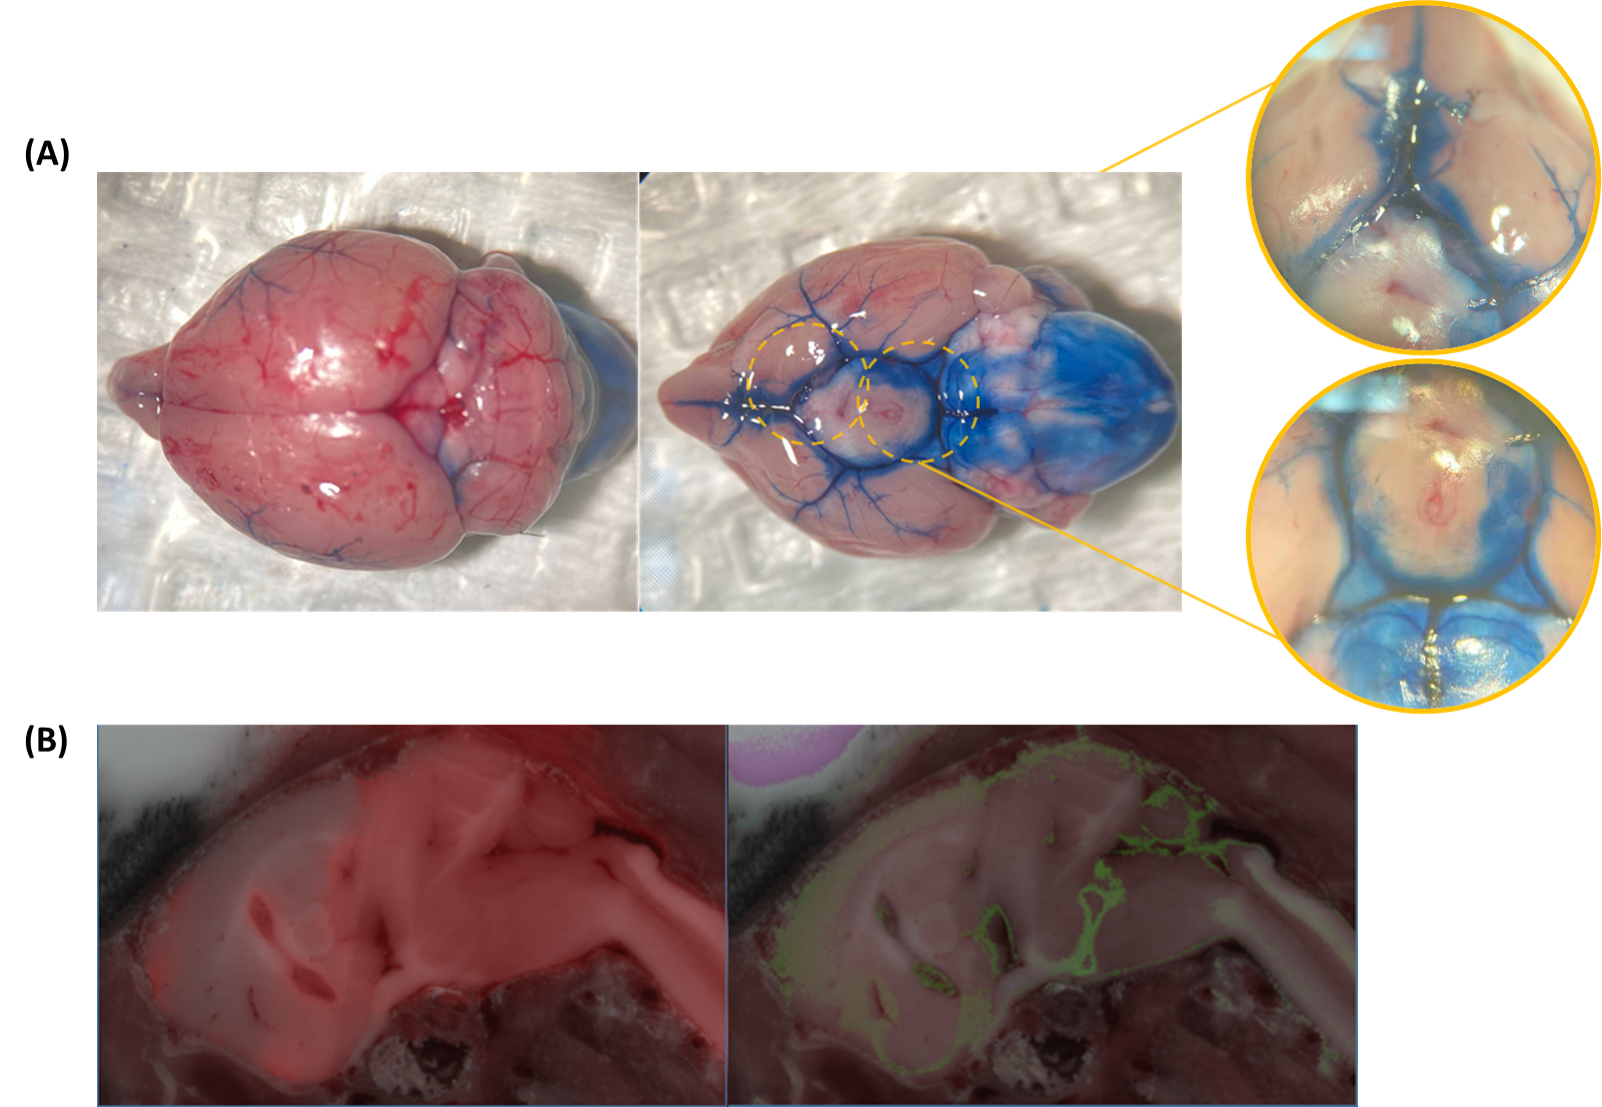
Figure 1. Validation of intracisternal tracer administration. (A) Bright-field microscopy of Evans blue staining. Right: dorsal view; Left: ventral view. (B) Cryoimaging of co-injected CF594 hydrazide (red, left) and FITC-dextran (green, right).

Figure 2. DCE-MRI of Gd-DTPA, GadoSpin, and H217O transport in the glymphatic pathway. (A&B) Representative sagittal slices of Gd-DTPA (A) and GadoSpin (B) distribution. Color indicates GadoSpin-induced signal enhancement. (C) Signal changes from baseline induced by H217O dynamics on representative sagittal slices.
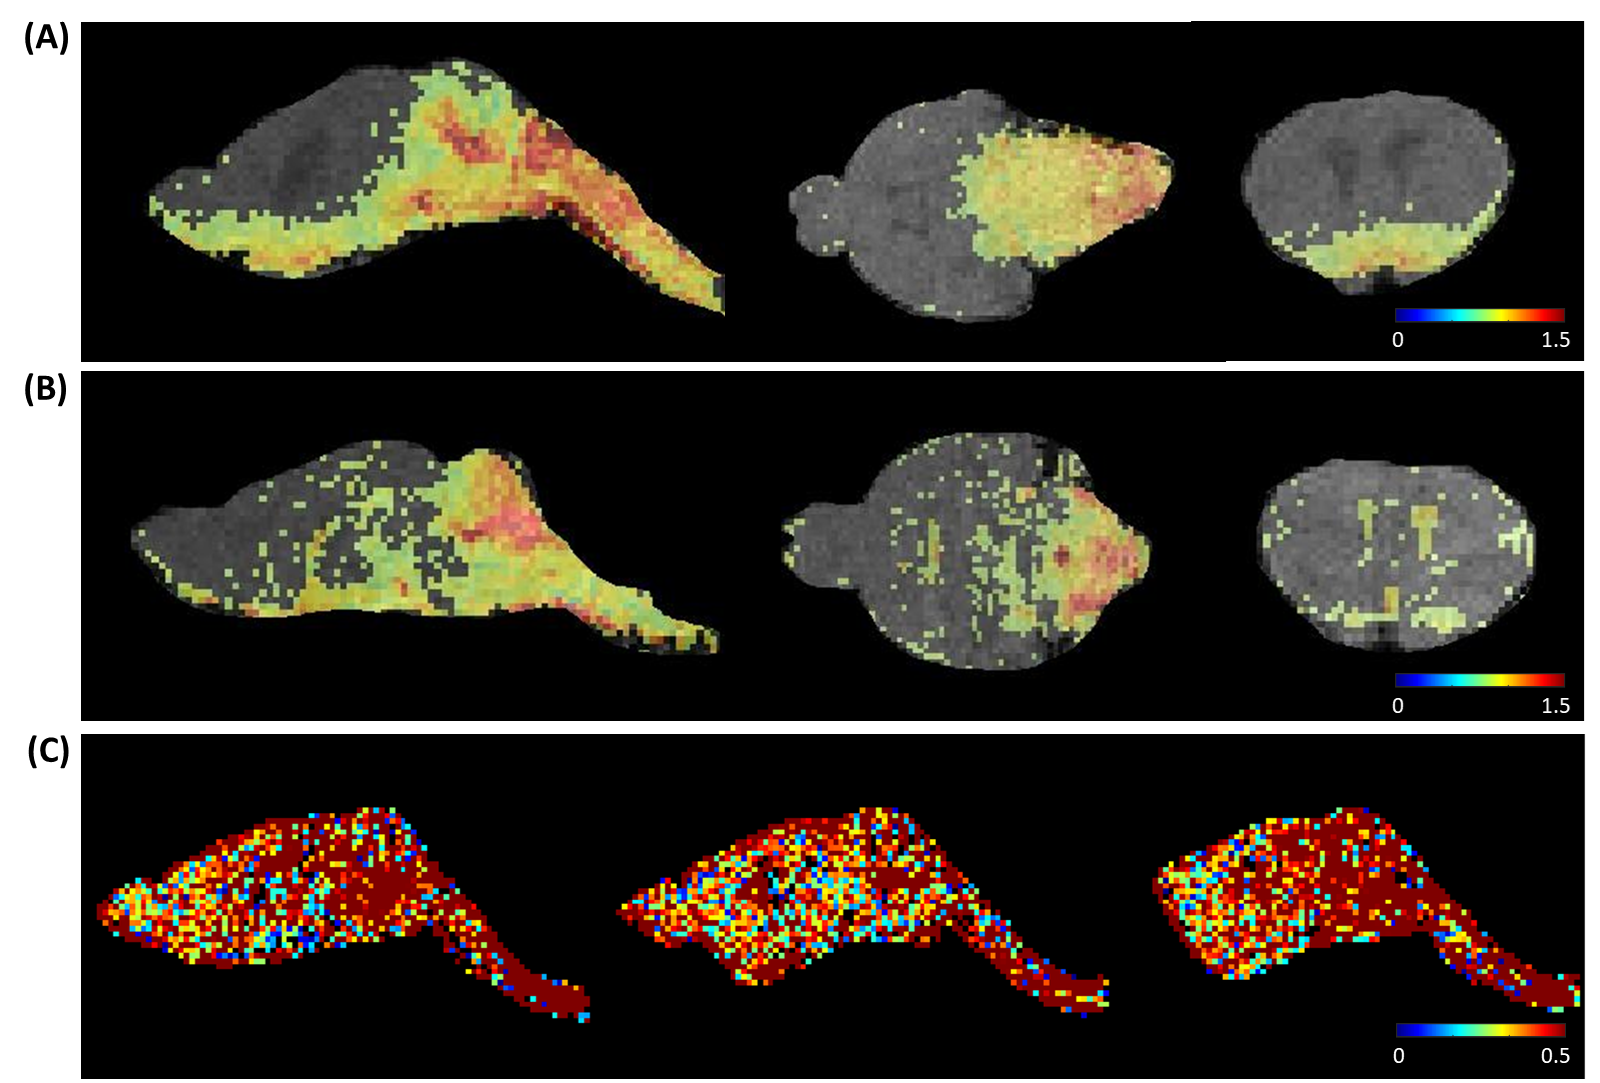
Figure 3. Time maximum intensity projections (tMIP) of Gd-DTPA, GadoSpin, and time maximum intensity change projection (tMICP) of H217O. (A) Representative sagittal, coronal, and axial slices of Gd-DTPA (A) and GadoSpin (B) tMIPs. (C) Representative sagittal slices of H217O tMICPs.
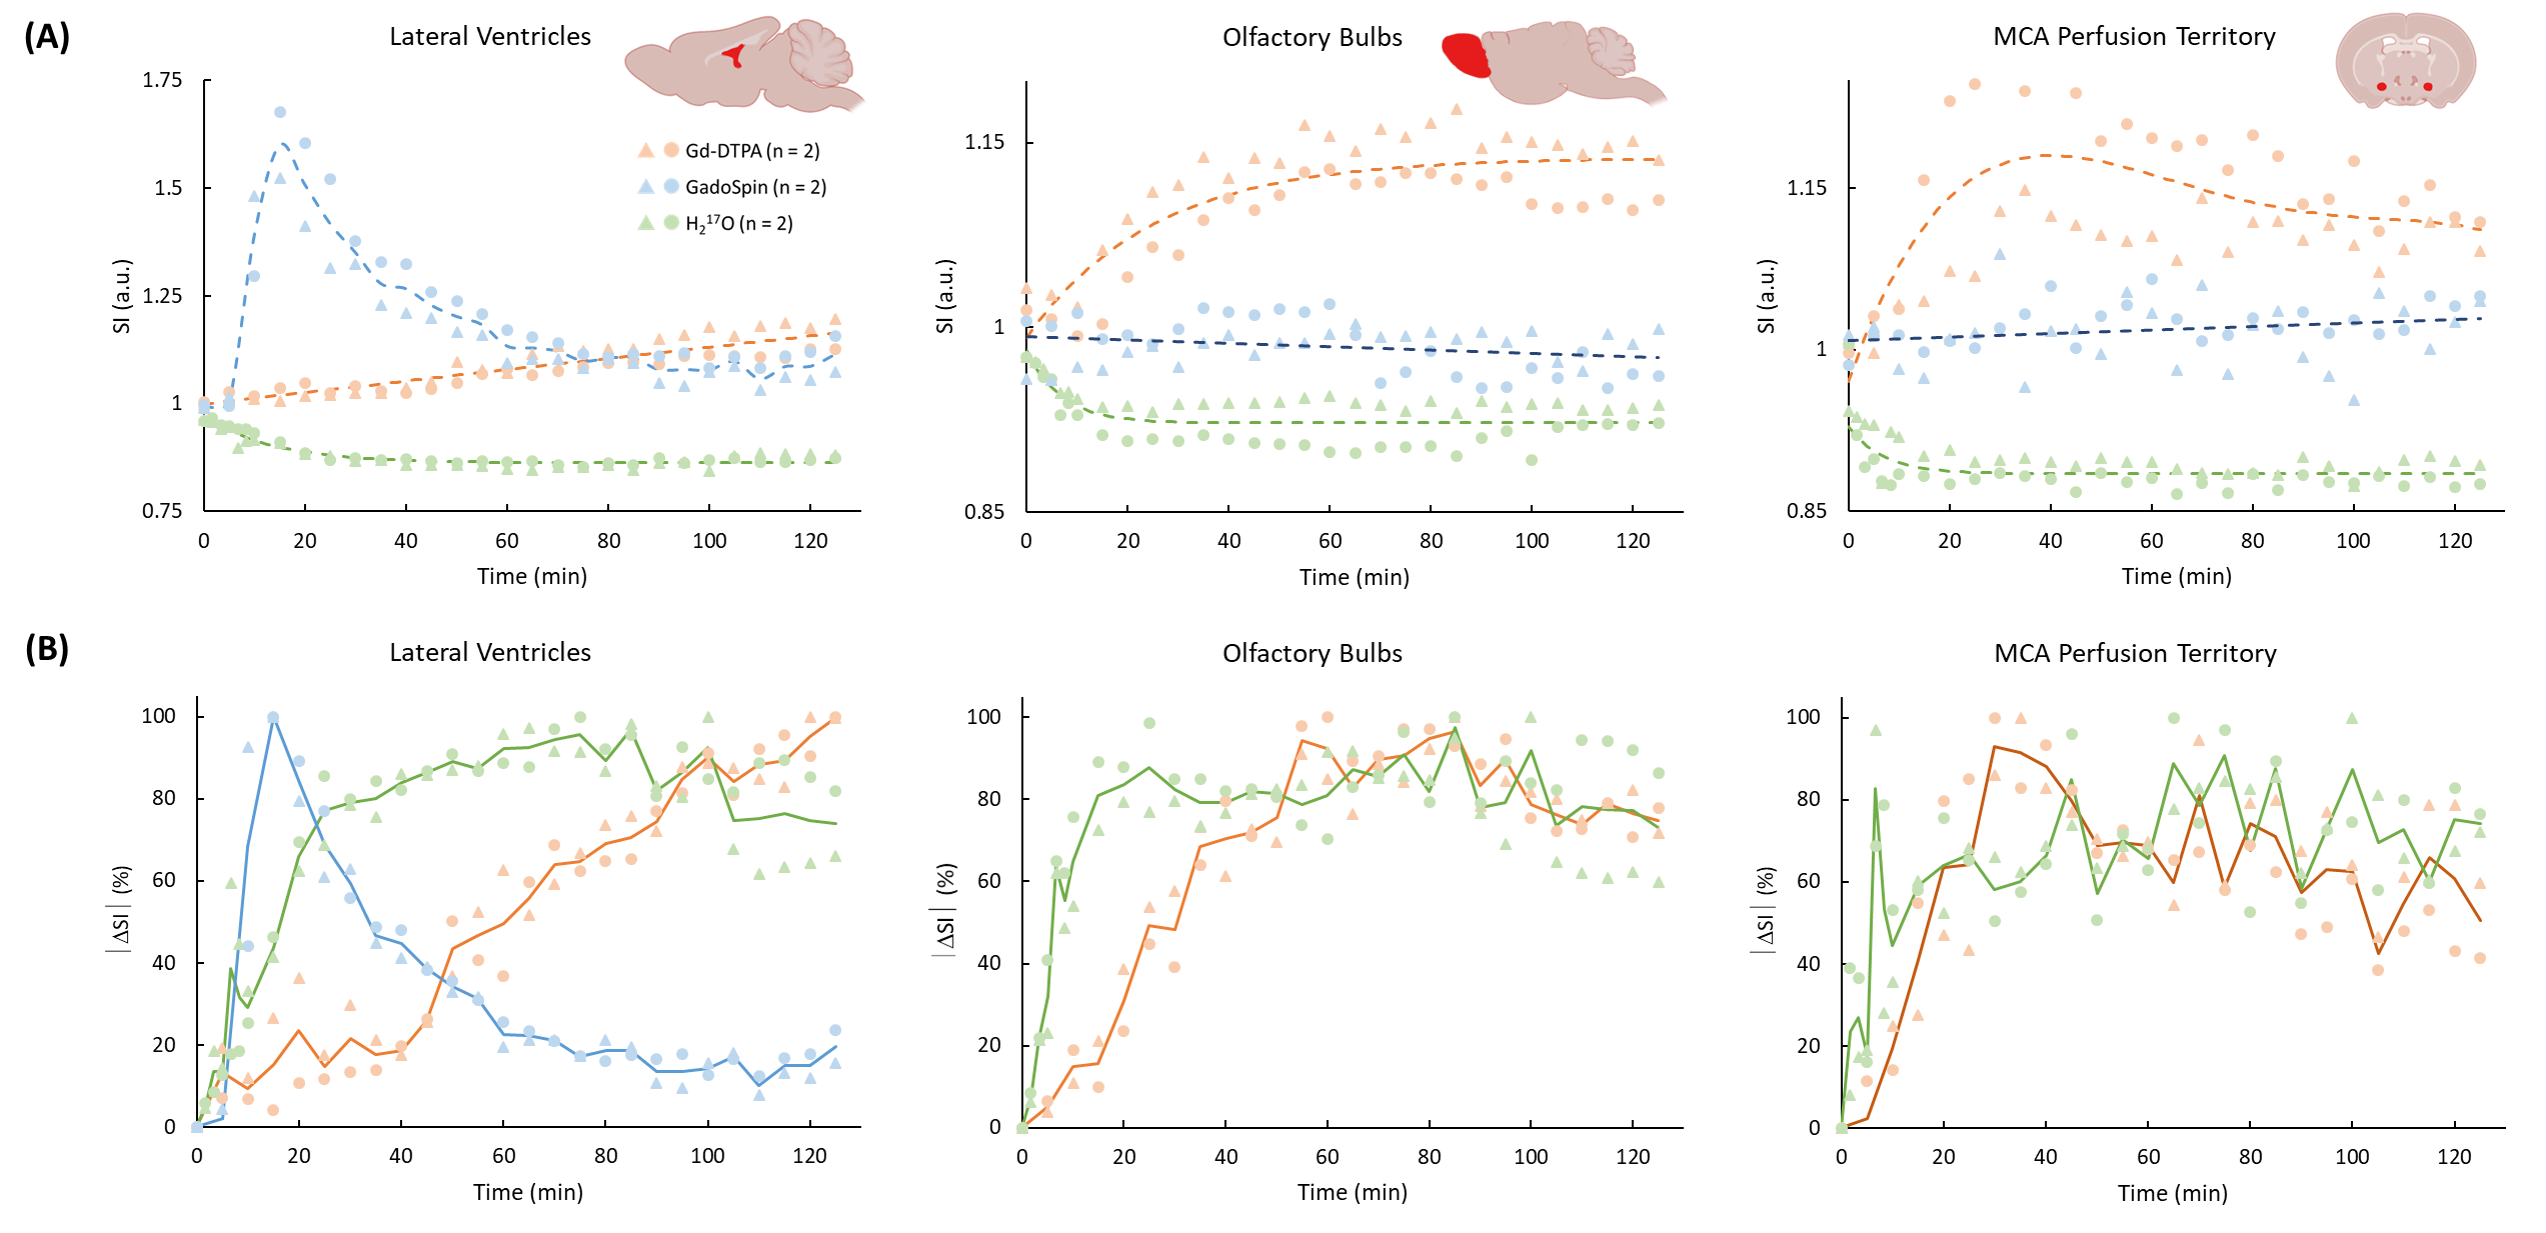
Figure 4. Gd-DTPA, GadoSpin, and H217O transport in the olfactory blubs (OB), lateral ventricles (LV), and perfusion territory of the middle cerebral artery (MCA). (A) Baseline-normalized signal intensity changes. Dashed lines indicate trendlines for each contrast agent. (B) Percentage changes in signal intensity from the baseline, normalized to the maximum intensity change. Solid lines are the averaged time courses for each contrast agent.