0323
High spatial resolution real-time imaging of respiratory effects on cerebrospinal fluid flow at 7T1Department of Clinical Sciences, Diagnostic Radiology, Skane University Hospital Lund, Lund University, Lund, Sweden, 2Philips Healthcare, Copenhagen, Denmark, 3Lund University Bioimaging Center, Lund University, Lund, Sweden, 4Department of Medical Radiation Physics, Lund University, Lund, Sweden, 5Department of Experimental Medical Science, Lund University, Lund, Sweden, 6Wallenberg Centre for Molecular Medicine, Lund University, Lund, Sweden
Synopsis
Methods to quantify CSF flow dynamics are important to study the physiology of intracranial pressure variations. Respiration influences the CSF flow, making real-time acquisitions necessary. This work investigates a high-resolution radial real-time flow sequence with golden angle acquisition and compressed sensing reconstruction at 7T for flow quantification of the CSF flow in the aqueduct. Phantom data shows that the proposed method accurately quantifies the slower aqueduct CSF flow oscillations caused by respiration, but underestimates faster cardiac oscillations. In vivo data shows good repeatability and an association between respiratory condition and net CSF flow.
Background
Recent research suggests that cerebrospinal fluid (CSF) flow is involved in clearance of waste products in the brain through the glymphatic system (1). However, few studies examine the glymphatic system in humans and therefore methods for accurate quantification of CSF dynamics are needed (2,3). Such methods may prove useful in diseases such as normal pressure hydrocephalus (4,5), congenital malformations (6), and cognitive diseases (7).The cerebral aqueduct, with a diameter of 1-3 mm, is a central pathway for CSF circulation. Recent studies have shown that respiration is an important regulator of aqueduct CSF flow (8–10). This opens a new avenue for investigation of CSF flow physiology and pathophysiology. Since respiration is in general non-periodic, real-time methods are required.
We have previously demonstrated a real-time flow method with high spatial resolution (11). However, our phantom data did not include separate respiratory and cardiac flow components. Furthermore, the method was not evaluated systematically in vivo.
Therefore, we aimed to 1) validate a real-time flow sequence in a phantom setup including respiratory and cardiac oscillations, and 2) test the method in healthy subjects to assess repeatability.
Methods
Acquisition and reconstructionThe MRI experiments were performed using a 7T MRI scanner (Achieva, Philips Healthcare, Best, the Netherlands) with a 2-channel transmit, 32-channel receive head coil (Nova Medical, Wilmington, MA, USA). A custom radial flow sequence was designed, with through-plane flow-encoding, RF and gradient spoiling and golden-angle spoke ordering. Parameters were as follows: TR/TE/flip = 10.5 ms / 5.1 ms / 7°, resolution = 0.6×0.6 mm, FOV = 240×240 mm, slice thickness = 5 mm, VENC = 15 cm/s, scan time 50 s. In the phantom data, spatial resolution was varied between 0.5 and 0.9 mm.
Images were reconstructed (Figure 1) with a parallel imaging and compressed sensing formulation with a temporal total variation constraint. Coil compression, radial gridding and compressed sensing (CS) reconstruction was performed using the Berkeley Advanced Reconstruction Toolbox (BART, v0.4.03) (12) and Matlab R2019a (The Mathworks, Natick, MA, USA).
For phantom data, the regularization parameter λ was set to three different values; 10-3, 10-6 and 10-9, as well as λ=0, corresponding to a gradient SENSE (CG-SENSE) reconstruction (13). Each timeframe used 8 radial spokes, resulting in a reconstructed temporal resolution of 168 ms.
Phantom validation
Accuracy was tested in a phantom setup, as illustrated in Figure 2. A computer-controlled actuator was used to create oscillating flow in plastic tubes, with diameters 2.5 and 4.0 mm. The flow was programmed with two sinusoidal components; a respiratory component at 15 cycles per minute, and a cardiac component at 45, 60, 75, 90 or 105 cycles per minute (Figure 2C). A gated flow sequence gated to the respiratory cycle was used as reference.
Respiratory and cardiac frequency components were extracted from the real-time and reference flow data using a Fast Fourier Transform (Figure 2D). The respiratory ratio QR was computed as the ratio of the amplitudes of the respiratory component in the real-time flow and reference flow data, and comparably for the cardiac ratio QC.
In vivo data
Healthy volunteers were recruited (n=10, age 26±2 years) to test the method in vivo (Figure 3). The study was approved by the Local Ethical Review Board in Lund, Sweden. All volunteers provided written informed consent.
The volunteers were imaged in 4 different respiratory conditions: 1) free breathing at rest (“free”), 2) deep breathing (“deep”), 3) guided breathing with breath-holds: 2 seconds inspiration, 2 seconds breath hold, 2 seconds expiration, 2 seconds breath-hold, repeated for the duration of the scan (“guided-BH”), and 4) guided breathing without breath-holds: 2 seconds inspiration, 2 second expiration, repeated for the duration of the scan (“guided-noBH”).
Exercises 1-4 were repeated immediately to assess repeatability. Exercises 3 and 4 were guided by projection of instructions onto a screen. Images were analyzed by two observers independently.
Results
Phantom validationPhantom results are shown in Figure 4 (2.5 mm tube). In this paragraph, quantitative data is given for spatial resolution 0.6 mm and λ=10-6 unless otherwise noted.
CG-SENSE underestimated the respiratory (2.5 mm tube: QR = 0.57±0.07, 4.0 mm tube: QR = 0.71±0.18) and cardiac oscillations (2.5 mm tube: QC = 0.57±0.09, 4.0 mm tube: QC = 0.65±0.18). The CS reconstruction slightly underestimated the respiratory component (2.5 mm tube: QR = 0.96±0.02, 4.0 mm tube: QR = 0.99±0.02), and underestimated the cardiac component (2.5 mm tube: QC = 0.46±0.14, 4.0 mm tube: QC = 0.64±0.12).
In vivo results
Interobserver agreement was strong to very strong (ICC range: 0.77-0.98). Repeatability was strong to very strong for forward and backward flow (ICC range: 0.87-0.96), and weak to strong for net flow (ICC range: 0.46-0.86). Figure 5 shows results for the different respiratory conditions. Net flow was associated with respiratory condition (p=0.031), but there was no association with forward (p=ns) or backward flow alone (p=ns).
Conclusions
Phantom data shows that our real-time flow imaging method can accurately quantify slower aqueduct CSF flow oscillations caused by respiration, but underestimates faster cardiac oscillations. In vivo, we found good repeatability and an association between respiratory condition and net CSF flow.Acknowledgements
Image reconstructions were performed on resources provided by the Swedish National Infrastructure for Computing (SNIC) at the Lund University Center for Scientific and Technical Computing (LUNARC) under projects SNIC-2018/6-32 and LU-2018/2-40. Lund University Bioimaging Center (LBIC), Lund University is gratefully acknowledged for providing experimental resources.References
1. Iliff JJ, Wang M, Liao Y, et al. A paravascular pathway facilitates CSF flow through the brain parenchyma and the clearance of interstitial solutes, including amyloid β. Sci. Transl. Med. 2012;4 doi: 10.1126/scitranslmed.3003748.
2. Valnes LM, Mitusch SK, Ringstad G, Eide PK, Funke SW, Mardal KA. Apparent diffusion coefficient estimates based on 24 hours tracer movement support glymphatic transport in human cerebral cortex. Sci. Rep. 2020;10:1–12 doi: 10.1038/s41598-020-66042-5.
3. Kylkilahti TM, Berends E, Ramos M, et al. Achieving brain clearance and preventing neurodegenerative diseases-A glymphatic perspective. J. Cereb. Blood Flow Metab. 2021:271678X20982388 doi: 10.1177/0271678X20982388.
4. Scollato A, Tenenbaum R, Bahl G, Celerini M, Salani B, Di Lorenzo N. Changes in aqueductal CSF stroke volume and progression of symptoms in patients with unshunted idiopathic normal pressure hydrocephalus. Am. J. Neuroradiol. 2008;29:192–197 doi: 10.3174/ajnr.A0785.
5. Shanks J, Markenroth Bloch K, Laurell K, et al. Aqueductal CSF stroke volume is increased in patients with idiopathic normal pressure hydrocephalus and decreases after shunt surgery. Am. J. Neuroradiol. 2019;40:453–459 doi: 10.3174/ajnr.A5972.
6. Wang CS, Wang X, Fu CH, Wei LQ, Zhou DQ, Lin JK. Analysis of cerebrospinal fluid flow dynamics and morphology in Chiari I malformation with cine phase-contrast magnetic resonance imaging. Acta Neurochir. (Wien). 2014;156:707–713 doi: 10.1007/s00701-013-1958-8.
7. El Sankari S, Gondry-Jouet C, Fichten A, et al. Cerebrospinal fluid and blood flow in mild cognitive impairment and Alzheimer’s disease: A differential diagnosis from idiopathic normal pressure hydrocephalus. Fluids Barriers CNS 2011;8 (1) (no doi: http://dx.doi.org/10.1186/2045-8118-8-12.
8. Chen L, Beckett A, Verma A, Feinberg DA. Dynamics of respiratory and cardiac CSF motion revealed with real-time simultaneous multi-slice EPI velocity phase contrast imaging. Neuroimage 2015;122:281–287 doi: 10.1016/j.neuroimage.2015.07.073.
9. Dreha-Kulaczewski S, Joseph A a, Merboldt K-D, Ludwig H-C, Gärtner J, Frahm J. Inspiration is the major regulator of human CSF flow. J. Neurosci. 2015;35:2485–91 doi: 10.1523/JNEUROSCI.3246-14.2015.
10. Lloyd RA, Butler JE, Gandevia SC, et al. Respiratory cerebrospinal fluid flow is driven by the thoracic and lumbar spinal pressures. J. Physiol. 2020;598:5789–5805 doi: 10.1113/JP279458.
11. Töger J, Andersen M, Markenroth Bloch K. Accuracy of real-time quantitative flow imaging in small diameters using compressed sensing at 7T: a phantom study. In: ISMRM 2019.
12. BART Toolbox for Computational Magnetic Resonance Imaging. doi: 10.5281/zenodo.817472.
13. Pruessmann KP, Weiger M, Börnert P, Boesiger P. Advances in sensitivity encoding with arbitrary k-space trajectories. Magn. Reson. Med. 2001;46:638–51.
Figures
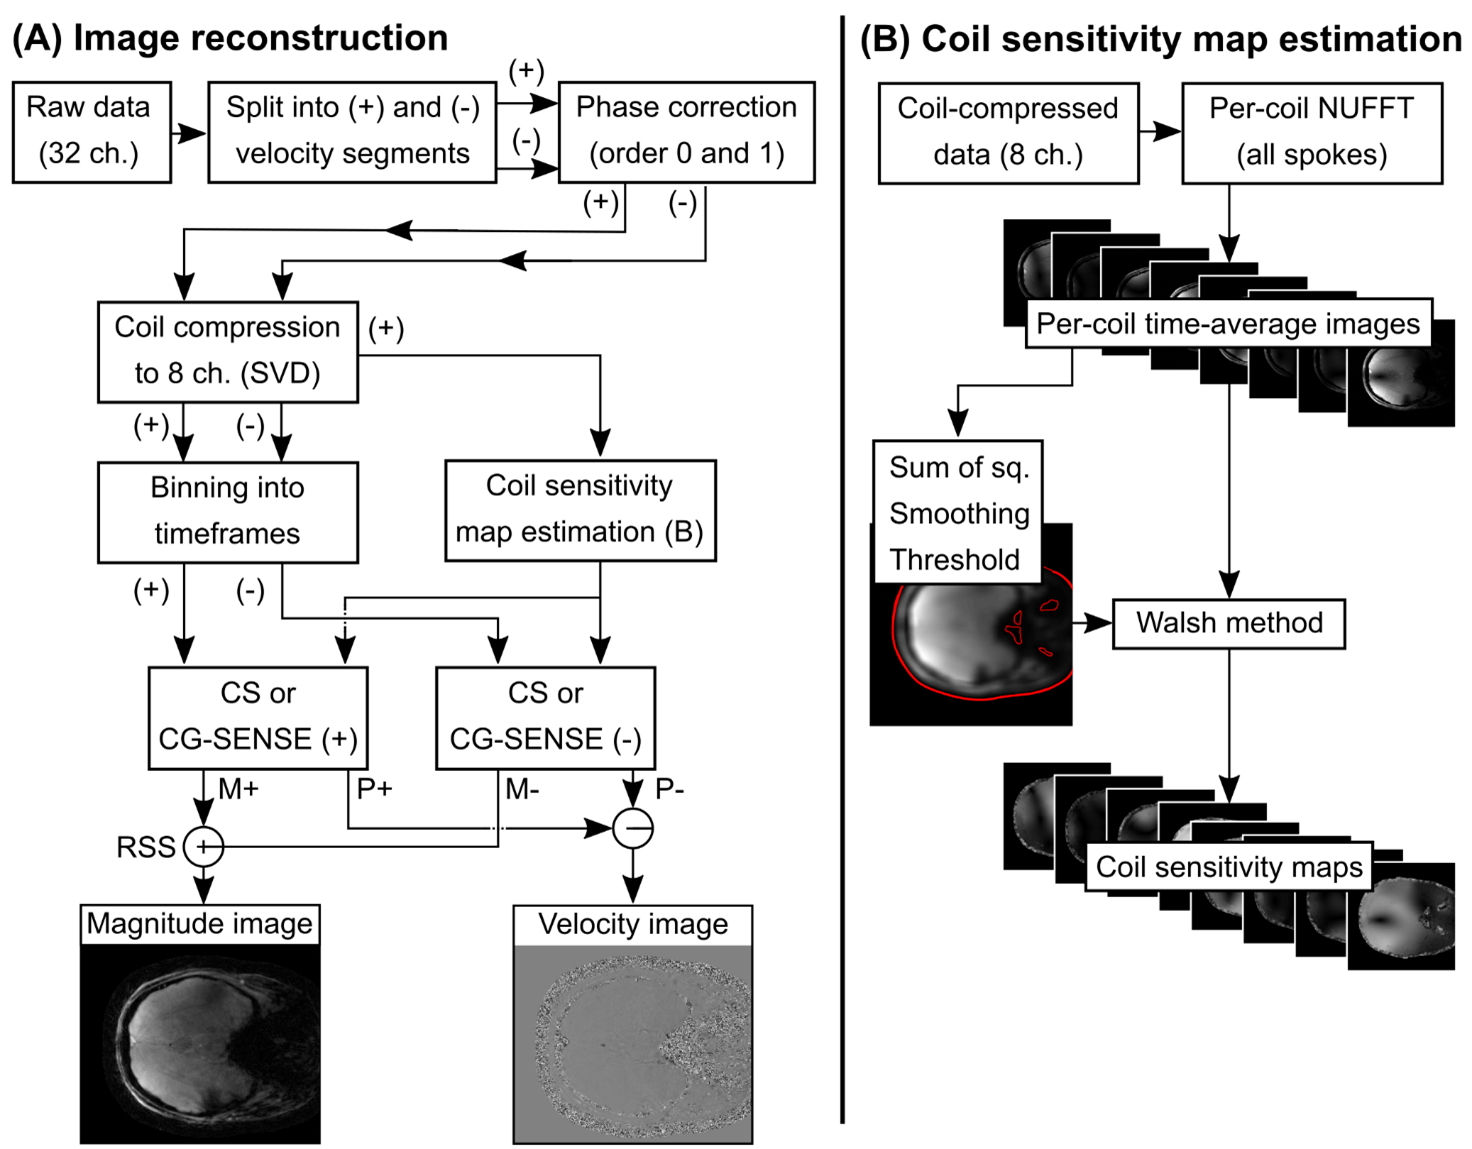
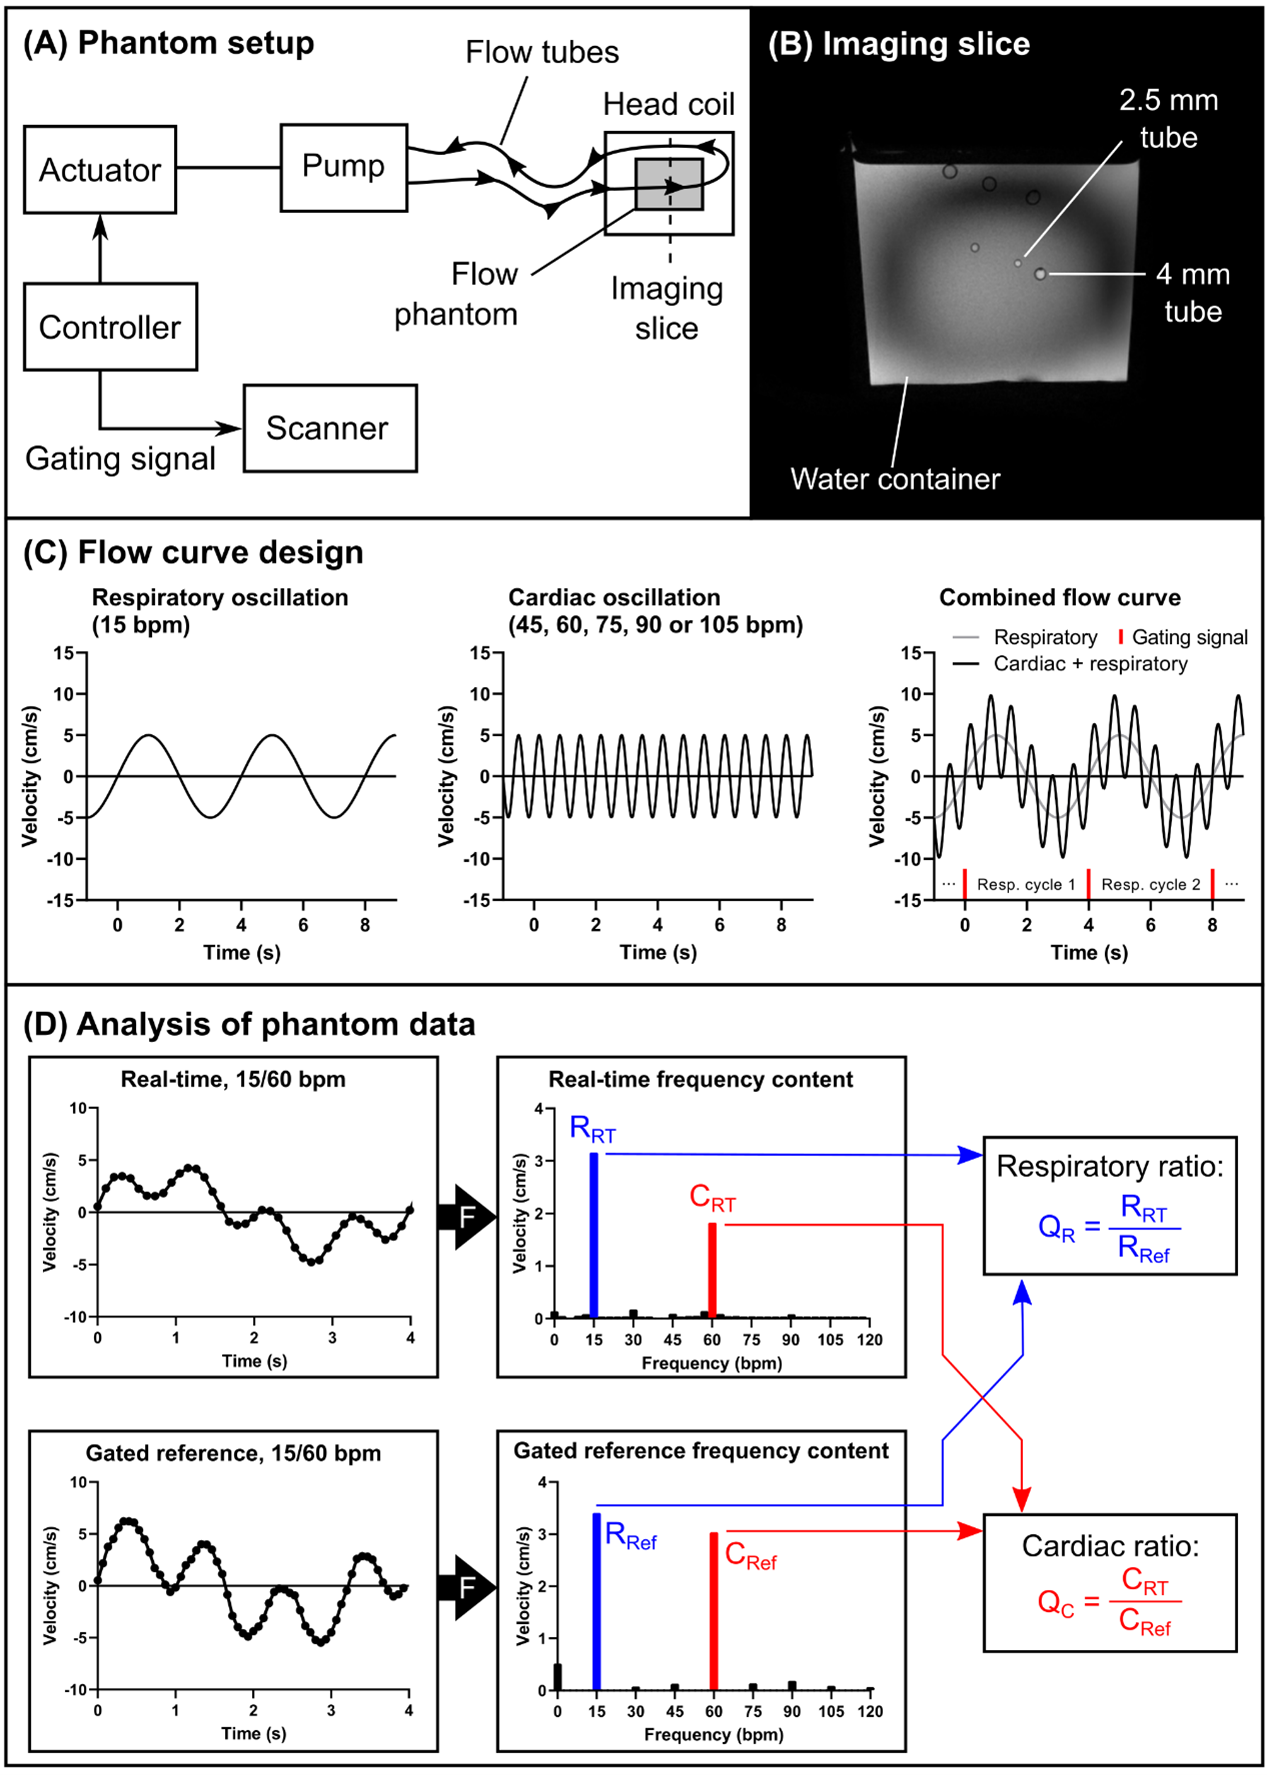
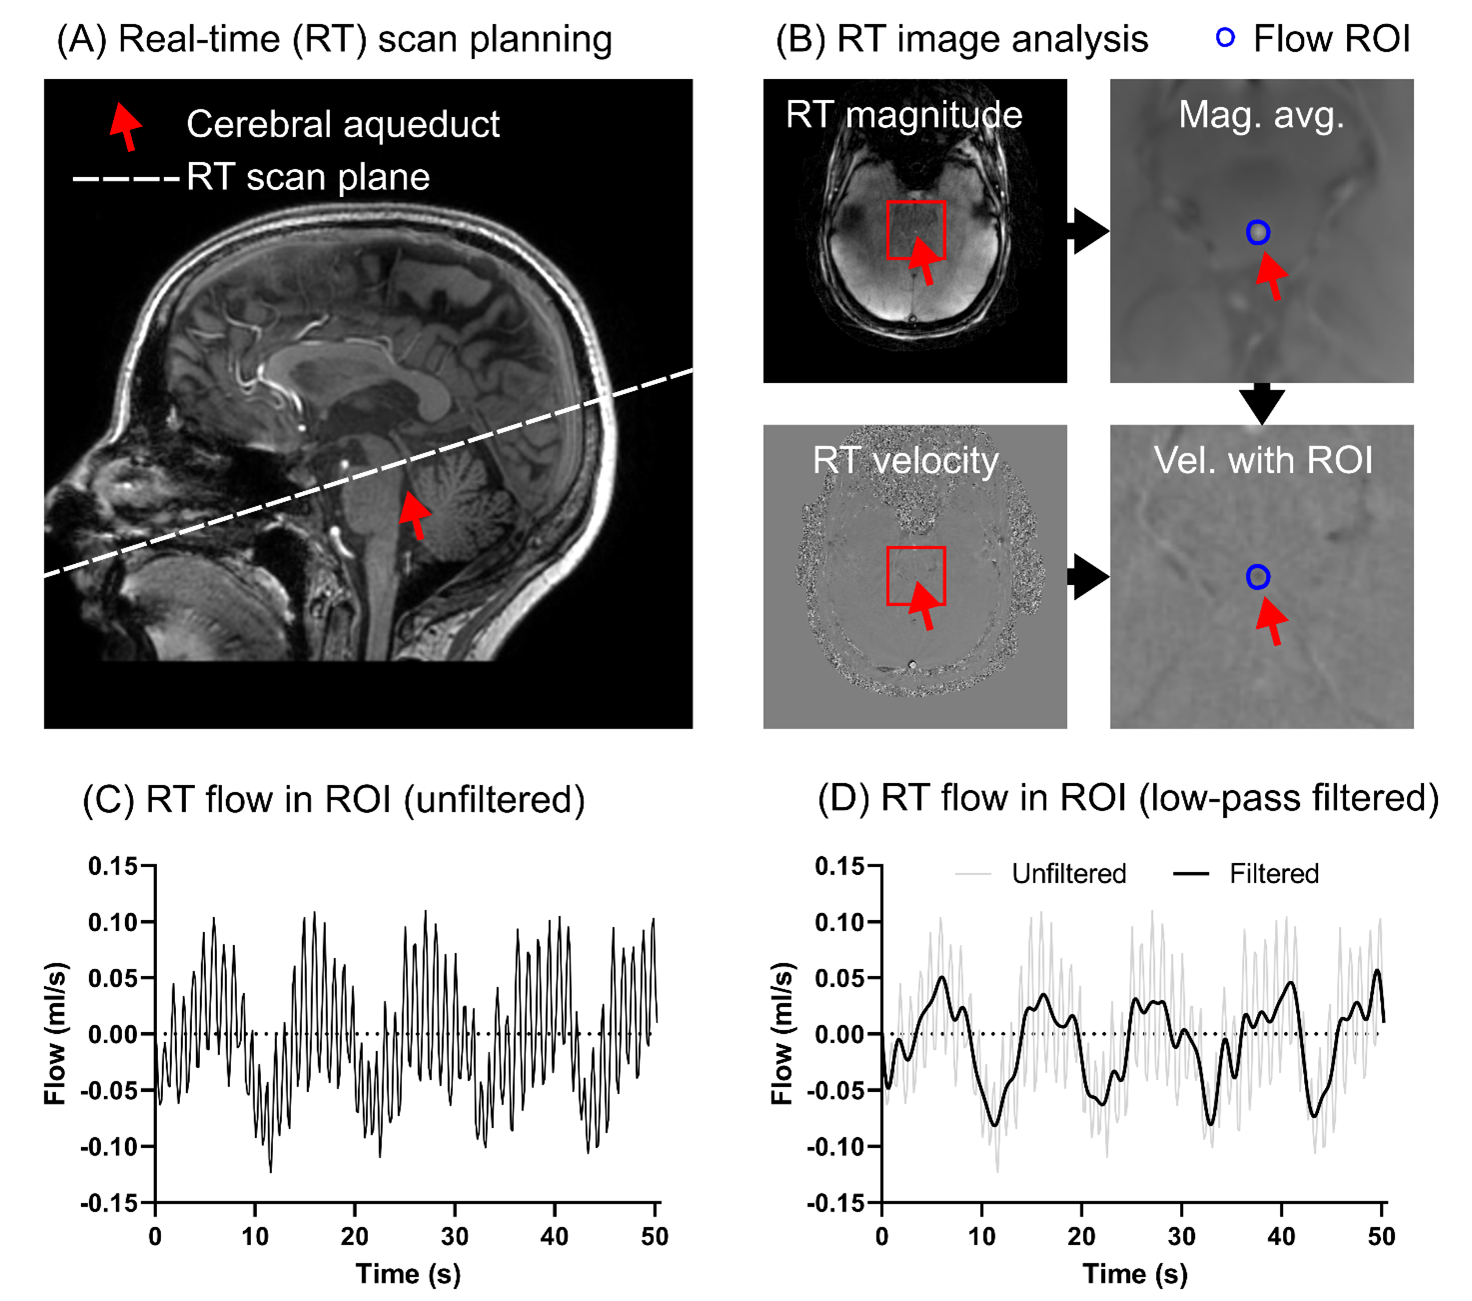
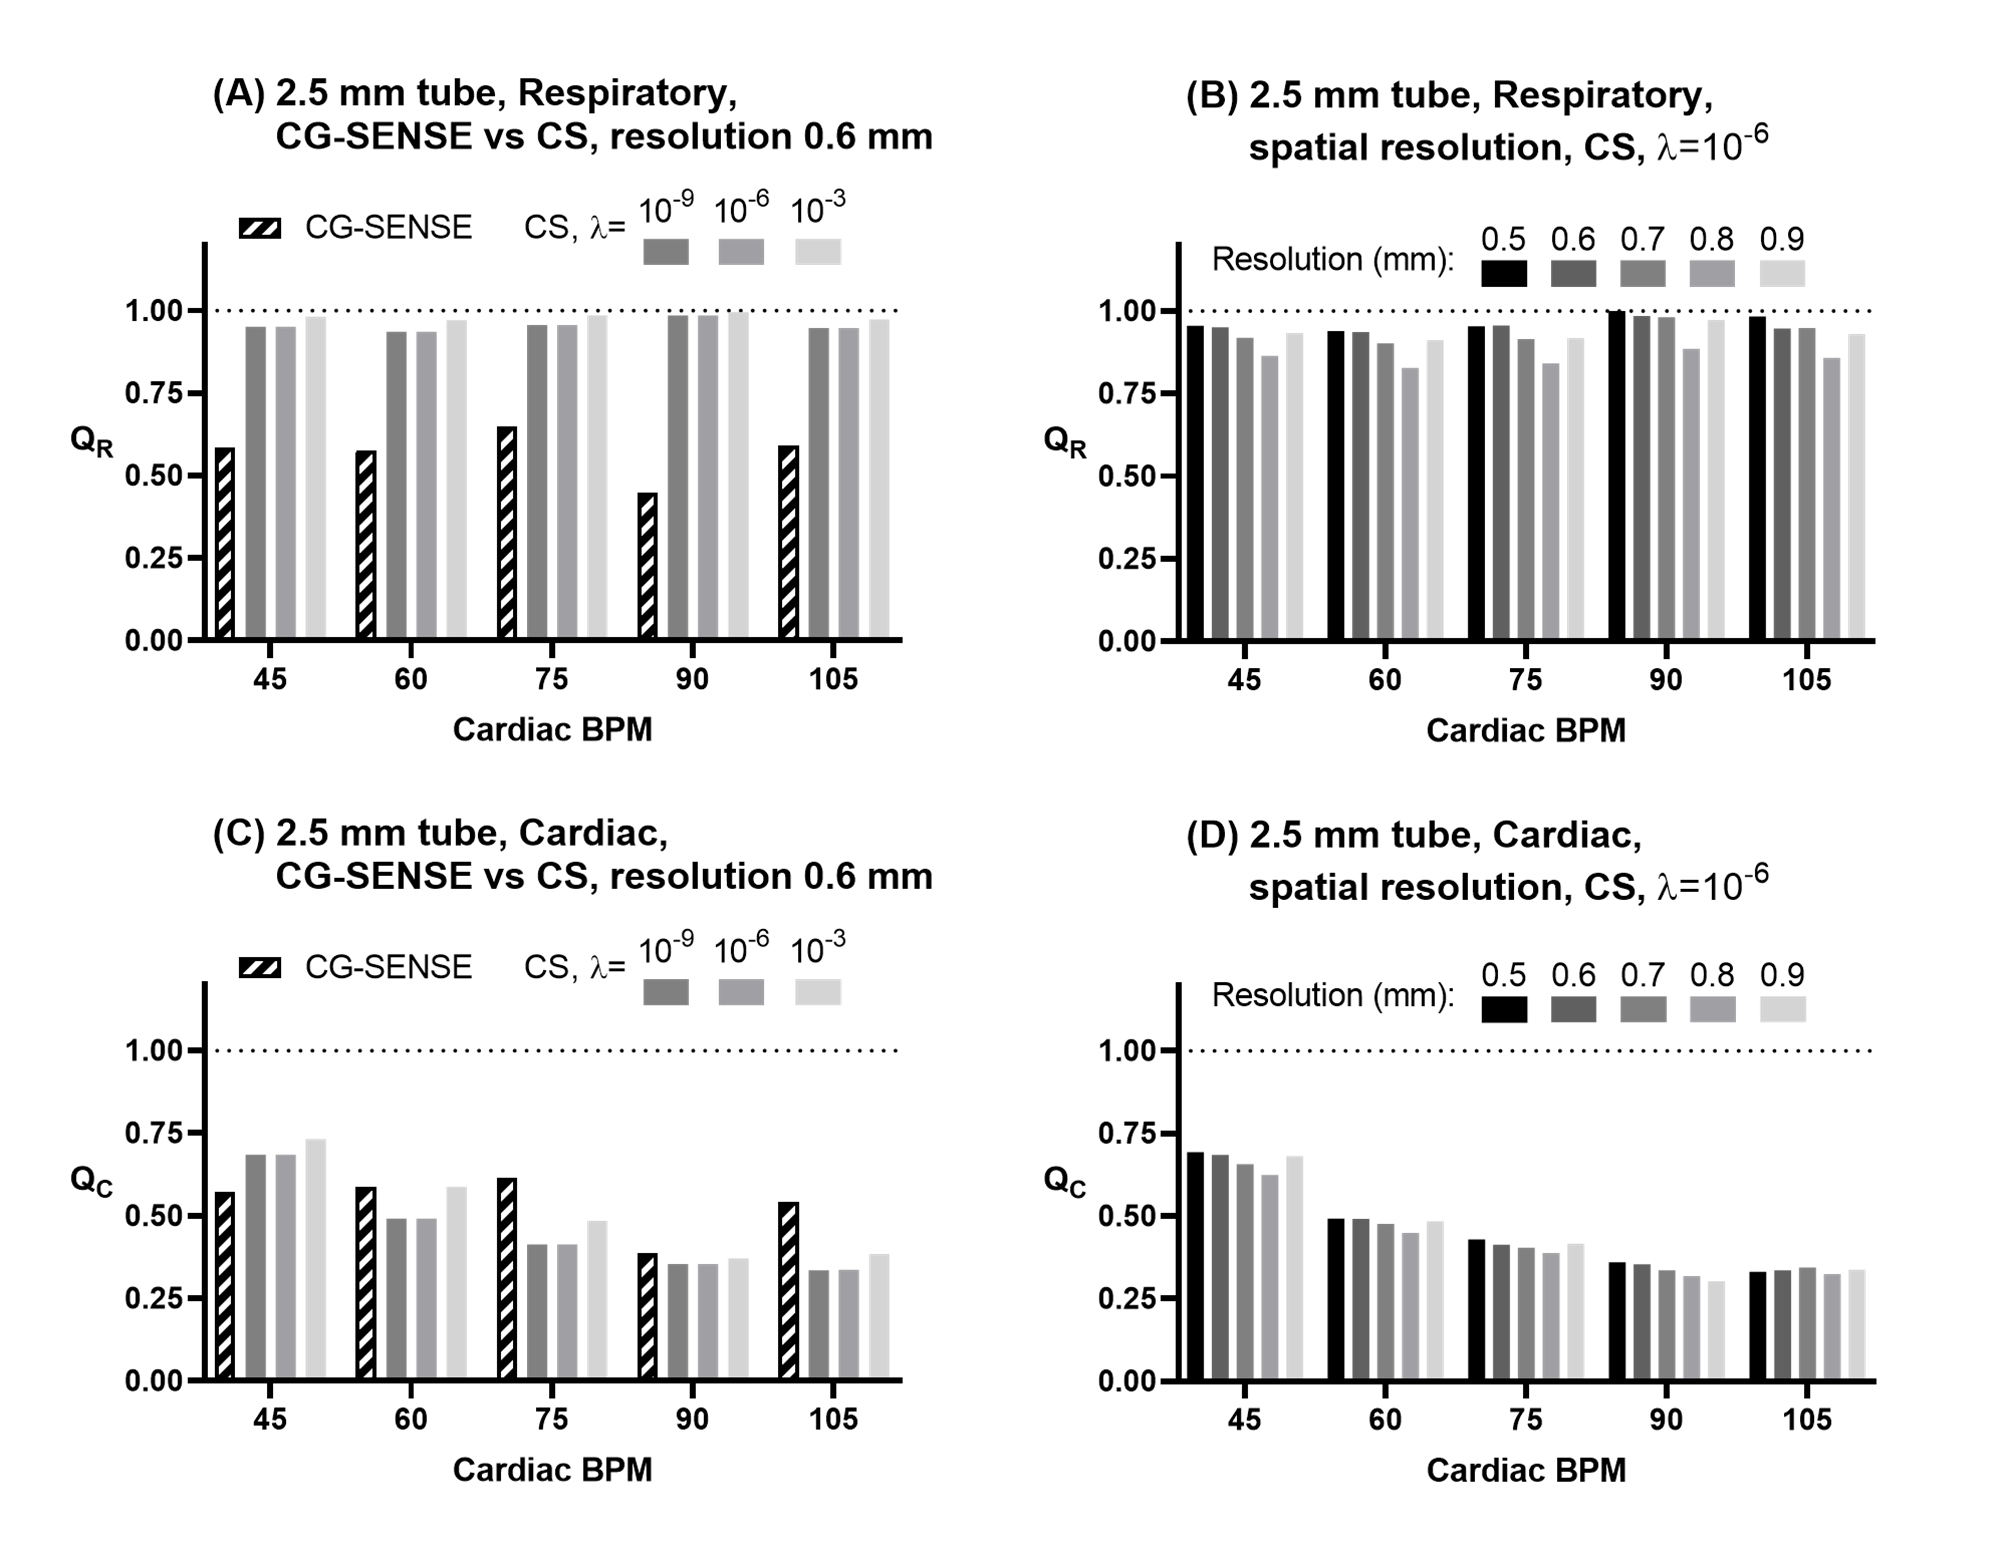
Figure 4: Quantitative results for respiratory and cardiac oscillations from the phantom experiment, 2.5 mm tube. Panel (A) shows a comparison of CG-SENSE and compressed sensing (CS) reconstructions for the respiratory component ratio QR. Panel (B) shows a sub-analysis of QR for different acquired spatial resolutions reconstructed using CS (λ=10-6). Panels (C) and (D) show similar data, but for the cardiac ratio QC.
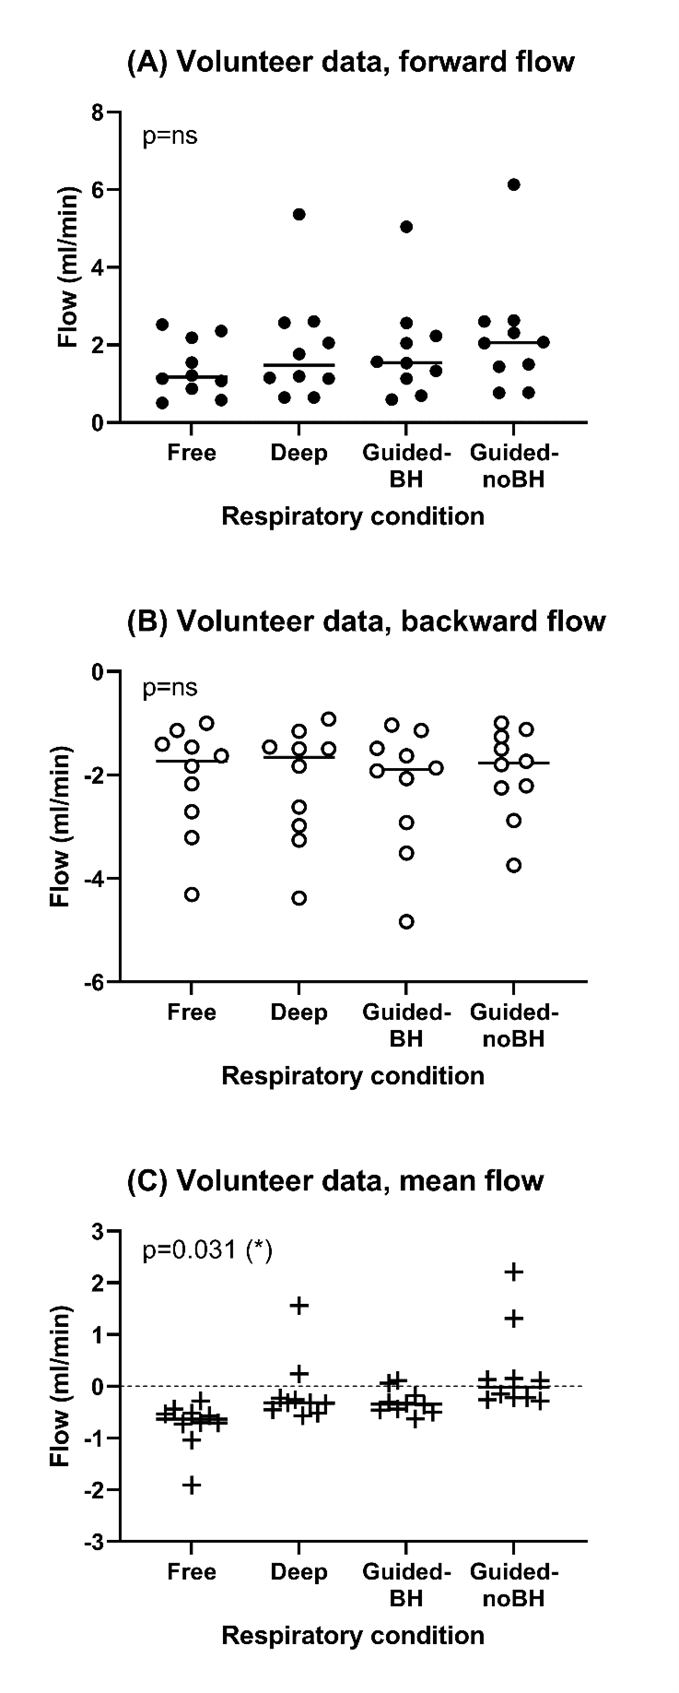
Figure 5: In vivo flow results. Panels: (A) forward flow, (B) backward flow, (C) net flow. Net flow was influenced by respiratory condition (ANOVA, p=0.031), but no effect was seen for forward or backward flow separately. Data is shown here without temporal filtering.