0322
Assessment of Pulsatile Cerebrospinal Fluid Dynamics of the Human Brain using CArdiac-cycle Resolved Diffusion-weighted Imaging (CARDI)1Indiana University, School of Medicine, Indianapolis, IN, United States, 2Weldon School of Biomedical Engineering Department, Purdue University, West Lafayette, IN, United States, 3School of Health Sciences, Purdue University, West Lafayette, IN, United States
Synopsis
We introduce an MRI technique named CARDI, for in-vivo assessment of pulsatile fluid dynamics in the surface paravascular spaces of the pial arteries. A pair of pulsed gradient spin echo was used to detect the slow flow of CSF while suppressing the fast flow of adjacent arterial blood. Waveform of CSF over a cardiac cycle is revealed. The shape of the CSF waveforms closely resembles the pressure waveforms of the artery wall, suggesting that CSF dynamics is tightly related to artery wall mechanics. The comparison of CSF waveforms in an aging group revealed a significant age-dependency of the CSF waveforms.
INTRODUCTION
Cerebrospinal fluid (CSF) in the surface paravascular spaces (sPVS) of the pial arteries is a vital pathway in brain waste clearance1, where arterial pulsations is deemed as the driving force for the fluid pumping2. However, there has not been a clinically practical method for measuring its dynamics in the human brain. To capture the fluid dynamics along a cardiac cycle, we proposed an imaging and analytical framework named CArdiac-cycle Resolved Diffusion Imaging (CARDI). We show that CARDI can detect CSF fluctuations along a cardiac cycle, revealing a waveform. We investigate the charateristics of the waveform and discuss our findings in the aging brain.METHODS
The rationale for detecting paravascular CSF with diffusion imaging: A key feature differentiating paravascular CSF from parenchyma is that CSF pulsates along the artery wall. Thus, parenchyma and cerebral veins would not significantly contribute to the temporal signal fluctuations. The fluid dynamics also differ from arterial blood in its flow velocity. The blood has a velocity of 50-500mm/s; Whereas the paravascular CSF has a velocity on the order of 20µm/s with non-negligible self-diffusion2. At the presence of diffusion gradients, the fast-moving blood spins will be nulled due to two effects: the time-of-flight effect and intravoxel dephasing. In comparison, the slow-moving CSF spins will be partially dephased, resulting in a signal attenuation that scales with its flow velocity and diffusion effect.CARDI acquisition: CARDI uses a single-shot echo planar imaging sequence with Stejskal-Tanner pulsed gradient spin echo for diffusion weighting. The sequence is repeated temporally over multiple cardiac cycles to randomly sample different phases of the heartbeat and uses a pulse oximeter to sync the acquired data with the heartbeat. By retrospectively aligning temporal image volumes to the cardiac cycle, CARDI produces a set of diffusion-weighted images (DWIs) over one cardiac cycle. The following parameters are used: Field-of-view=240mm×240mm, repetition time/echo time=1999ms/48.6ms with a spatial resolution of 1.8mm×1.8mm×4mm. DWIs were collected at three diffusion encoding directions using b-value=150s/mm2, with each diffusion direction being repeated 50 times. The total acquisition time was 5:40min.
Human participants: Eleven healthy participants aged 22-79 were scanned with CARDI sequence on a Siemens Prisma 3T scanner. To test the reproducibility of CARDI, we collected four CARDI datasets on one younger volunteer over a six-month span.
RESULTS
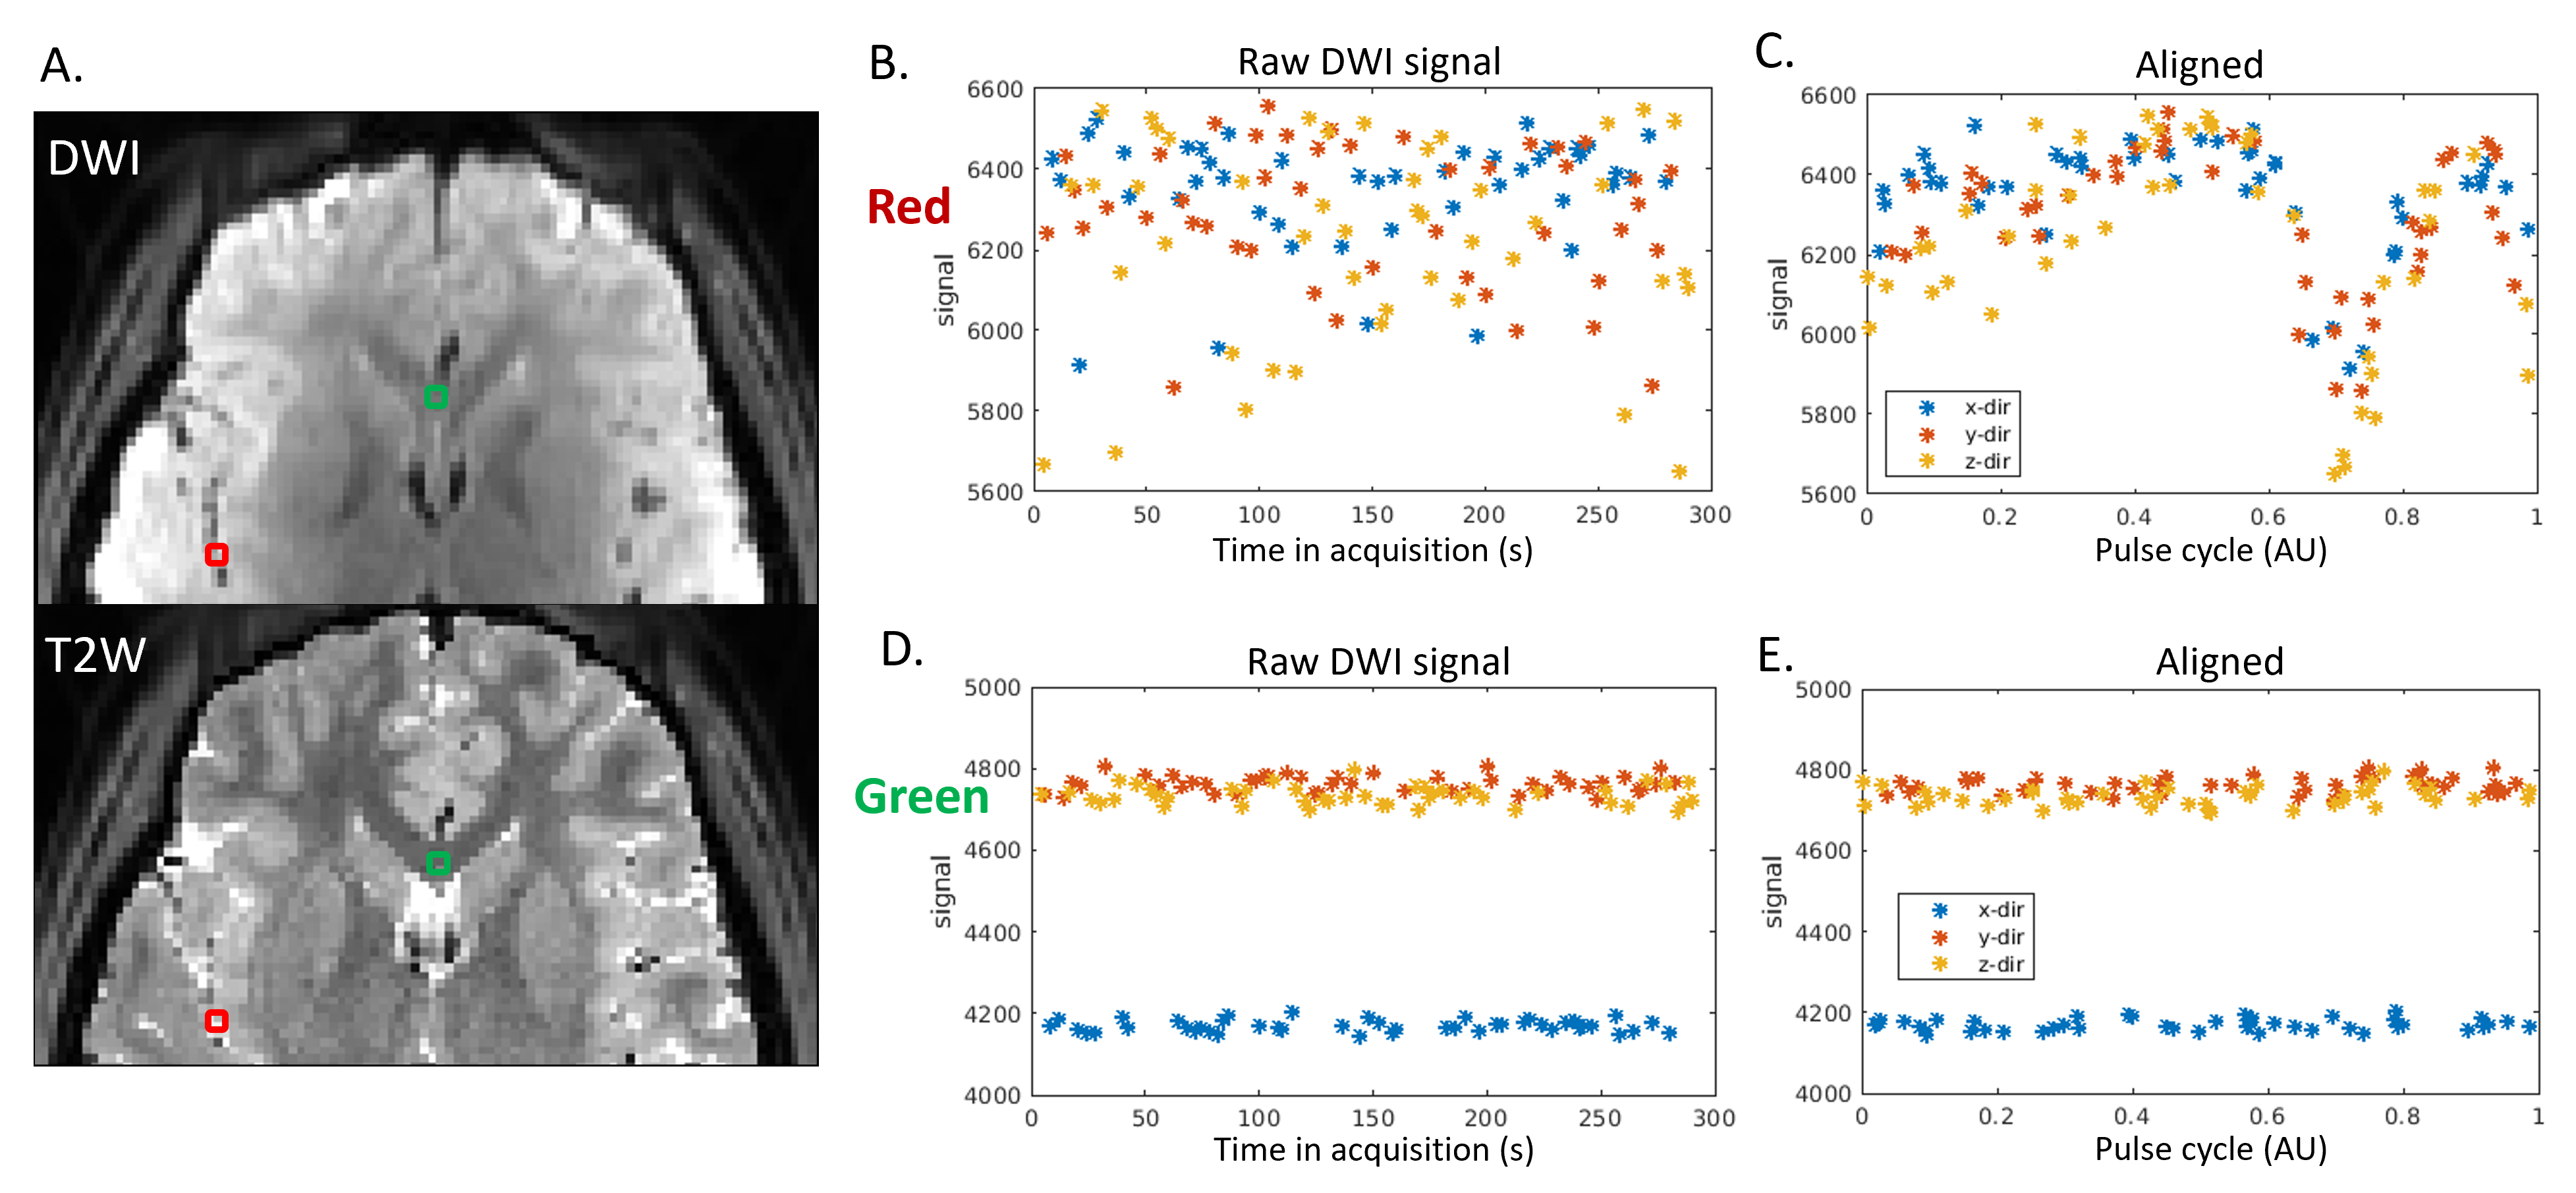
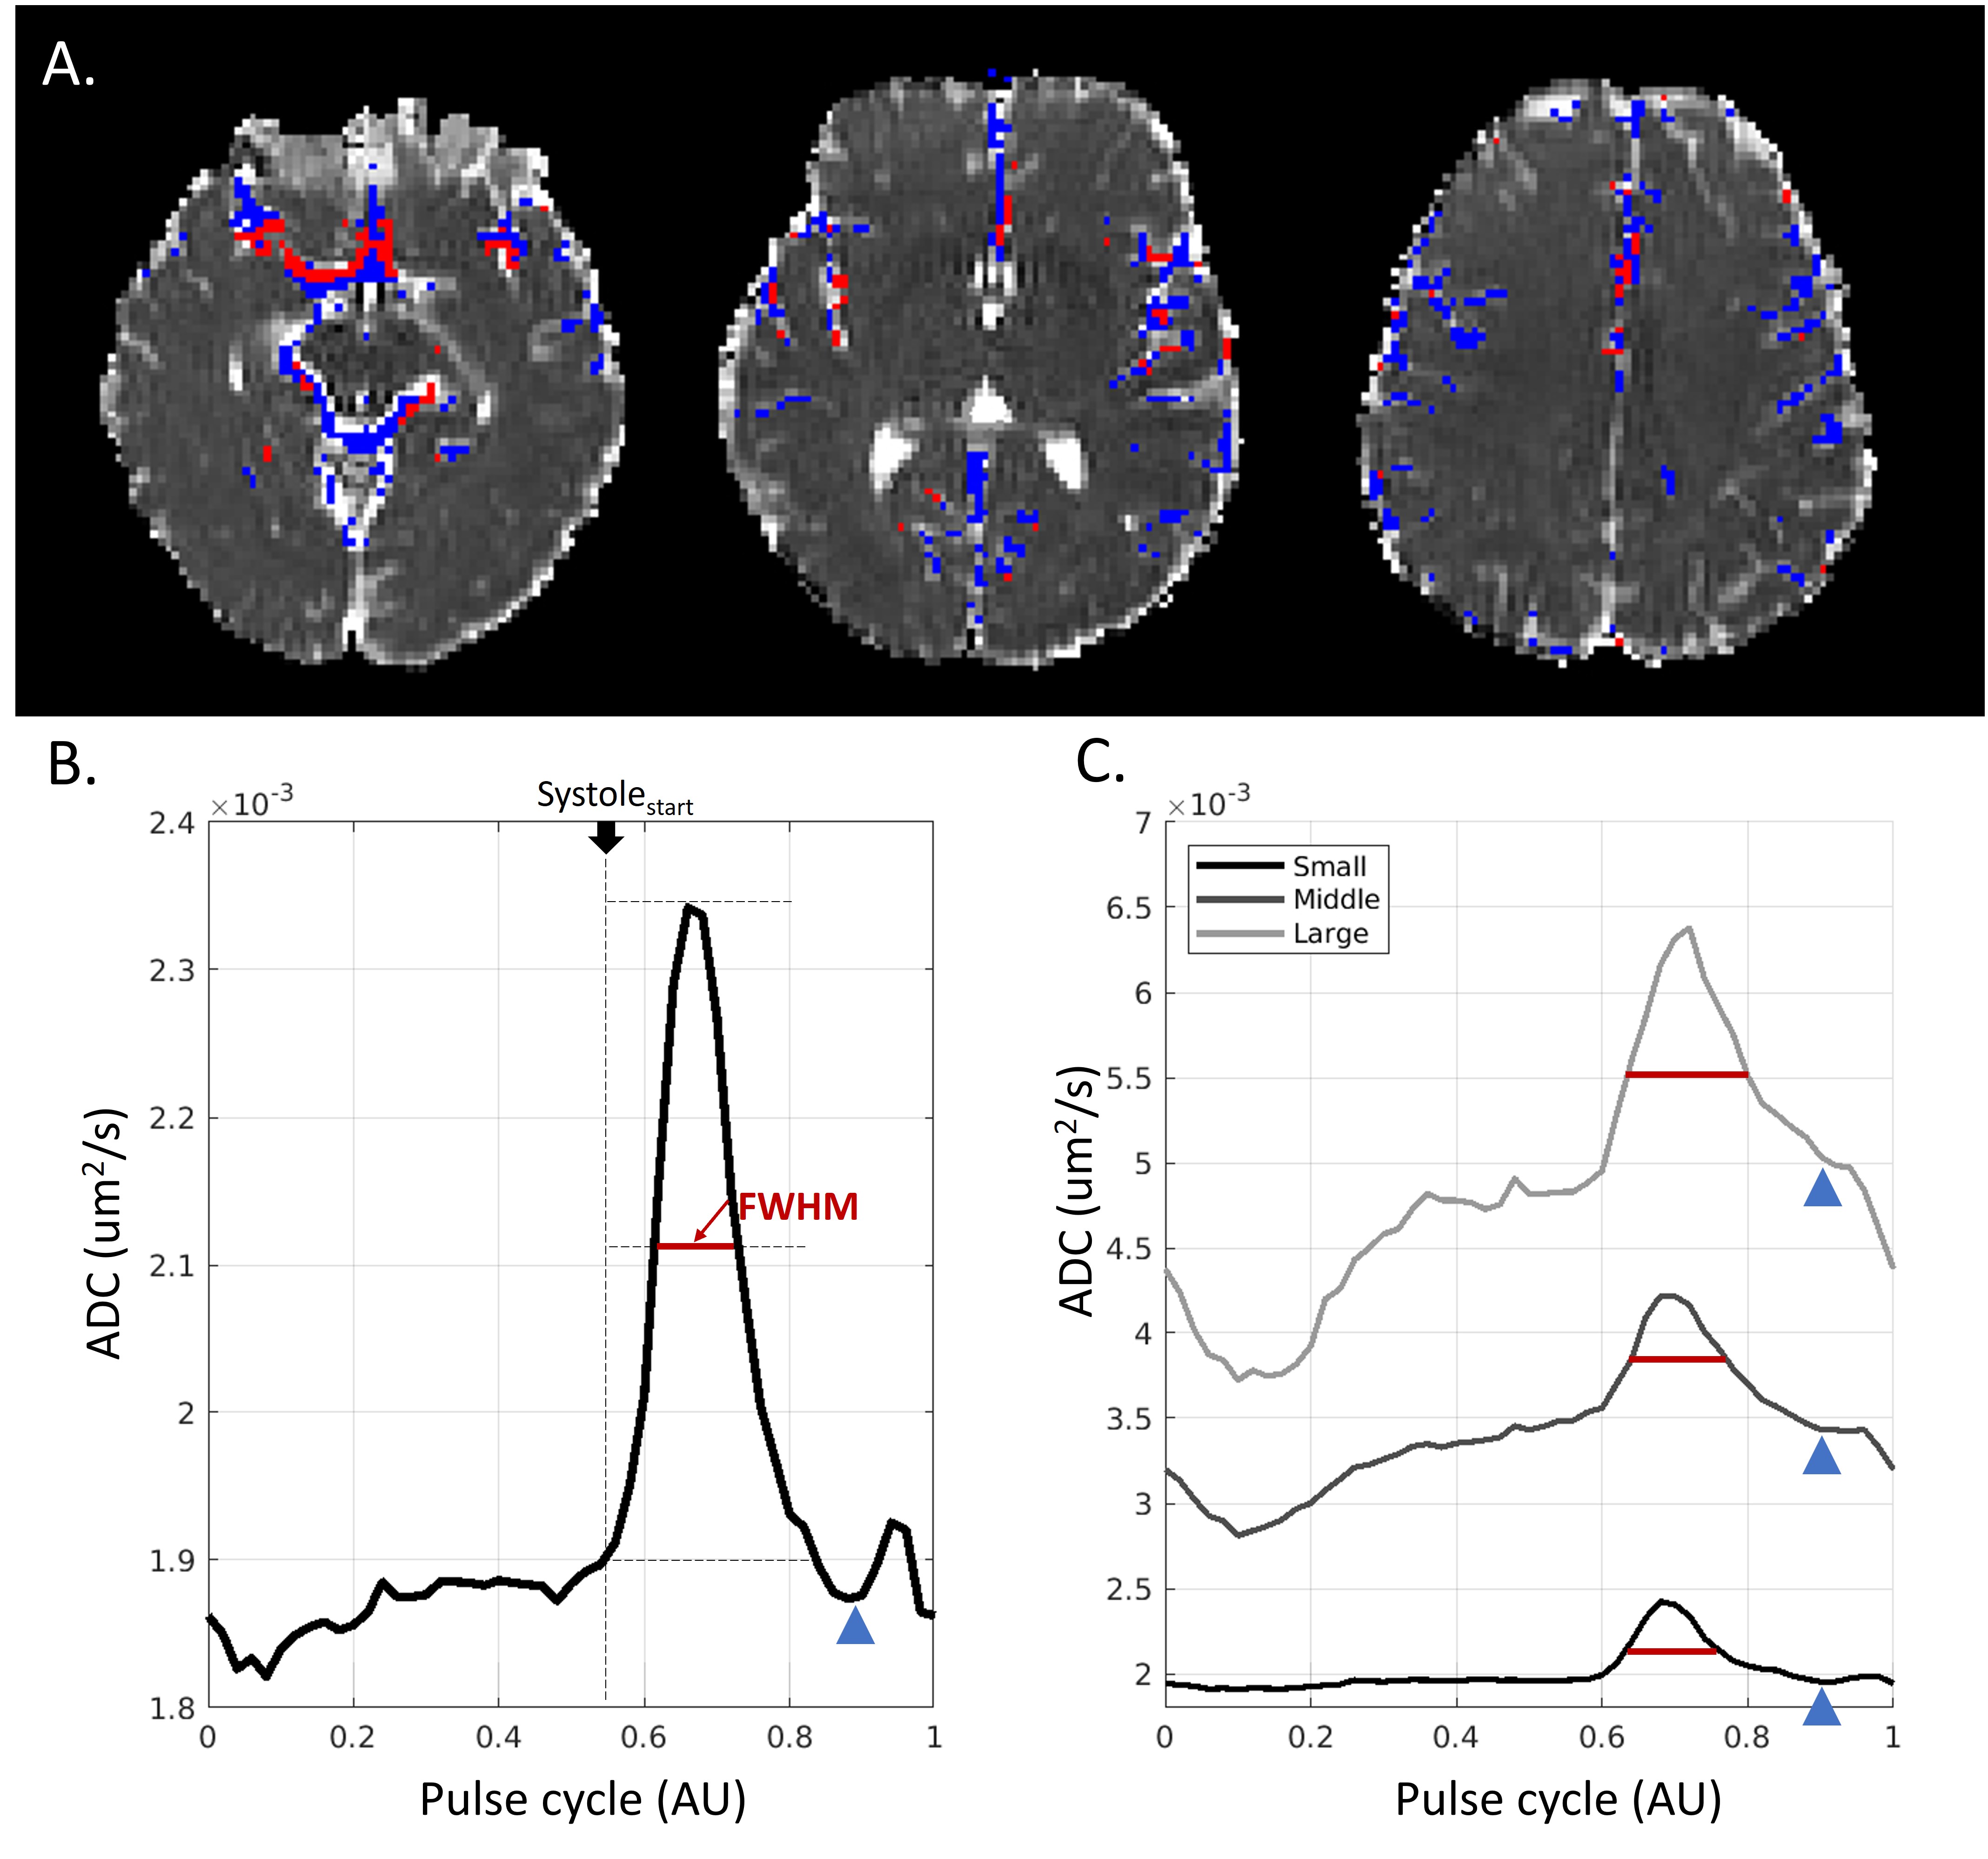
Paravascular CSF dynamics captured by CARDI: Figure 1 shows the temporal diffusion-weighted signal of two representative voxels, with the red from sPVS and the green from the white matter. The raw temporal DWI signals of the red voxel fluctuate much more than the green voxel (Figure 1BD). After aligning to the pulse cycle, the red voxel demonstrates an explicit cardiac-cycle dependency, not seen in the green (Figure 1CE).sPVS waveform and its dependency on artery sizes: ADC was used to depict the CSF waveforms in the sPVS. sPVS region was automatically delineated using ADC waveforms, tissue masks, and the artery atlas. Figure 2A shows the resulting sPVS mask in blue. The artery regions identified using time-of-flight are displayed in red. Results show that automatically delineated sPVS match well with the pial artery location.
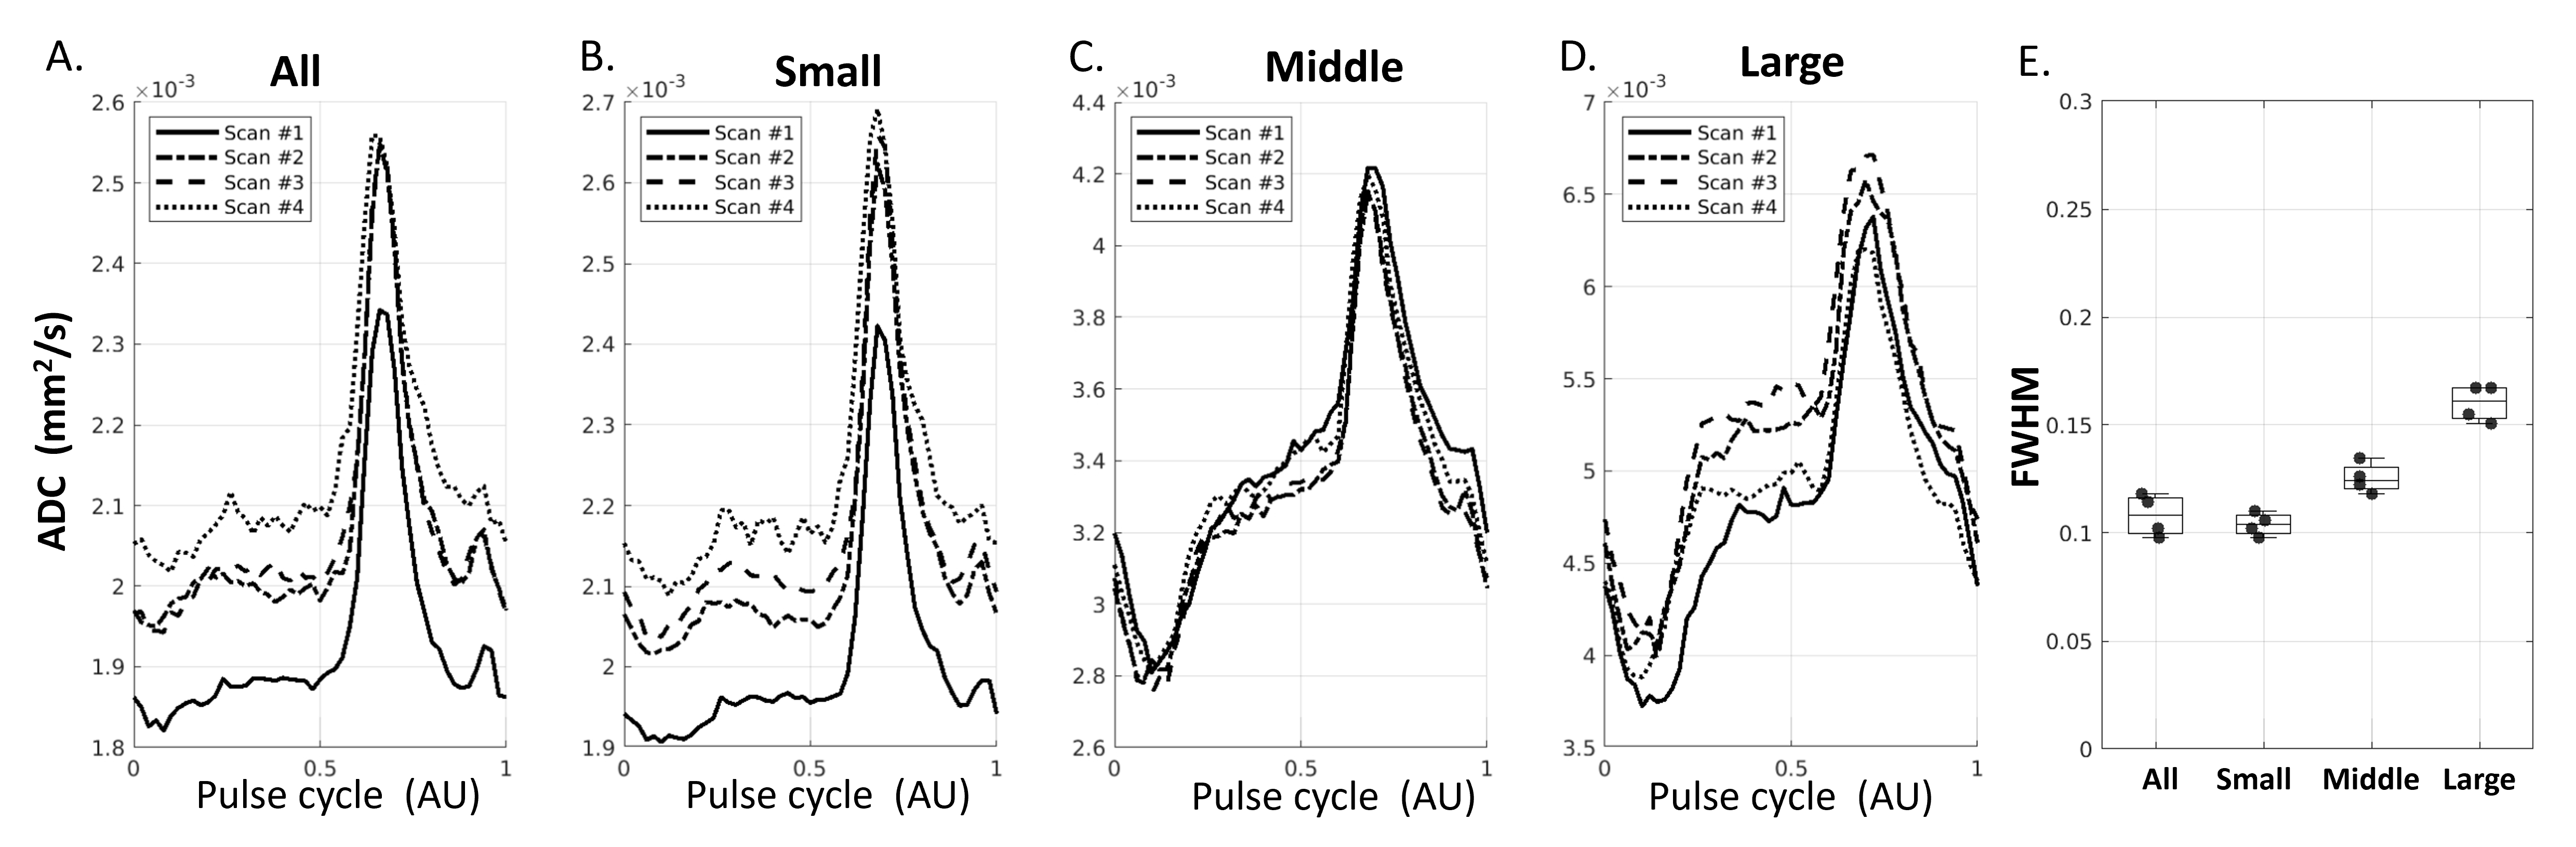
Figure 2B shows the averaged sPVS waveform in the sPVS mask across the whole brain. A clean and smooth pulsatile pattern can be seen, indicating the waveform's strong cardiac-cycle dependency. sPVS was further divided into Small (artery diameter<1.2mm), Middle (1.2mm≤diameter<1.8mm), and Large (diameter≥1.8mm) based on adjacent artery diameters using the artery atlas. The pulsatile pattern is seen in all three waveforms (Figure 2C), indicating the fluid near pial arteries of all sizes pulses in synchrony with the heart. A notch can be observed toward the end of the systolic (Figure 2BC, blue arrowhead), corresponding to the "dicrotic notch" in the arterial pressure waveform. The systolic peak width is different among the three waveforms. The full width at half maximum (FWHM) of the whole-brain waveform is 0.12 (Figure 2B, red line), which increases with artery size (Figure 2C, red line). Figure 3 confirmed the reproducibility of the above observations.
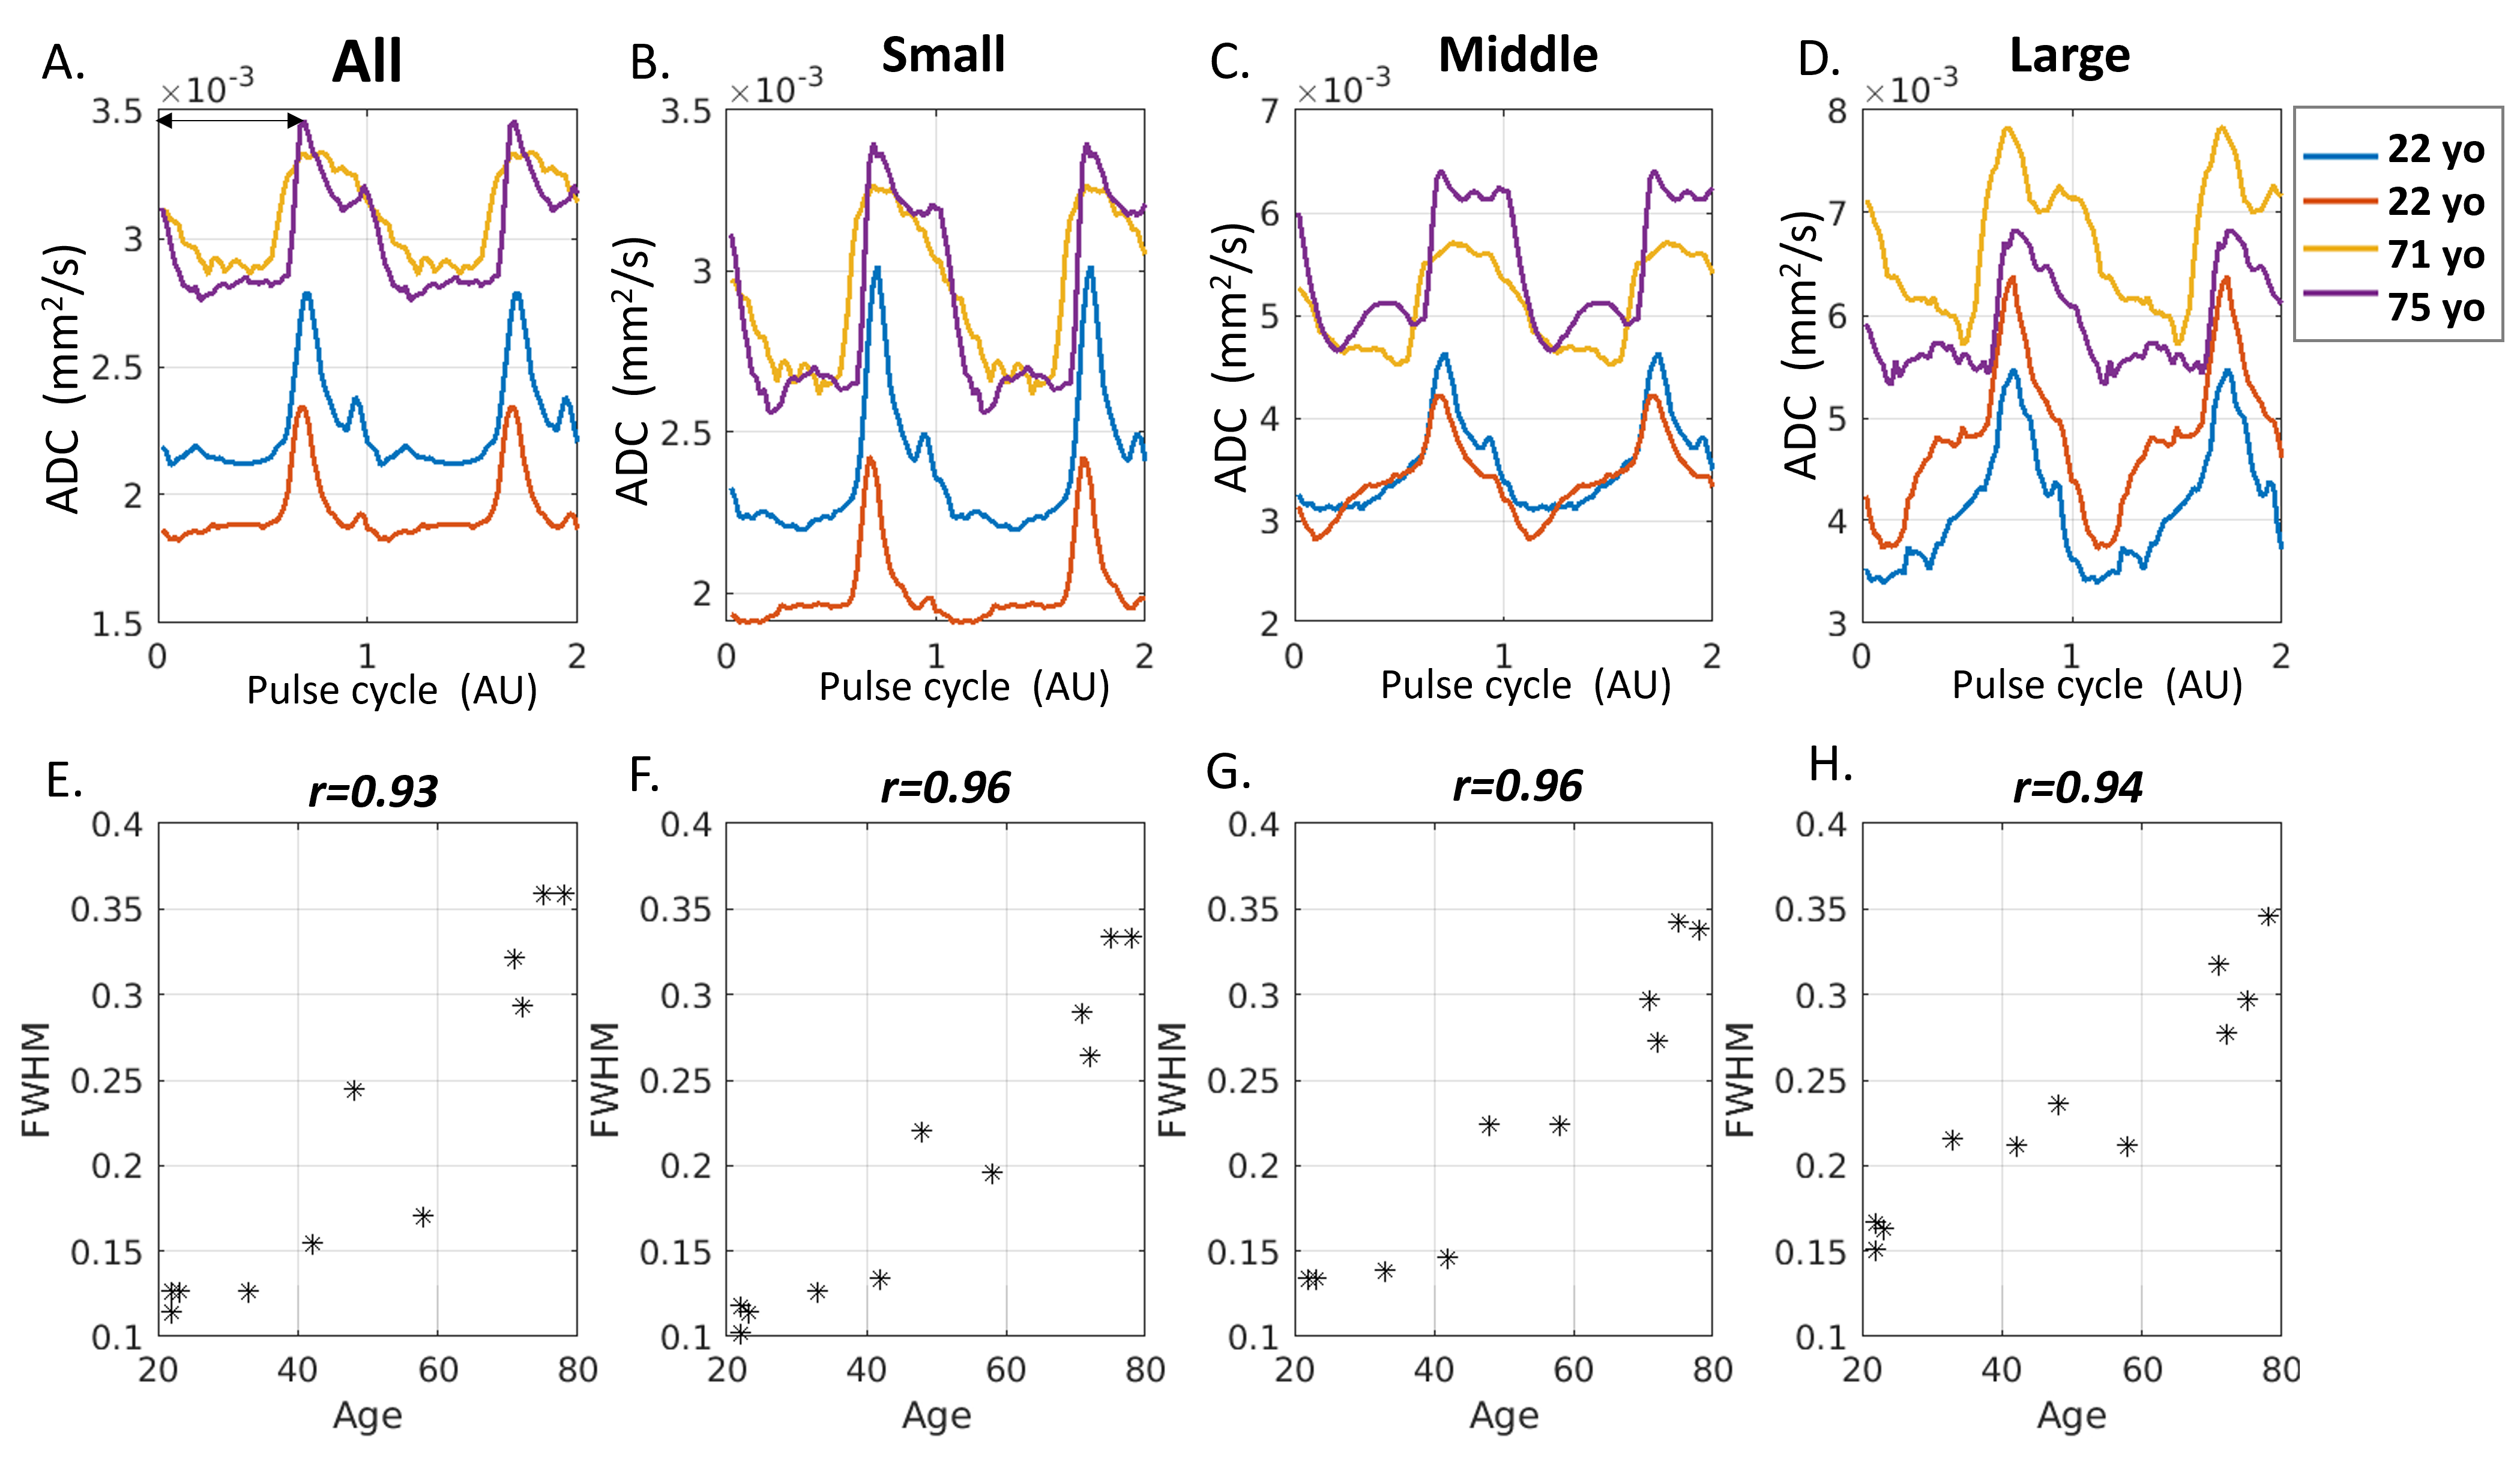
Age-association with fluid waveforms: Figure 4 summarizes the results of an aging group. Fluid waveforms of two younger and two older participants were shown in Figure 4A-D. Compared with the older brain, the systolic peak is much narrower in the younger brain, evident in all artery sizes (Figure 4B-D). Figure 4E-H shows the scatter plots of FWHM against age for all participants. A strong correlation between age and FWHM is observed in all artery sizes (p-value <0.000001).
DISCUSSION
By depicting the waveforms of CSF dynamics in sPVS surrounding pial arteries, our study reveals a tight relationship between the CSF dynamics and vessel wall kinetics. Our results support the "vascular pulsation" as a major mechanism by which paravascular CSF moves. The close correspondence between the CSF waveforms and vessel wall kinetics suggests that CSF waveforms may, in turn, reflect vessel wall integrity. This idea is supported by comparing CSF waveforms in an aging group. Our results show a strong linear relationship between the systole peak width and age. The peak widening in the aging brain may indicate a “forward-backward” CSF movement2, which is associated with the compromised vessel wall integrity and reflect a less effective perivascular pumping.Acknowledgements
The authors are grateful to Dr. Essa Yacoub from University of Minnesota for technical support. This research was supported by the National Institutes of Health R01 AG053993.References
1. Iliff JJ, Wang M, Liao Y, Plogg BA, Peng W, Gundersen GA, et al. A paravascular pathway facilitates CSF flow through the brain parenchyma and the clearance of interstitial solutes, including amyloid beta. Sci Transl Med 2012; 4(147): 147ra11.
2. Mestre H, Tithof J, Du T, Song W, Peng W, Sweeney AM, et al. Flow of cerebrospinal fluid is driven by arterial pulsations and is reduced in hypertension. Nat Commun 2018; 9(1): 4878.
Figures