0321
Real-Time Phase Contrast MRI to quantify Cerebral arterial flow variations during normal breathing1CHIMERE UR 7516, Jules Verne University, Amiens, France, 2Medical Image Processing Department, Jules Verne University Hospital, Amiens, France, 3Department of Radiology, Jules Verne University Hospital, Amiens, France
Synopsis
Real-time phase contrast MRI has been applied to investigate cerebral arterial blood flow (CABF) during normal breathing of healthy volunteers. We developed a novel time-domain analysis method to quantify the effect of normal breathing on several parameters of CABF. We found the existence of a delay between the recorded respiratory signal from the belt sensor and the breathing frequency component presents in the reconstructed arterial blood flows. During the expiratory, the mean flow rate of CABF increased by 4.4±1.7%, stroke volume of CABF increased by 9.8±3.1% and the duration of the cardiac period of CABF increased by 8.1±3%.
Introduction
The effect of respiration on cerebral arterial blood flow is not very well understood1,2. Conventionally, cardiac gated phase contrast sequences are used for the quantification of cerebral blood flow3-6, however, it cannot be applied to studies in this area because it only provides an average Cardiac Cycle Flow Curve (CCFC)7.With real-time phase contrast (RT-PC) sequences, it has currently been shown that there is an effect of deep breathing or coughing on cerebral blood flow and cerebrospinal fluid8-11. However, it is currently not well understood whether and to what extent normal respiration affects cerebral arteries blood flow, in this study, we used RT-PC to quantify this effect using a novel time-domain analysis method.
Methods
- Image acquisition
The RT-PC used in this study was a multi-shot, gradient-recalled echo-planar imaging sequence with a Cartesian trajectory. Using the parameter presented in Figure 1, the time resolution was 75ms/image, a respiratory monitoring belt was used for recording the respiratory signal. Participants were not asked to perform a specific respiratory pattern during the data collection. RT-PC was performed for each participant to quantify CABF at the intracranial and extracranial levels (Figure 1).
- Image Processing
- Quantification of the effect of respiration on arterial blood flow
- Statistical analysis
Results
Figure 3 shows the DiffEx-In (parameter, delay) signal of the carotid arteries of two participants.Figure 4 shows the results of CABF quantification and respiratory impact quantification. The cerebral blood flows were equal to 740±74 ml/min at the extracranial level and 679±119 ml/min at the intracranial level. The DiffEx-In were significantly smaller without considering the delay. In the case of considering delay, the delay% and DiffEx-In of mean flow rate are smaller than that of both stroke volume and cardiac period (p < 0.01). There was also a correlation between the delay% and DiffEx-In of mean flow rate and of cardiac period (Figure 5).
Discussion
In this study, the cerebral arterial blood flow obtained using RT-PC was accordance with the results previously obtained using cardiac gated phase contrast4,8. It was also found that under normal respiration, cerebral artery blood flow increased by 4.4±1.7% during the expiratory interval compared to the inspiratory interval. With increasing delay%, the DiffEx-In of the cardiac period was positively correlated, while the DiffEx-In of the mean flow was negatively correlated, which is a very interesting phenomenon and seems to be a positive response to stabilize stroke volume. This can be further confirmed in a subsequent study.Conclusion
Although there are some artifactual effects, RT-PC is very useful for investigating cerebral blood flow in real time within a few seconds, without any synchronizer.RT-PC combined with this novel method allows us to quantify the effect of respiration on multiple parameters of blood flow or cerebrospinal fluid, and the delay% parameter provides a new analytical perspective. It provides a technical support for subsequent studies on the effect of respiration on cerebral fluids circulation.
Acknowledgements
This research was supported by EquipEX FIGURES (Facing Faces Institute Guilding Research), European Union Interreg REVERT Project, Hanuman ANR-18-CE45-0014 and Region Haut de France.
Thanks to the staff members at the Facing Faces Institute (Amiens, France) for technical assistance.
Thanks to David Chechin from Phillips industry for his scientific support.
References
1. Bari, V., Marchi, A., De Maria, B., Rossato, G., Nollo, G., Faes, L., & Porta, A. (2016). Nonlinear effects of respiration on the crosstalk between cardiovascular and cerebrovascular control systems. Philosophical Transactions of the Royal Society A: Mathematical, Physical and Engineering Sciences, 374(2067), 20150179.
2. Ogoh, S. (2019). Interaction between the respiratory system and cerebral blood flow regulation. Journal of Applied Physiology, 127(5), 1197-1205.
3. Nayler, G. L., Firmin, D. N., & Longmore, D. B. (1986). Blood flow imaging by cine magnetic resonance. J Comput Assist Tomogr, 10(5), 715-722.
4. Balédent, O., & Idy-peretti, I. (2001). Cerebrospinal fluid dynamics and relation with blood flow: a magnetic resonance study with semiautomated cerebrospinal fluid segmentation. Investigative radiology, 36(7), 368-377.
5. Korbecki, A., Zimny, A., Podgórski, P., Sąsiadek, M., & Bladowska, J. (2019). Imaging of cerebrospinal fluid flow: fundamentals, techniques, and clinical applications of phase-contrast magnetic resonance imaging. Polish journal of radiology, 84, e240.
6. Lokossou, A., Metanbou, S., Gondry-Jouet, C., & Balédent, O. (2020). Extracranial versus intracranial hydro-hemodynamics during aging: a PC-MRI pilot cross-sectional study. Fluids and Barriers of the CNS, 17(1), 1-11.
7. Spijkerman, J. M., Geurts, L. J., Siero, J. C., Hendrikse, J., Luijten, P. R., & Zwanenburg, J. J. (2019). Phase contrast MRI measurements of net cerebrospinal fluid flow through the cerebral aqueduct are confounded by respiration. Journal of Magnetic Resonance Imaging, 49(2), 433-444.
8. Balédent O, Liu P, Lokossou A, Sidy F, Metanbou S, Makki M. (2019) Real-time phase contrast magnetic resonance imaging for assessment of cerebral hemodynamics during breathing. ISMRM 27th Annual Meeting & Exhibition in Montreal, Canada.
9. Yildiz, S., Thyagaraj, S., Jin, N., Zhong, X., Heidari Pahlavian, S., Martin, B. A., ... & Sabra, K. G. (2017). Quantifying the influence of respiration and cardiac pulsations on cerebrospinal fluid dynamics using real‐time phase‐contrast MRI. Journal of Magnetic Resonance Imaging, 46(2), 431-439.
10. Chen, L., Beckett, A., Verma, A., & Feinberg, D. A. (2015). Dynamics of respiratory and cardiac CSF motion revealed with real-time simultaneous multi-slice EPI velocity phase contrast imaging. Neuroimage, 122, 281-287.
11. Lagana M. M., Noam, A. J., et al. (2020) Arterial, venous and cerebrospinal fluid flow oscillations in real-time phase contrast MRI: type of breathing matters. ISMRM 2021 Annual Meeting & Exhibition.
12. Fall, S., Liu, P., & Baledent, O. (2019, October). A Semi-automatic Software for Processing Real-Time Phase-Contrast MRI Data. In ECCOMAS Thematic Conference on Computational Vision and Medical Image Processing (pp. 22-28). Springer, Cham.
Figures
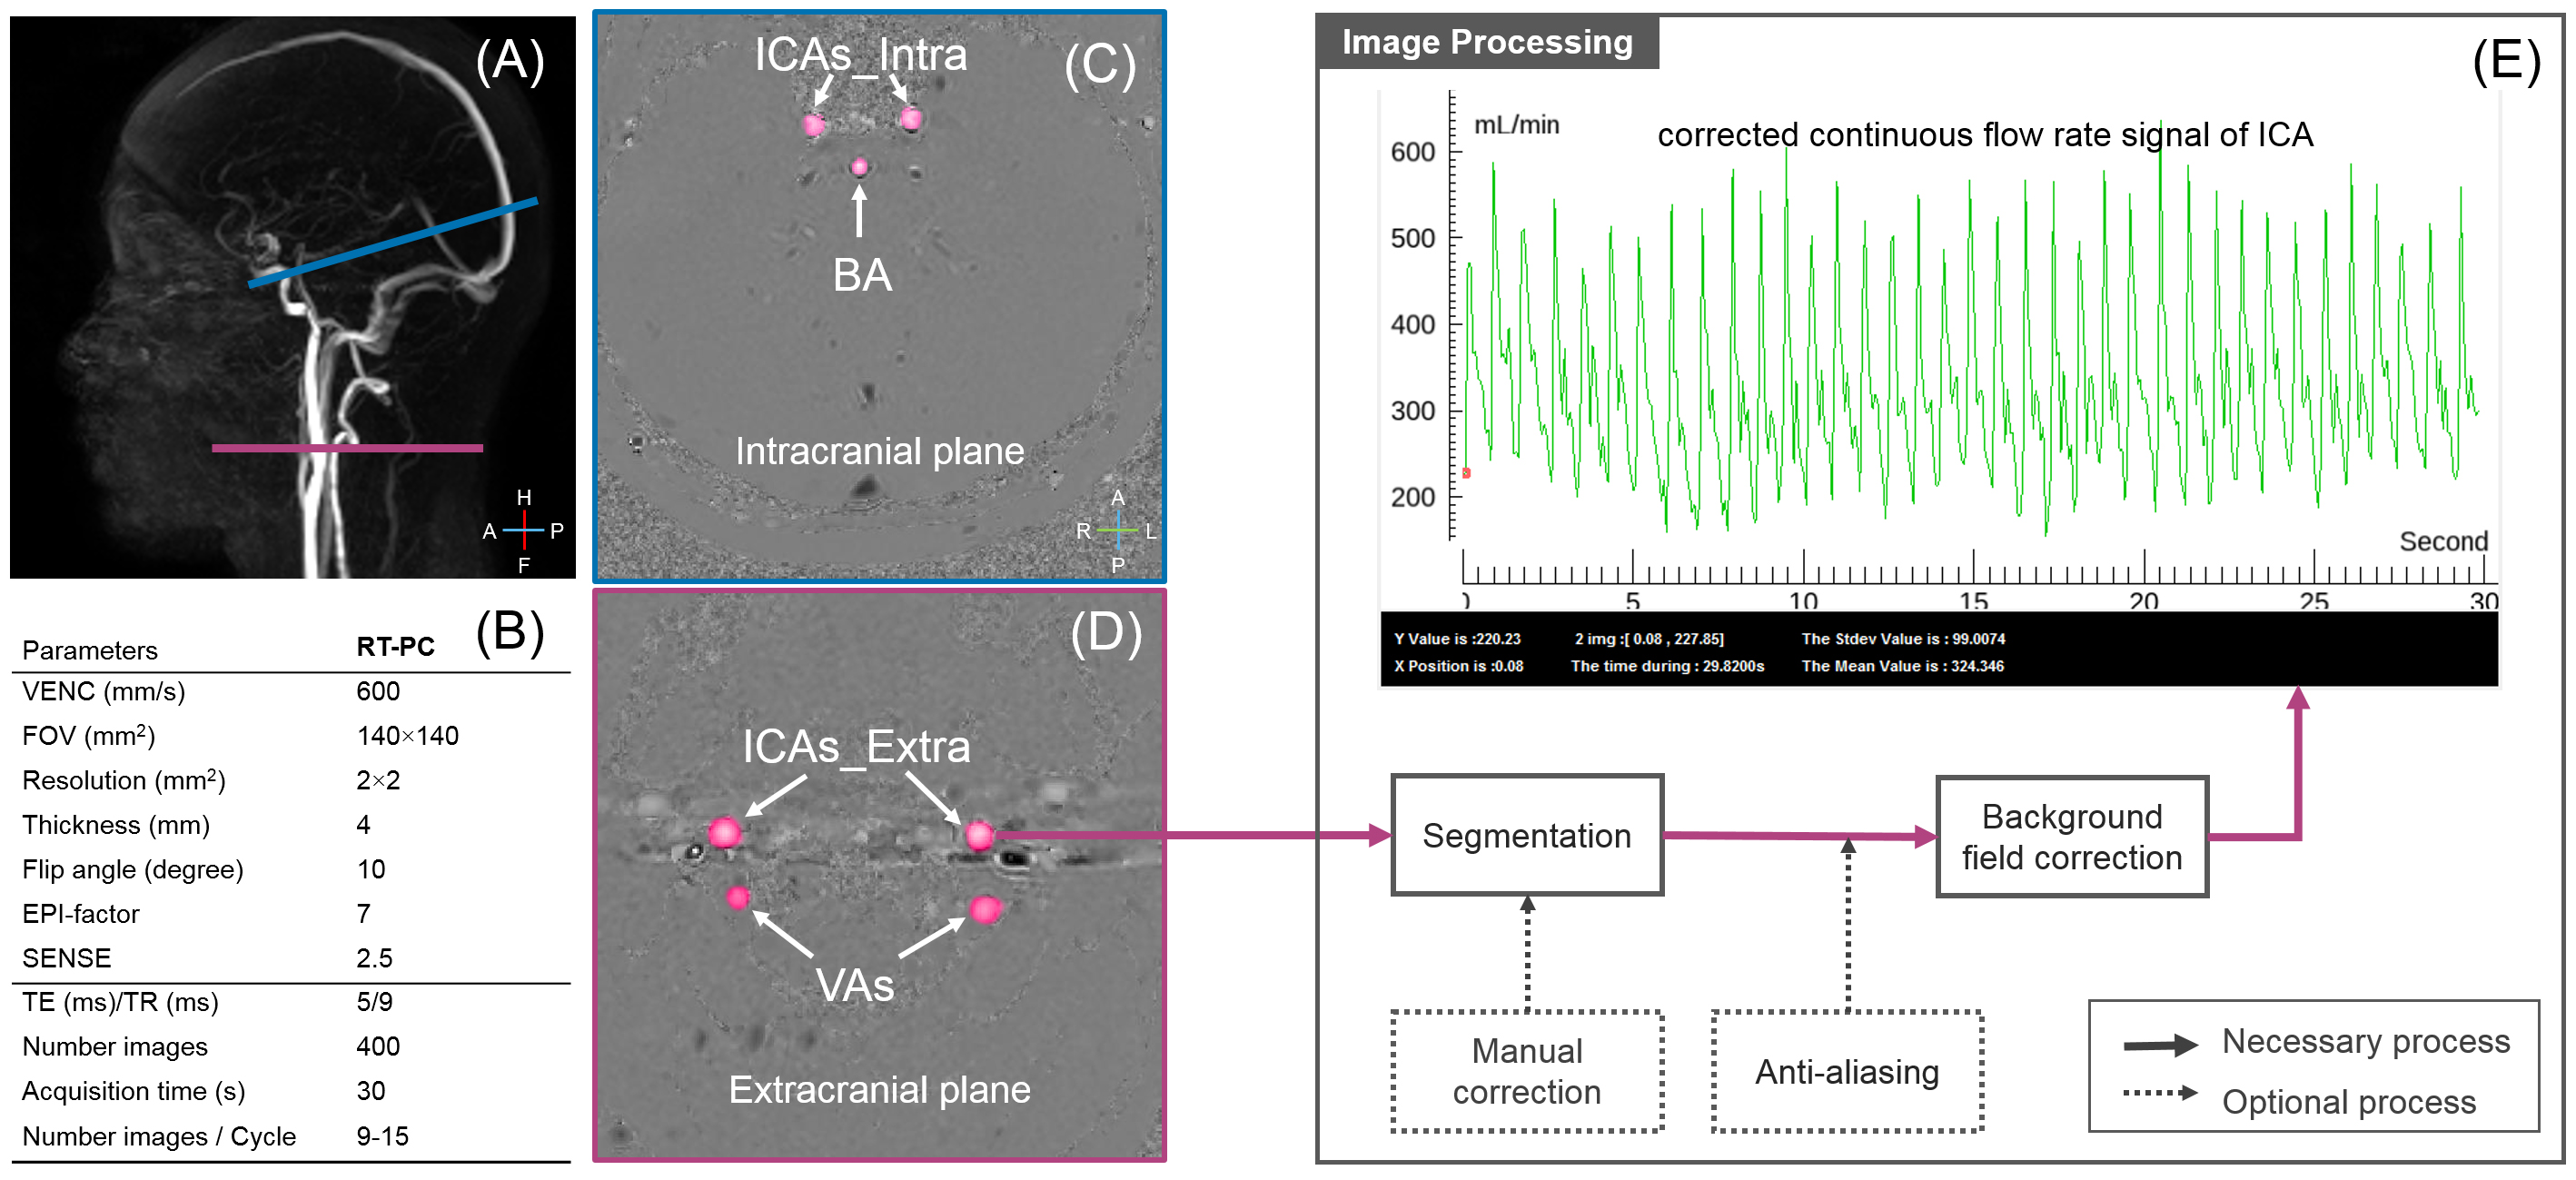
Figure 1: Location of the acquisition planes (A) and arteries (C&D), protocol of RT-PC (B) and the image processing flowchart (E). Right & left internal carotid artery (ICA) and right & left vertebral artery (VA) in the extracranial acquisition plane; right & left internal carotid and basilar artery (BA) in the intracranial acquisition plane.
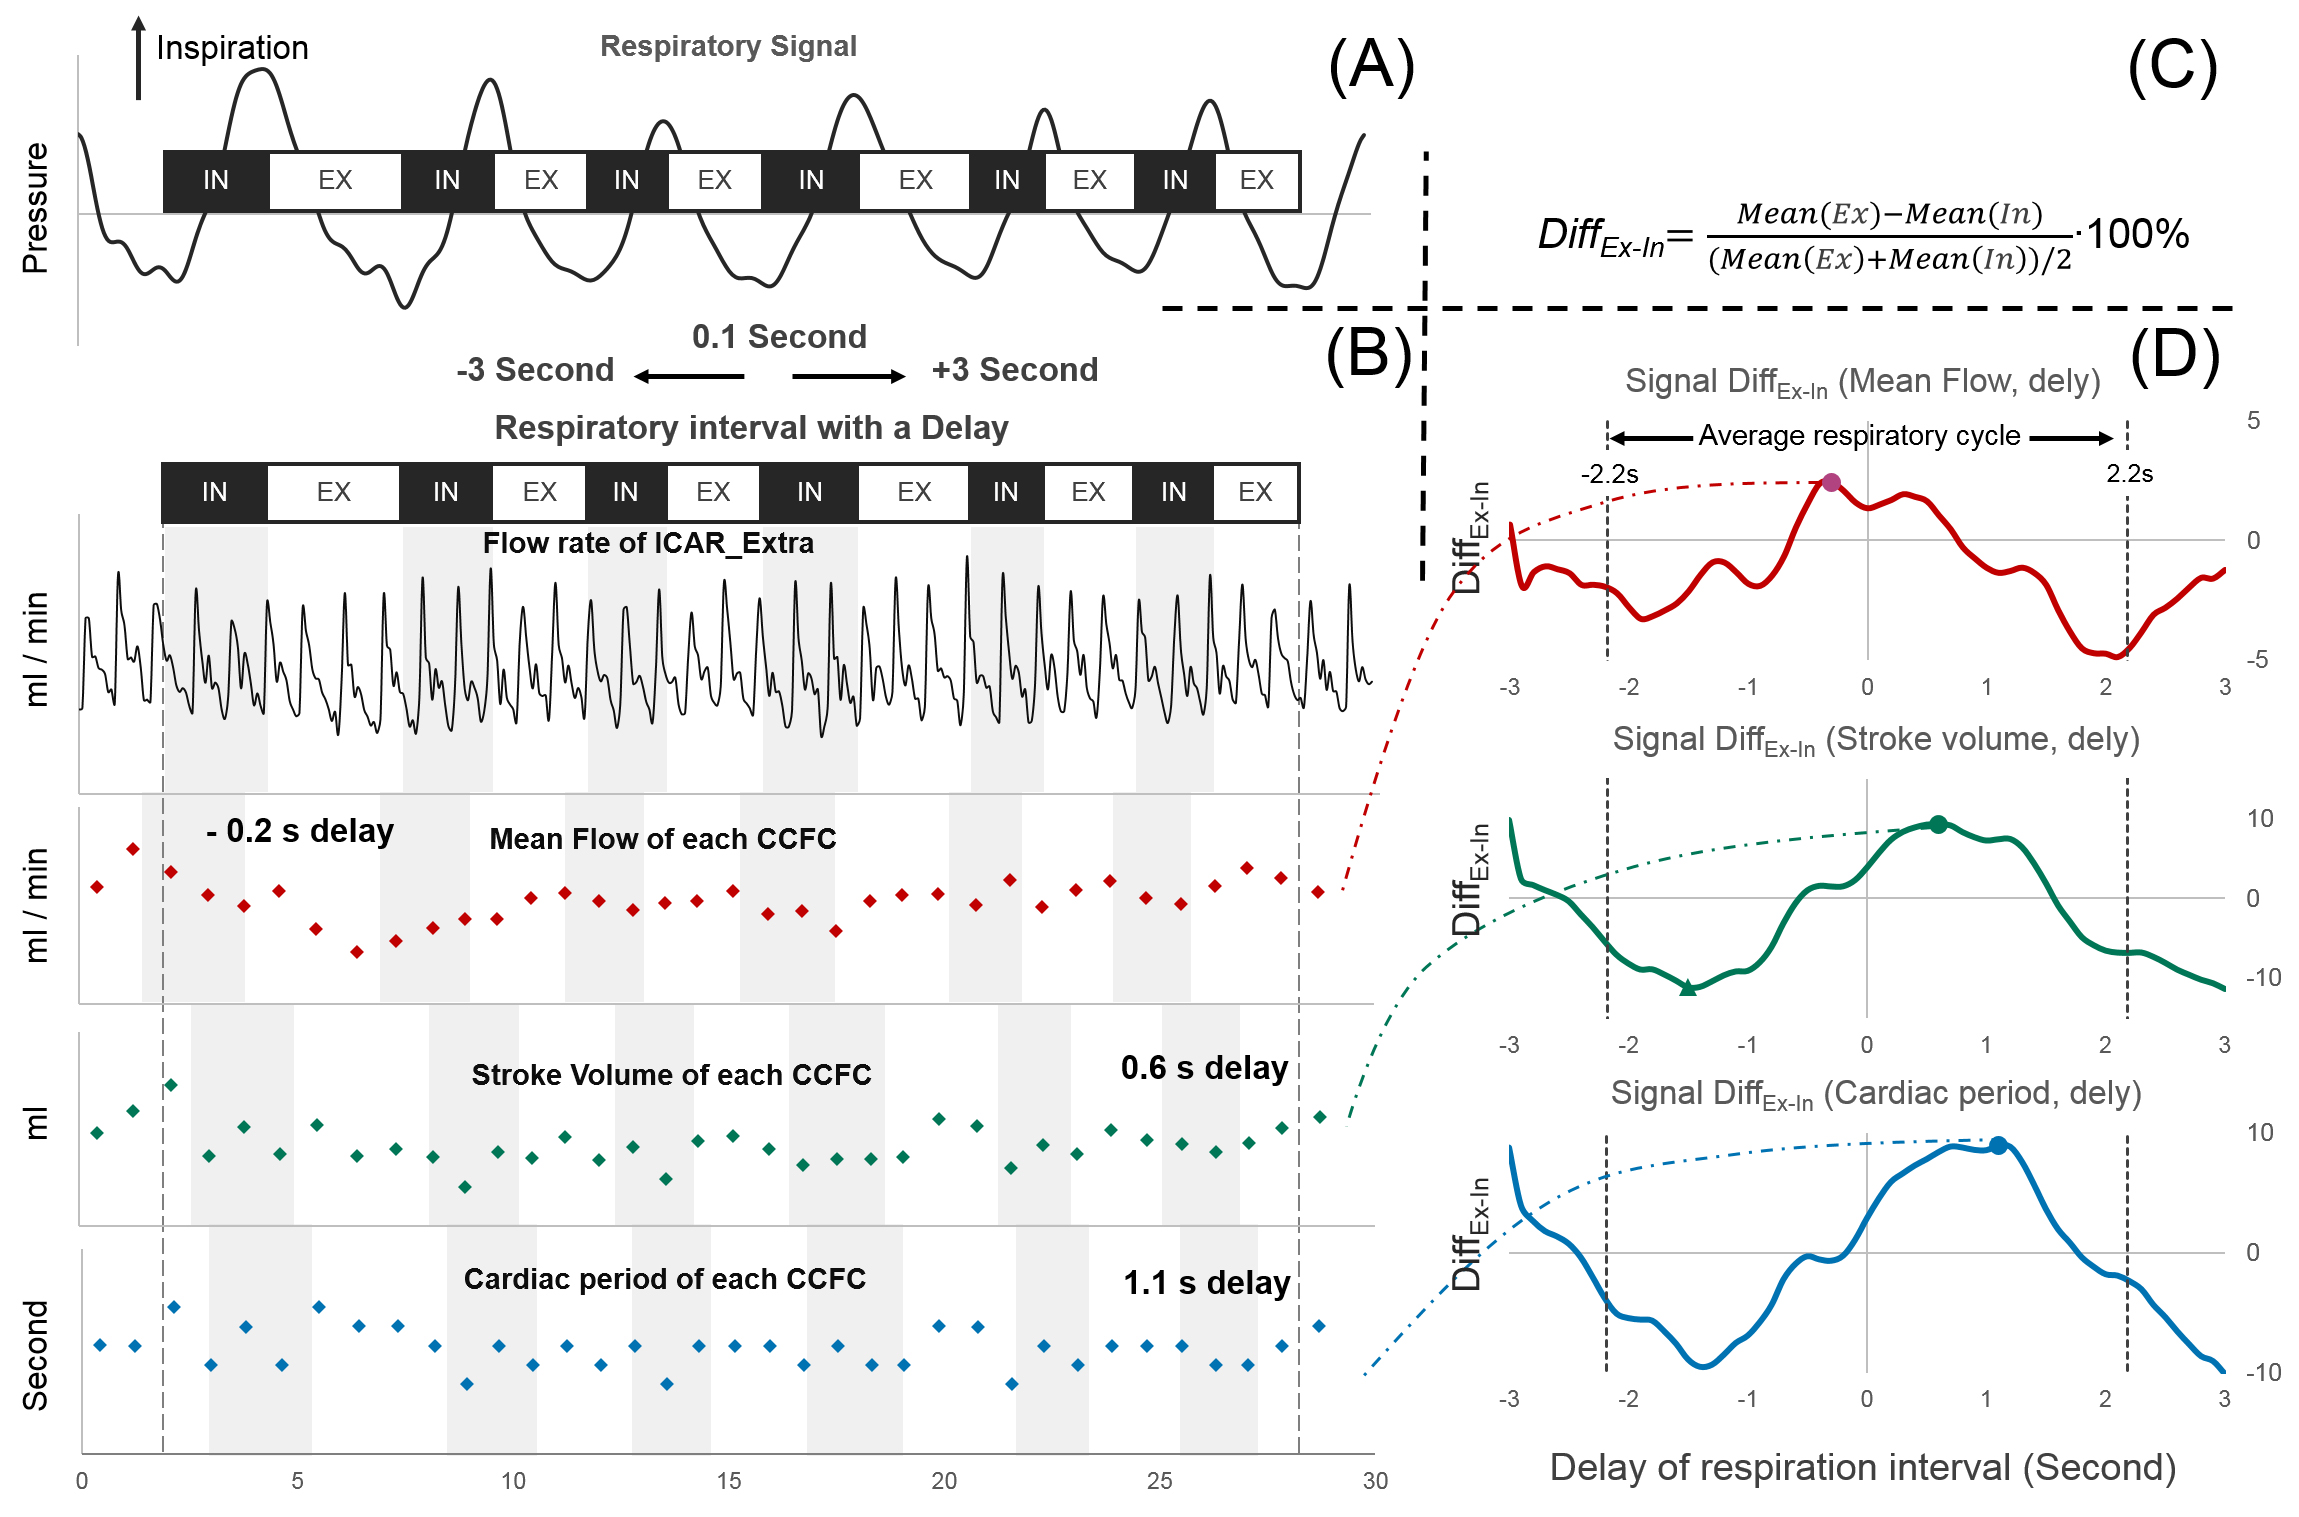
Figure 2: Schematic diagram of the quantitative respiratory impact process. Define inspiratory interval (IN) and expiratory interval (EX) using respiratory signal (A). The flow rate signal is segmented into multiple independent CCFCs and the three parameters are extracted (B), then the percentage difference between expiratory CCFC and inspiratory CCFC (DiffEx-In) is calculated for each parameter by equation C. Finally, the maximum DiffEx-In can be found by shifting the respiratory interval (delay) (D).
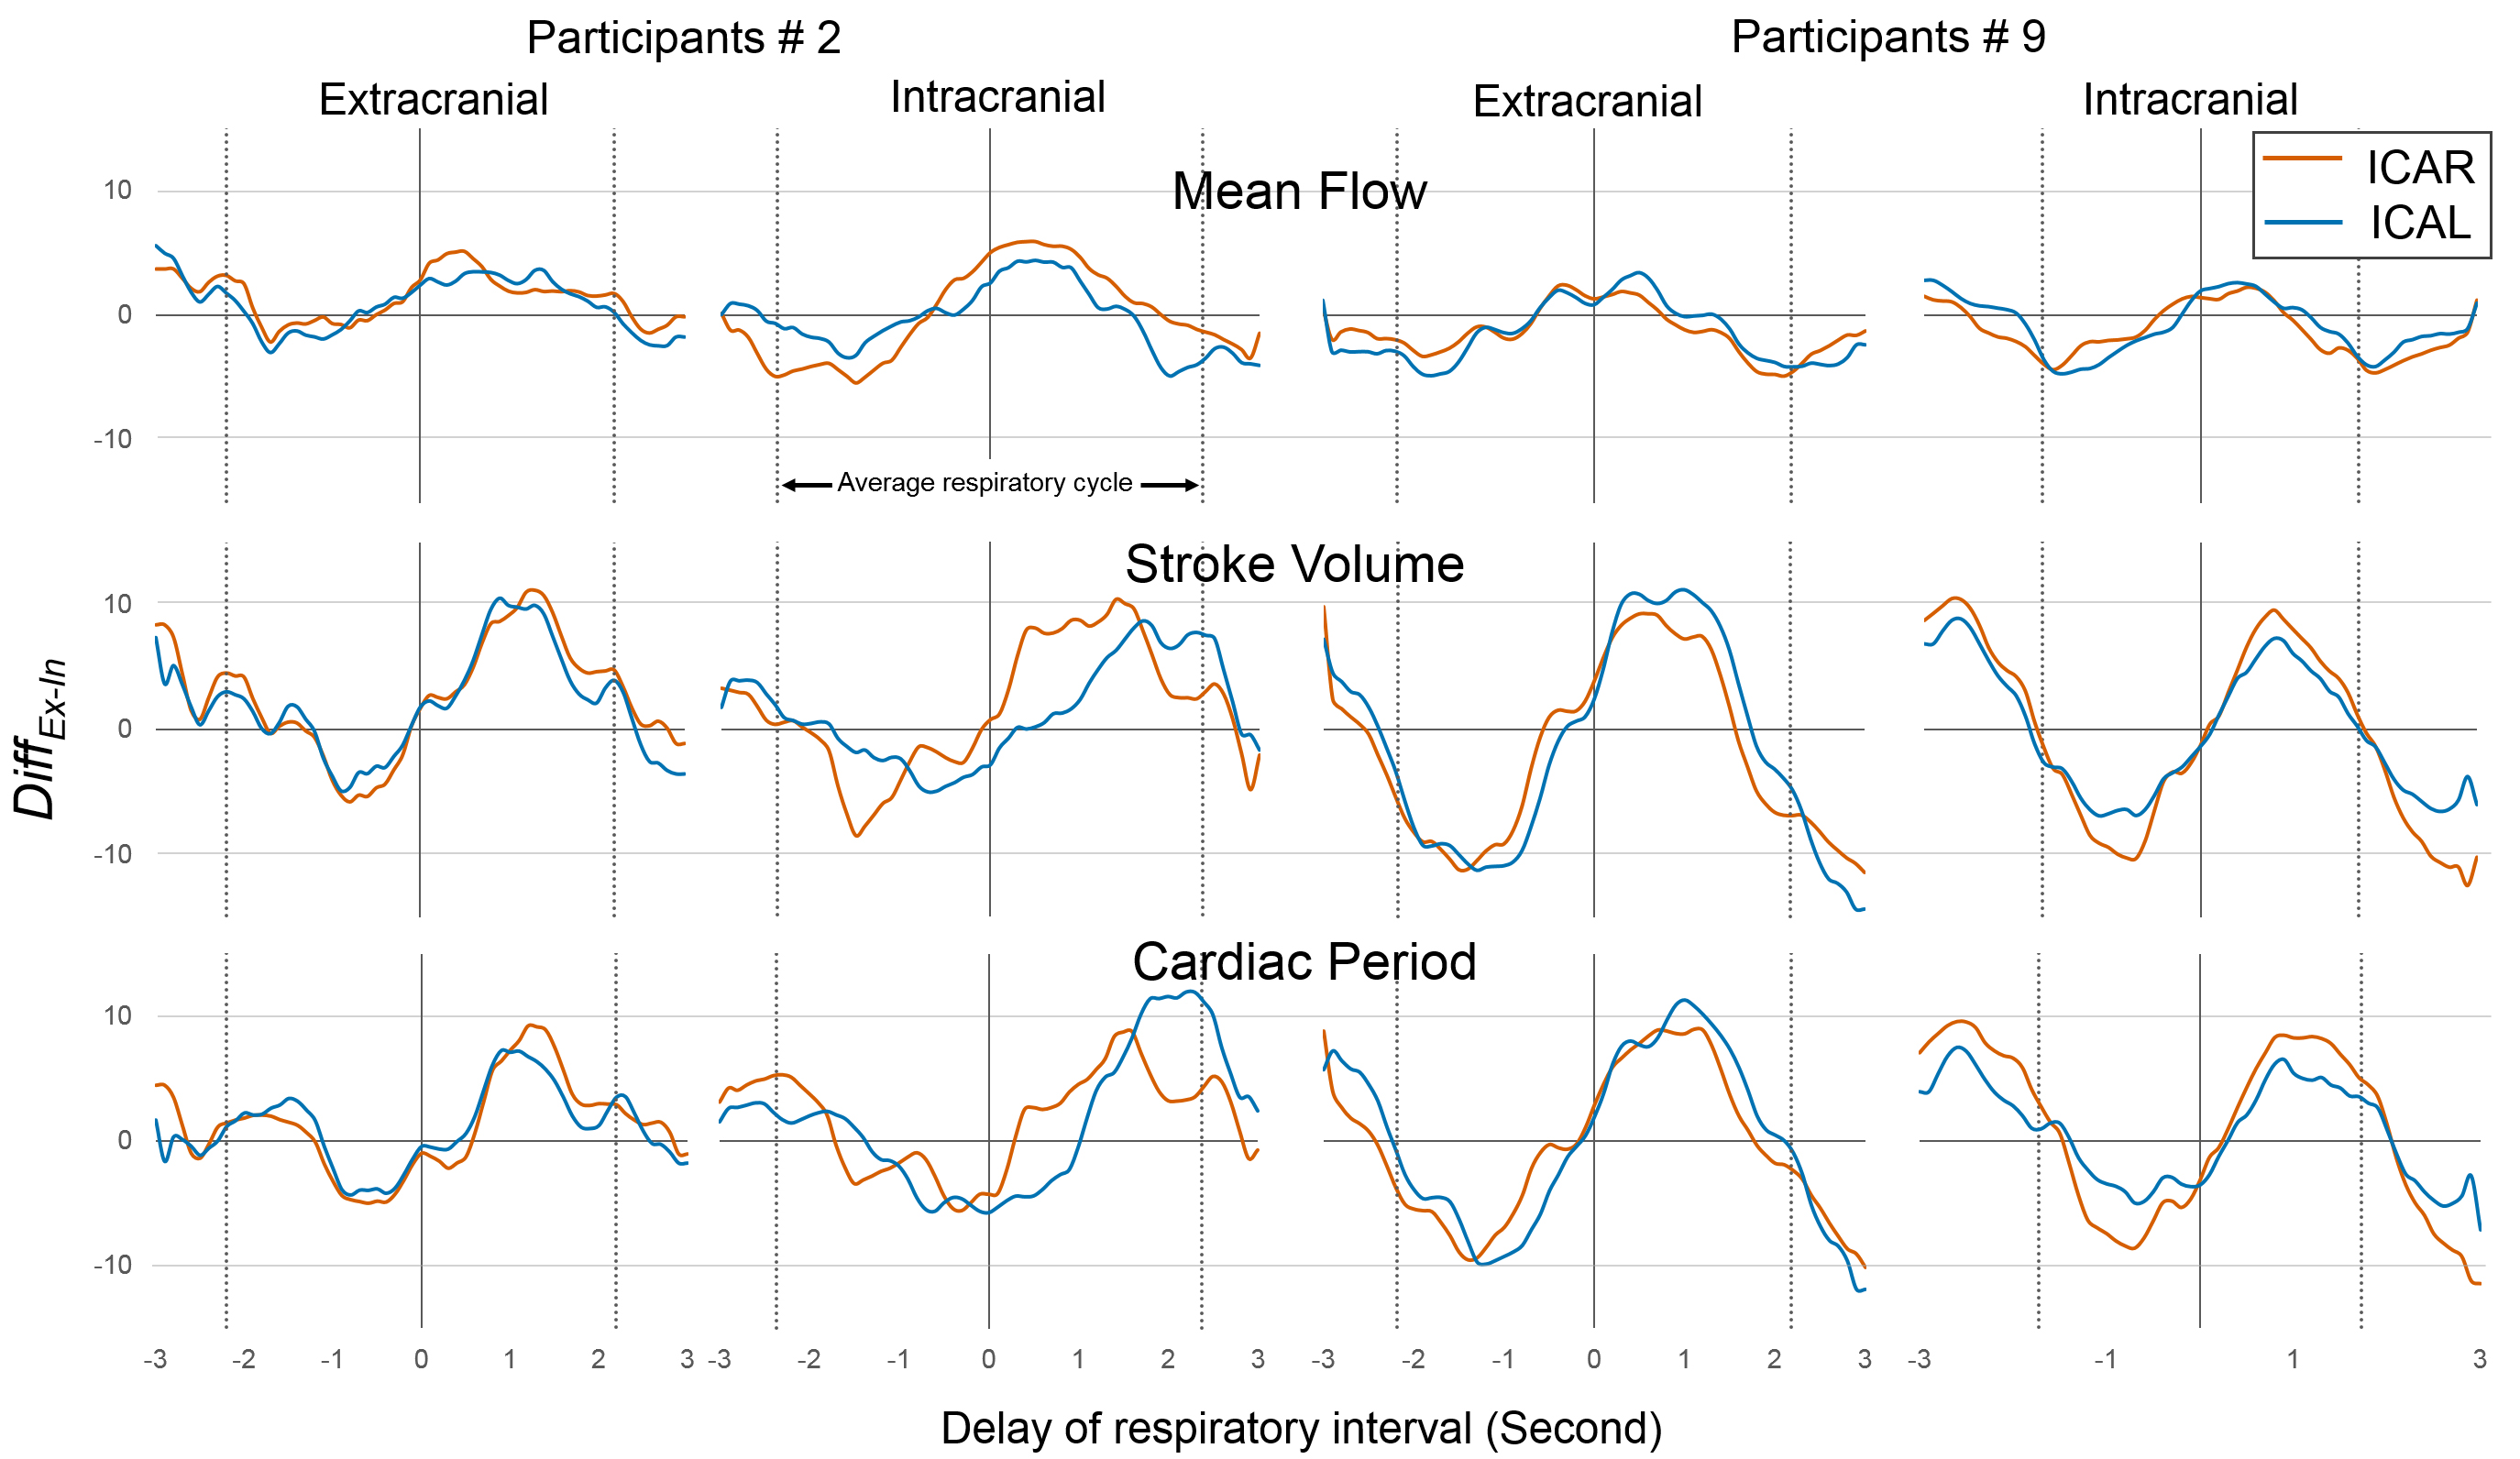
Figure 3: Example of DiffEx-In (parameter, delay) signal of the internal carotid arteries in two acquisition planes from two participants. ICAR indicates right internal carotid artery, the parameter indicates mean flow rate, stroke volume or cardiac period. The dotted line indicates an average respiratory cycle.
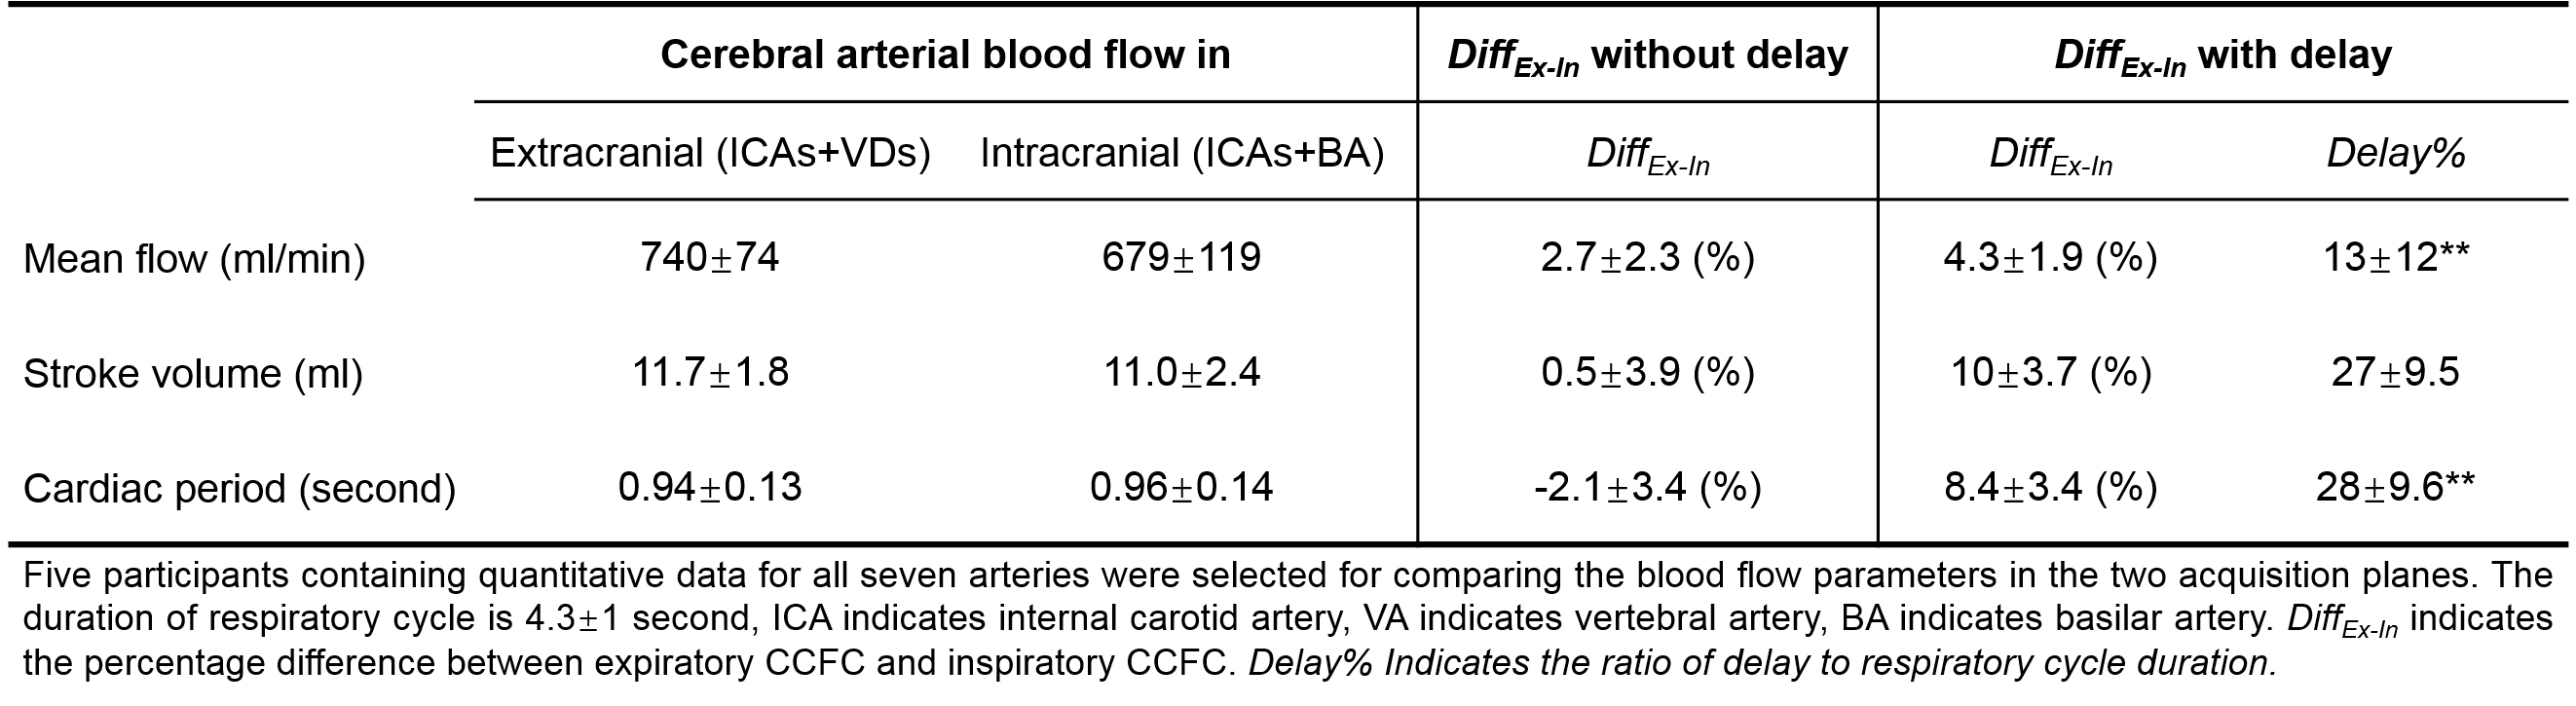
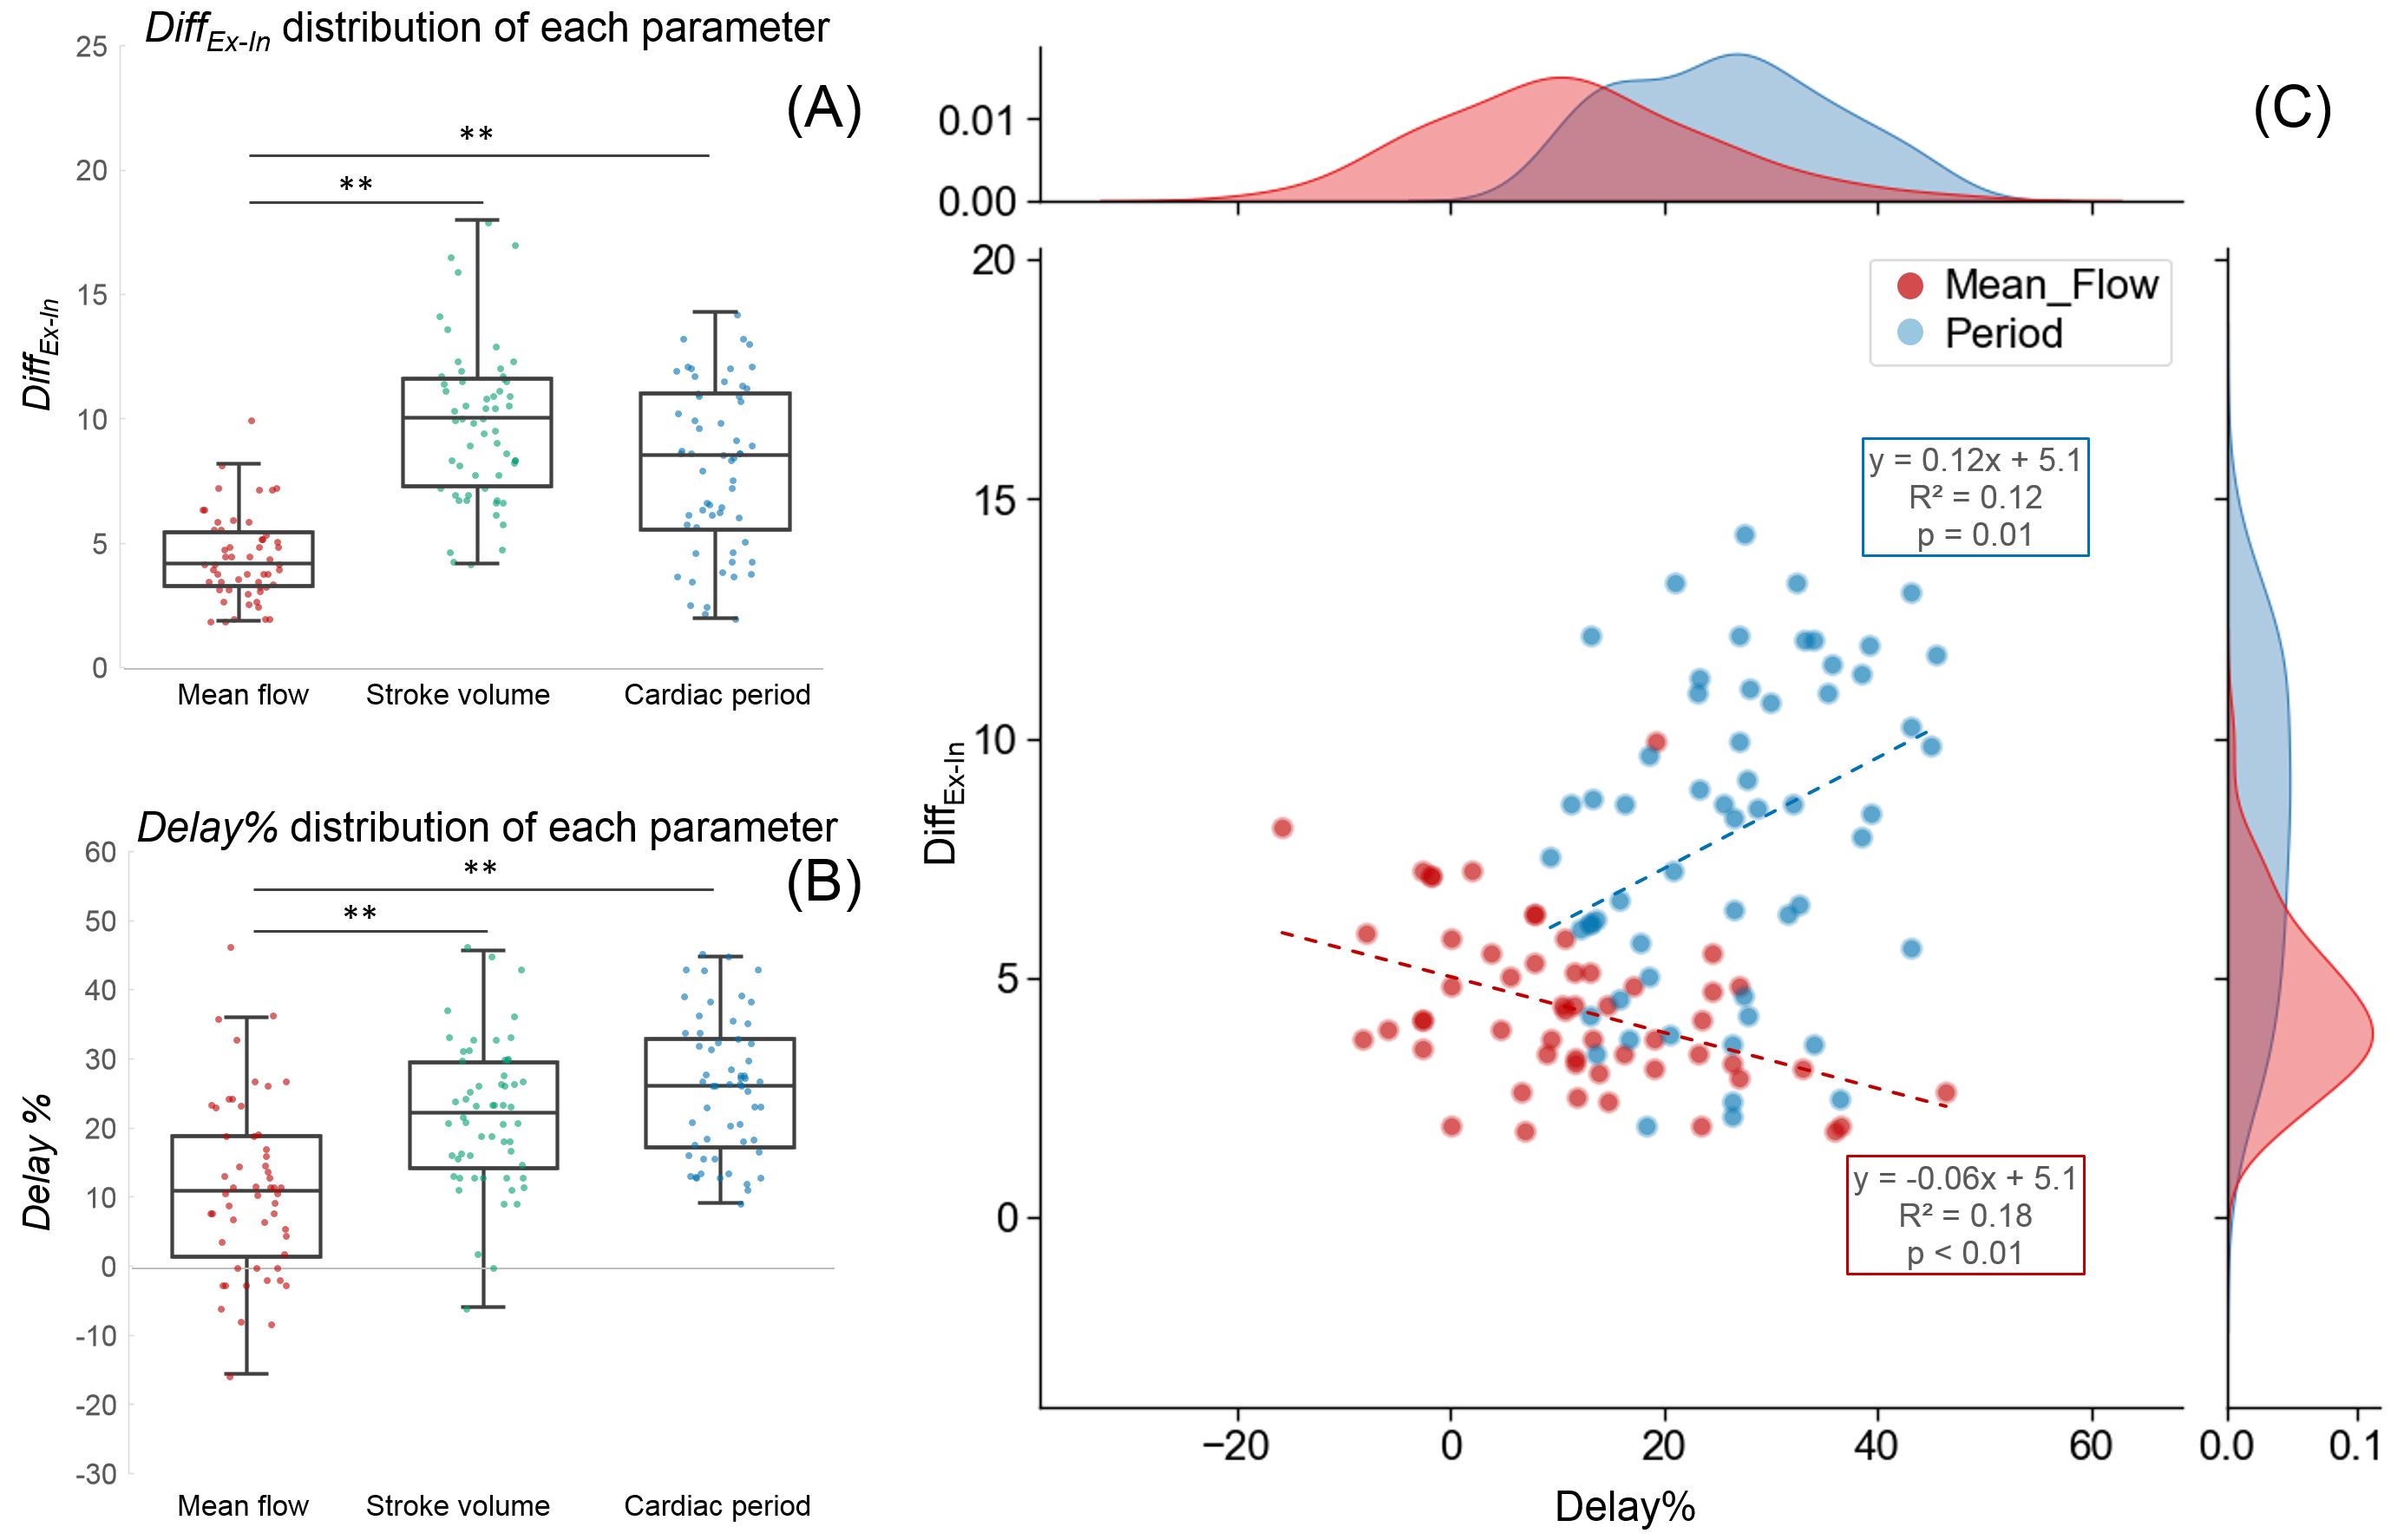
Figure 5: Distribution plots of DiffEx-In (A) and delay% (B) for each parameter. There is a negative correlation between the DiffEx-In and Delay% of the mean flow rate and a positive correlation between the DiffEx-In and Delay% of the cardiac period (C). ** indicates significant difference (p < 0.01, Wilcoxon signed-rank test).