0320
Effects of the cardiac and respiratory cycles on CSF-mobility in human subarachnoid and perivascular spaces1Radiology, Leiden University Medical Center, Leiden, Netherlands, 2Radiology and Nuclear Medicine, Amsterdam UMC, University of Amsterdam, Amsterdam, Netherlands, 3Neurology, Massachusetts General Hospital, Harvard Medical School, Boston, MA, United States, 4Biomedical Engineering & Physics, Amsterdam University Medical Center, Amsterdam, Netherlands
Synopsis
Although research into brain waste clearance has recently gained increasing attention, the driving force(s) as well as the physiological processes involved still remain strongly debated. Here, we assess the influence of the cardiac cycle and of respiration on the mobility of cerebrospinal fluid (CSF), thought to be an important waste carrier. We found that the cardiac cycle was inducing higher CSF-mobility changes than respiration.
Introduction
Despite the increasing evidence that cerebrospinal fluid (CSF)-mediated brain waste clearance is key for cerebral homeostasis, the driving force(s) involved in this process still remain unknown1,2: active driving forces have been suggested, such as cardiac pulsations3, respiration4, or vasomotion5, whereas other studies show that drainage only occurs via passive mixing mechanisms6,7. Moreover, current knowledge on brain clearance mechanisms is mostly based on experimental studies performed in rodents3,5,8,9. However, findings in rodents might not completely reflect CSF-motion in humans since physiological parameters, such as the cardiac or respiratory frequencies, are different between species. Altogether this could influence the relative contribution of the different proposed driving forces of CSF-mobility. In summary, getting a better understanding of the underlying mechanisms driving CSF-mobility is crucial in order to better comprehend human brain clearance.We previously showed that it was possible to use retrospective binning in k-space to measure CSF-mobility changes over the cardiac cycle10. Here we follow up on that work and provide quantitative measures of the influence of the cardiac cycle on CSF-mobility and compare it to that of respiration and to a random binning (negative control) in five regions of interest (ROIs).
Methods
Seven healthy subjects (age: 30±9y) were scanned at 7T (Philips, The Netherlands) using a head transmit coil and a 32-channel receive coil. All provided written informed consent for this IRB-approved study.High-resolution (0.45mm isotropic), whole-brain 3D images were acquired with a long echo time turbo-spin echo sequence (TSE) using a pseudo-random undersampling scheme10,11 (TSE-factor=146, TE/TR=497/3486ms). As previously described10,12, seven sets of images were acquired for each volunteer to create a tensor: one without crushers and six with crushers (velocity encoding gradients of 5mm/s) applied in different directions (Tacq=40min).
During the acquisition, the heart rate was recorded using a peripheral pulse unit and the respiration rate using a belt wrapped around the subject’s chest. After acquisition, each scan was reconstructed three times using the BART toolbox13: the k-space profiles were retrospectively binned in 6 phases, using retrospective binning to either (1) the cardiac cycle, or (2) the respiratory cycle or (3) to random phases (negative control).
Intra-subject images were registered using Elastix5. CSF-mobility and fractional anisotropy (FA) were modelled for each (cardiac/respiration/random) phase by computing the mean eigenvalue of a rank-two positive definite tensor, analogous to Diffusion Tensor Imaging.
The CSF-signal intensity, the average CSF-mobility and FA as well as the dependence of the CSF-mobility and FA on cardiac/respiration/random phases were evaluated in five manually delineated ROIs: fourth ventricle, subarachnoid spaces (SAS) around the middle cerebral artery (MCA), motor cortex sulci, perivascular spaces (PVS) in the basal ganglia (BG) and around penetrating arteries of the cortex (Fig.1).
To quantitatively estimate and compare how CSF-mobility varies across the proposed driving forces, the CSF-mobility change was fitted voxel-wise to a sinus function. The fit quality, the maximum amplitude as well as the phase of the maximum amplitude were the output parameters (Fig.4a).
Results
CSF-mobility is highest in the SAS around the MCA (0.041±0.006 mm2/s, Fig.2b) and 2-3 times lower in PVS of the BG and of penetrating arteries of the cortex.In large CSF-spaces close to the base of the brain (SAS MCA, 4th ventricle) and in PVS of penetrating arteries in the cortex, CSF-mobility fluctuates with the cardiac cycle but not with respiration (no difference with random binning, Fig.2). At the surface of the brain, in the SAS of the motor cortex sulci, and in the BG-PVS no dependence with either cardiac or respiratory effects is found. The post-processing itself does not artificially generate the observed CSF-mobility changes, since a random binning did not result in a clear pattern across phases (Fig.2-3), also shown by the fit quality which was lower than that of cardiac and respiration (Fig.5). Moreover, the percentage of voxels that presented a good fit (R2>0.7) to the sinusoidal pattern was lower in the random binning condition than both the cardiac and respiration binning (Fig.4).
In the regions where the cardiac cycle has an effect on CSF-mobility, an opposite effect in FA is observed (Fig.3), albeit at a smaller scale.
The amplitude of the CSF-mobility change induced by the cardiac cycle ranges from 4-12% (Fig.5).
Discussion and conclusion
The cardiac cycle has the highest influence on CSF-mobility in the SAS around large arteries, in the fourth ventricle and in the PVS of penetrating arteries of the cortex. No or minor effects of the respiratory cycle were observed.The presence of a wave pattern along a vessel or PVS is the subject of further investigations, and might have smoothed potential stronger effects if CSF-mobility varies with different phases within the ROI (e.g. in Figs2&3 that show average profiles over ROIs).
The opposite effects observed on the FA suggest that the cardiac cycle induces CSF motion perpendicularly to the original motion direction.
A strength of our dataset is that a direct comparison can be made between the cardiac/respiration/random phases as they all originate from the same datasets (i.e. one dataset reconstructed in different ways).
Future steps will include studying cardiac and respiratory influence on SAS around veins, since it is hypothesized that respiration induced pressure changes mainly affect the venous system14.
Acknowledgements
This work is part of the research program Innovational Research Incentives Scheme Vici with project number 016.160.351, which is financed by NWO. It was also supported by Alzheimer Nederland.References
1. Dolgin, E. Brain’s drain. Nat. Biotechnol. (2020) doi:10.1038/s41587-020-0443-1.
2. Mestre, H., Mori, Y. & Nedergaard, M. The Brain’s Glymphatic System: Current Controversies. Trends Neurosci. xx, 1–9 (2020).
3. Mestre, H. et al. Flow of cerebrospinal fluid is driven by arterial pulsations and is reduced in hypertension. Nat. Commun. (2018) doi:10.1038/s41467-018-07318-3.
4. Vinje, V. et al. Respiratory influence on cerebrospinal fluid flow – a computational study based on long-term intracranial pressure measurements. Sci. Rep. (2019) doi:10.1038/s41598-019-46055-5.
5. van Veluw, S. J. et al. Vasomotion as a Driving Force for Paravascular Clearance in the Awake Mouse Brain. Neuron (2020) doi:10.1016/j.neuron.2019.10.033.
6. Smith, A. J. & Verkman, A. S. The ‘glymphatic’ mechanism for solute clearance in Alzheimer’s disease: Game changer or unproven speculation? FASEB J. (2018) doi:10.1096/fj.201700999.
7. Bakker, E. N. T. P., Naessens, D. M. P. & VanBavel, E. Paravascular spaces: entry to or exit from the brain? Exp. Physiol. (2019) doi:10.1113/EP087424.
8. Iliff, J. J. et al. A paravascular pathway facilitates CSF flow through the brain parenchyma and the clearance of interstitial solutes, including amyloid β. Sci. Transl. Med. (2012) doi:10.1126/scitranslmed.3003748.
9. Albargothy, N. J. et al. Convective influx/glymphatic system: tracers injected into the CSF enter and leave the brain along separate periarterial basement membrane pathways. Acta Neuropathol. (2018) doi:10.1007/s00401-018-1862-7.
10. Hirschler, L. et al. The driving force of glymphatics: influence of the cardiac cycle on CSF mobility in perivascular spaces in humans. in Proceedings of the 29th Annual Meeting of ISMRM, Sydney, Australia, 2020. Abstract 2127.
11. Mazzoli, V. et al. Accelerated 4D phase contrast MRI in skeletal muscle contraction. Magn. Reson. Med. 80, (2018).
12. Hirschler, L. et al. High resolution T2-prepared MRI enables non-invasive assessment of CSF flow in perivascular spaces of the human brain. in Proceedings of the 28th Annual Meeting of ISMRM, Montréal, Canada, 2019. Abstract 0746.
13. Uecker, M., Tamir, J. I., Ong, F. & Lustig, M. The BART Toolbox for Computational Magnetic Resonance Imaging. Ismrm (2016).
14. Rasmussen, M. K., Mestre, H. & Nedergaard, M. Fluid Transport in the Brain. Physiol. Rev. (2021) doi:10.1152/physrev.00031.2020.
Figures
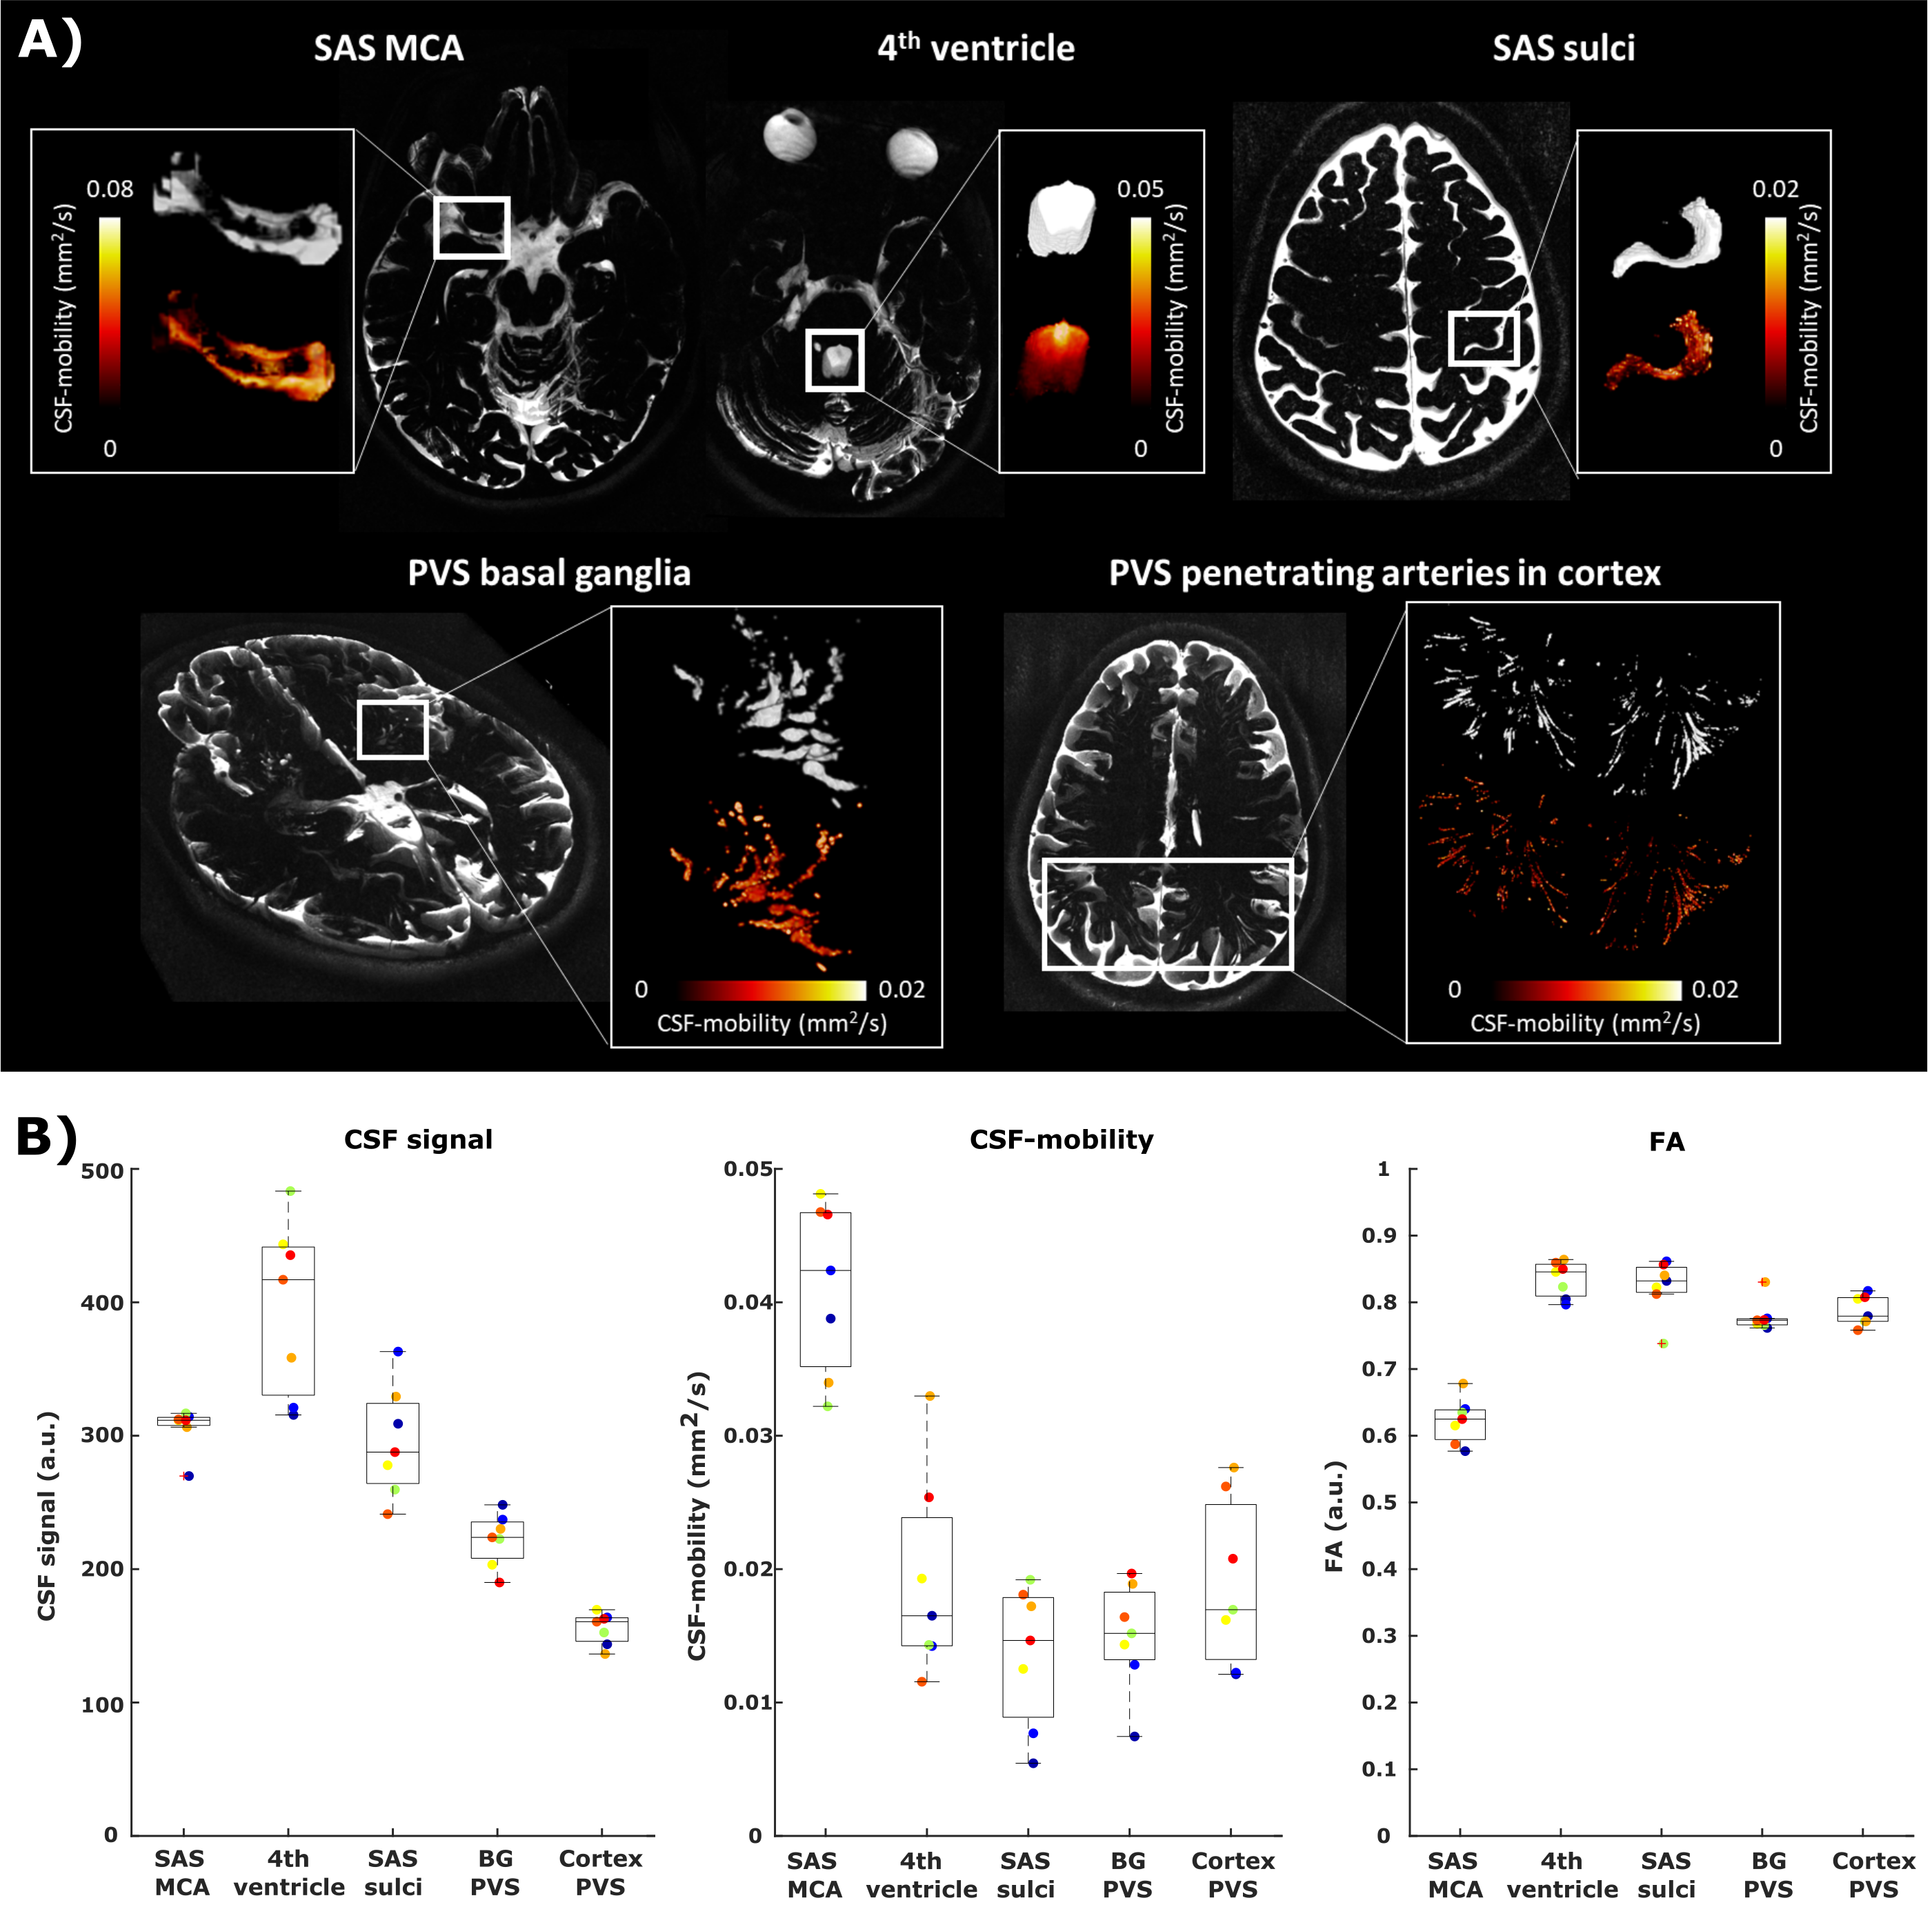
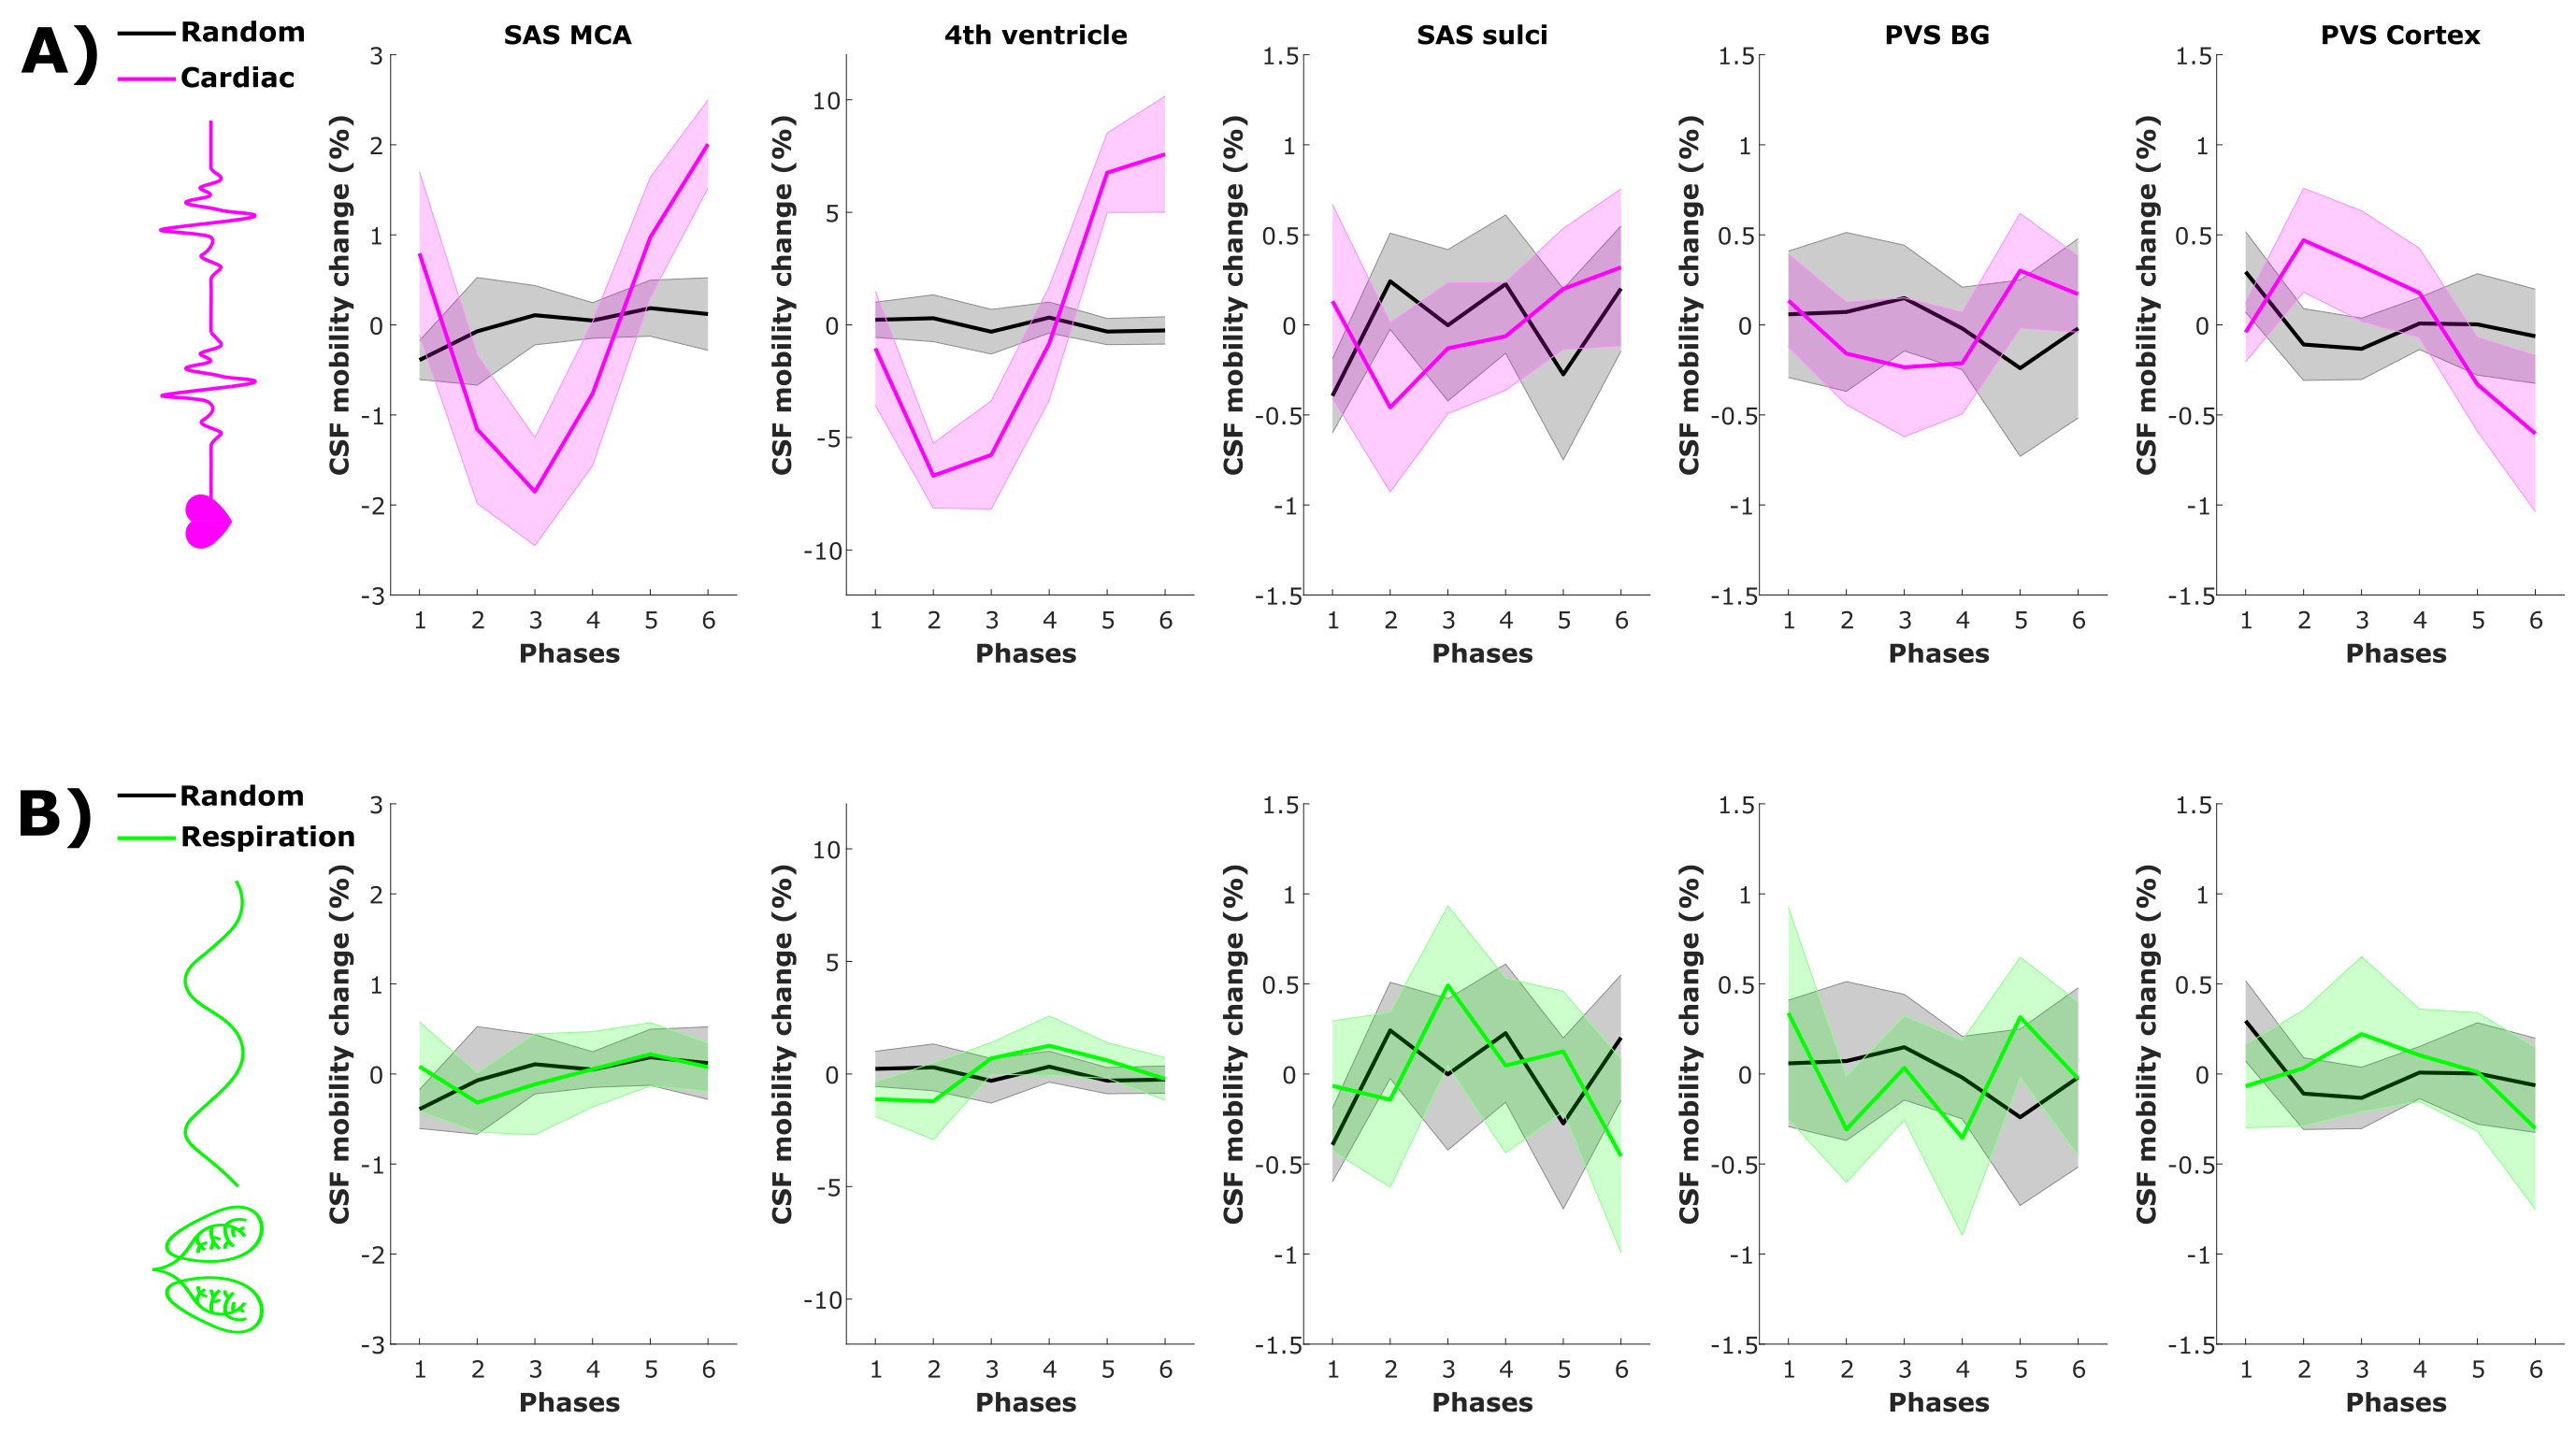
Figure 2: CSF-mobility change from the mean value over phases (in %, mean±1.96*SEM over volunteers) across different driving forces in five regions of interest. CSF-mobility change as a function of (A) the cardiac cycle (pink) and random phases (grey) and of (B) respiration (green) and random (grey) phases.
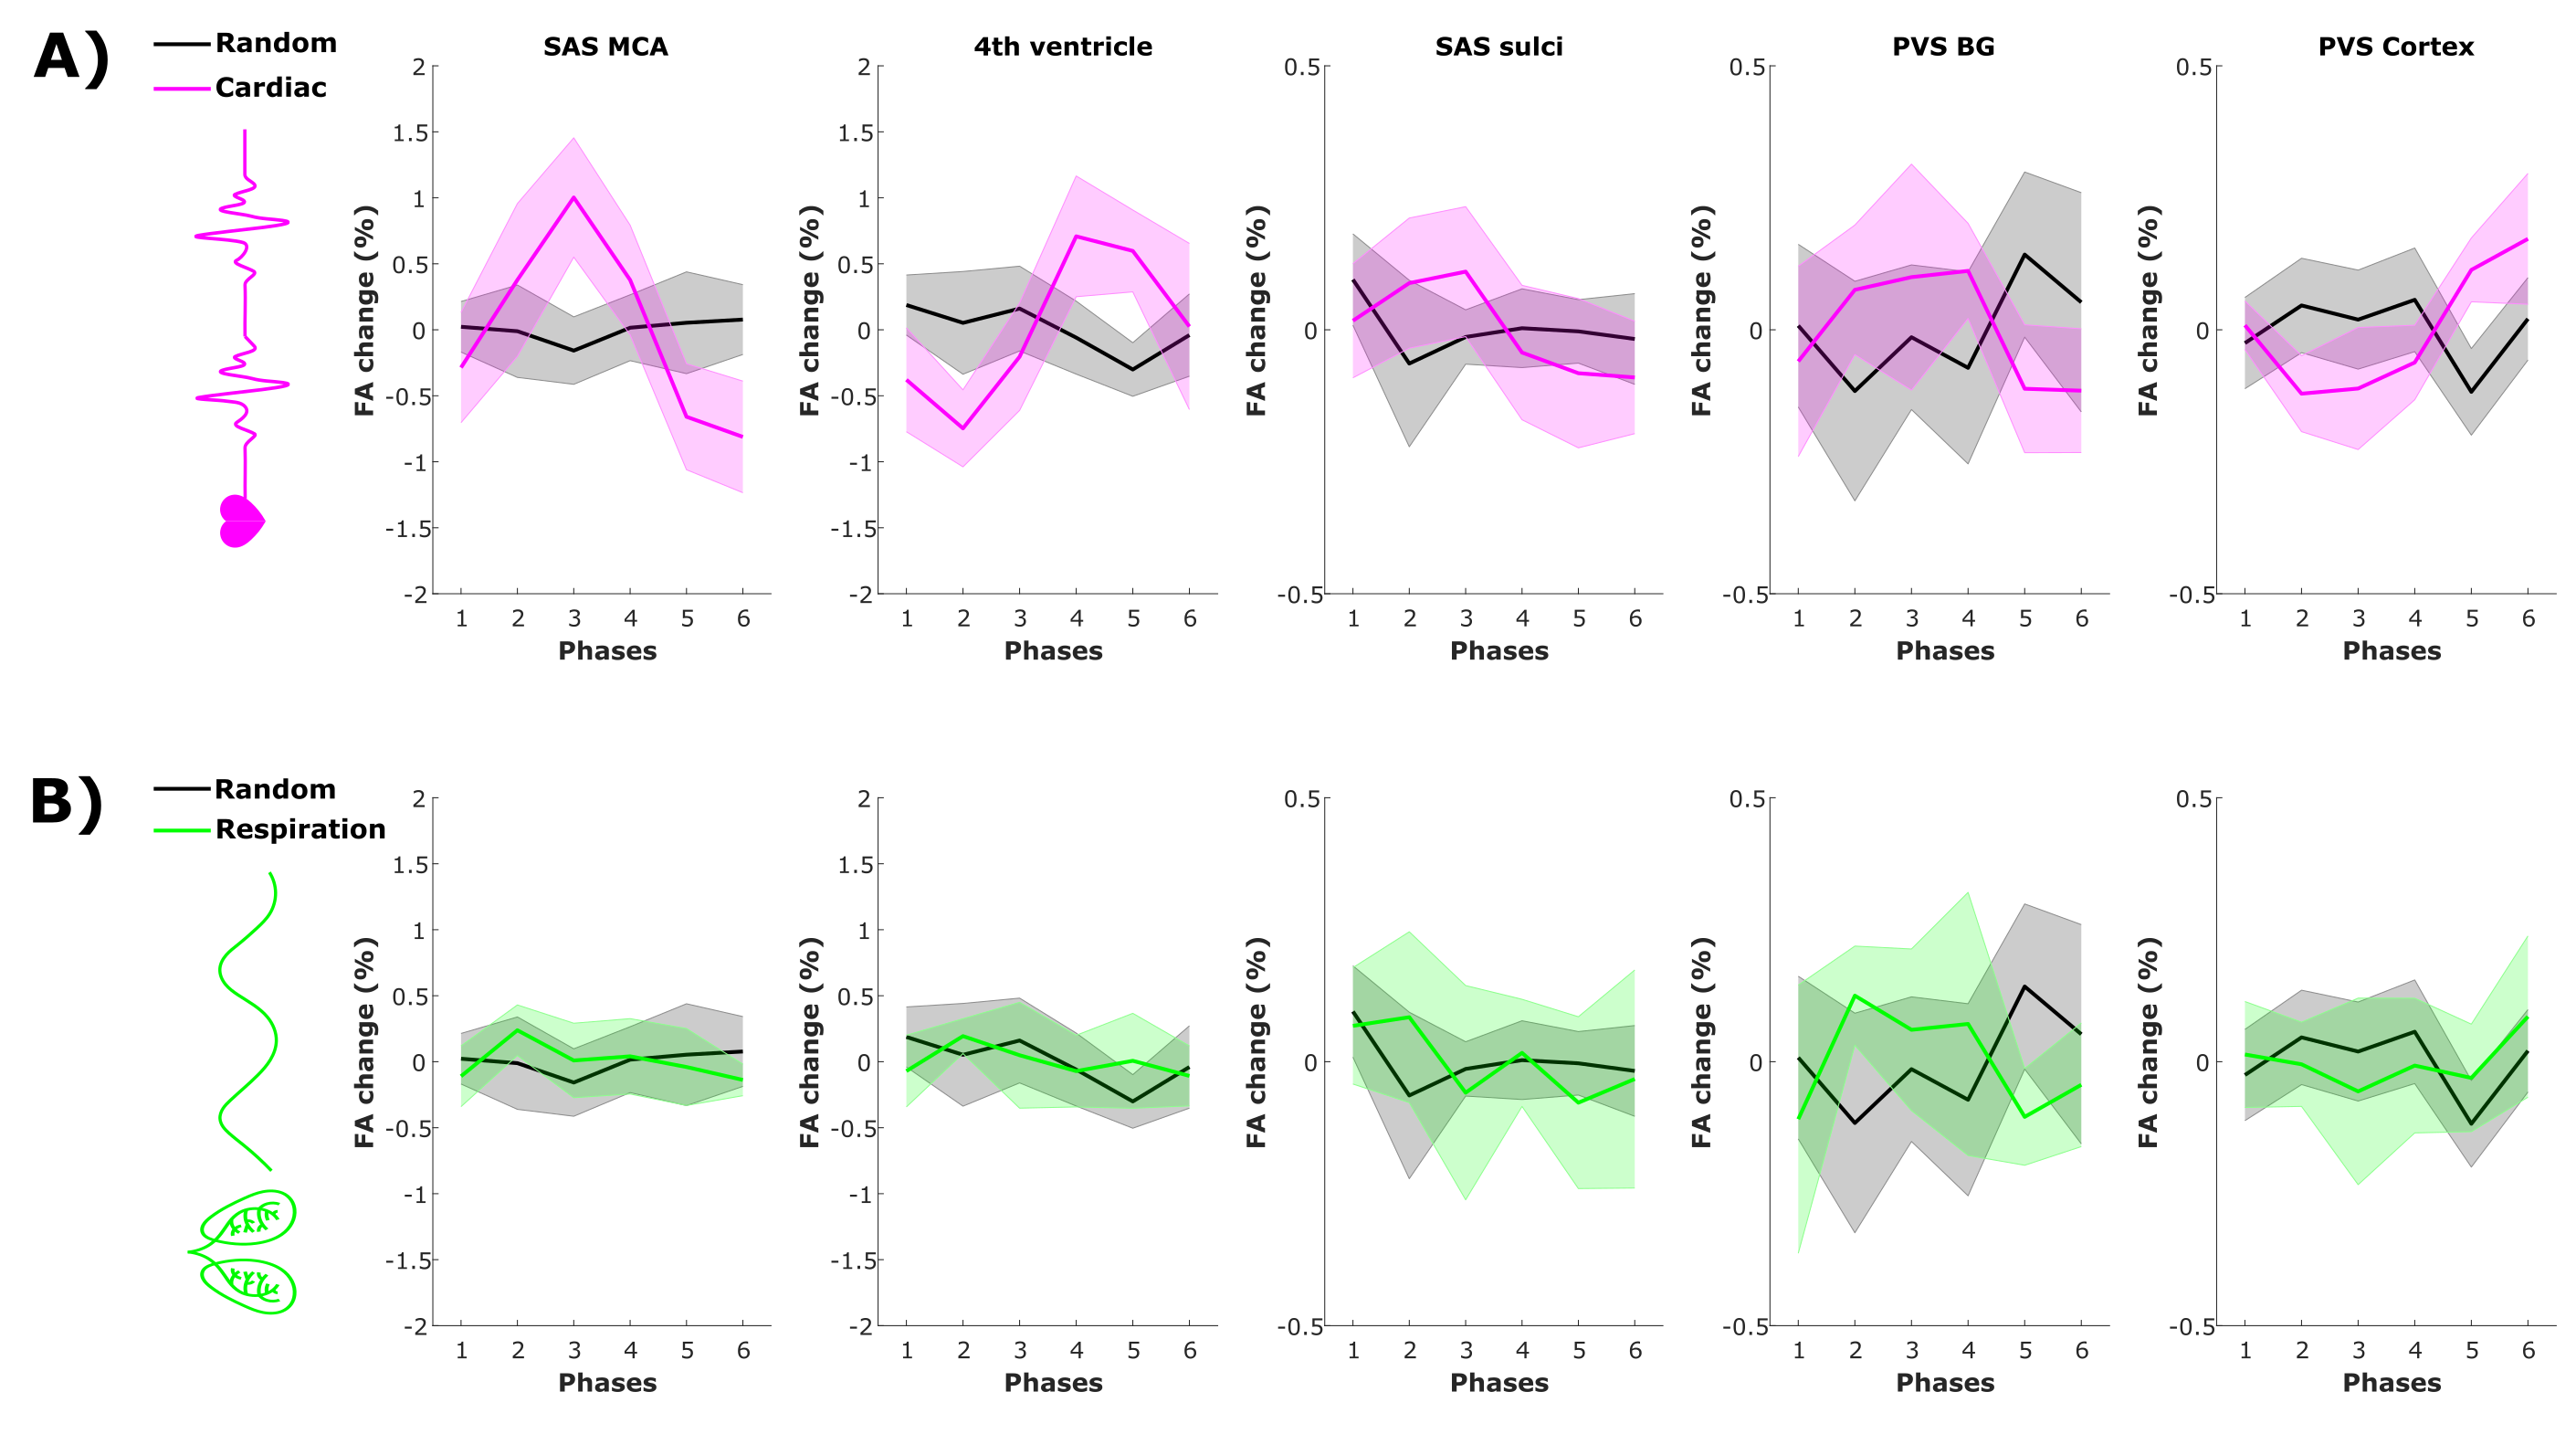
Figure 3: Fractional anisotropy (FA) change from the mean value over phases (in %, mean±1.96*SEM over volunteers) across driving forces in five regions of interest. FA change as a function of (A) the cardiac cycle (pink) and random (grey) phases and of (B) respiration (green) and random (grey) phases.
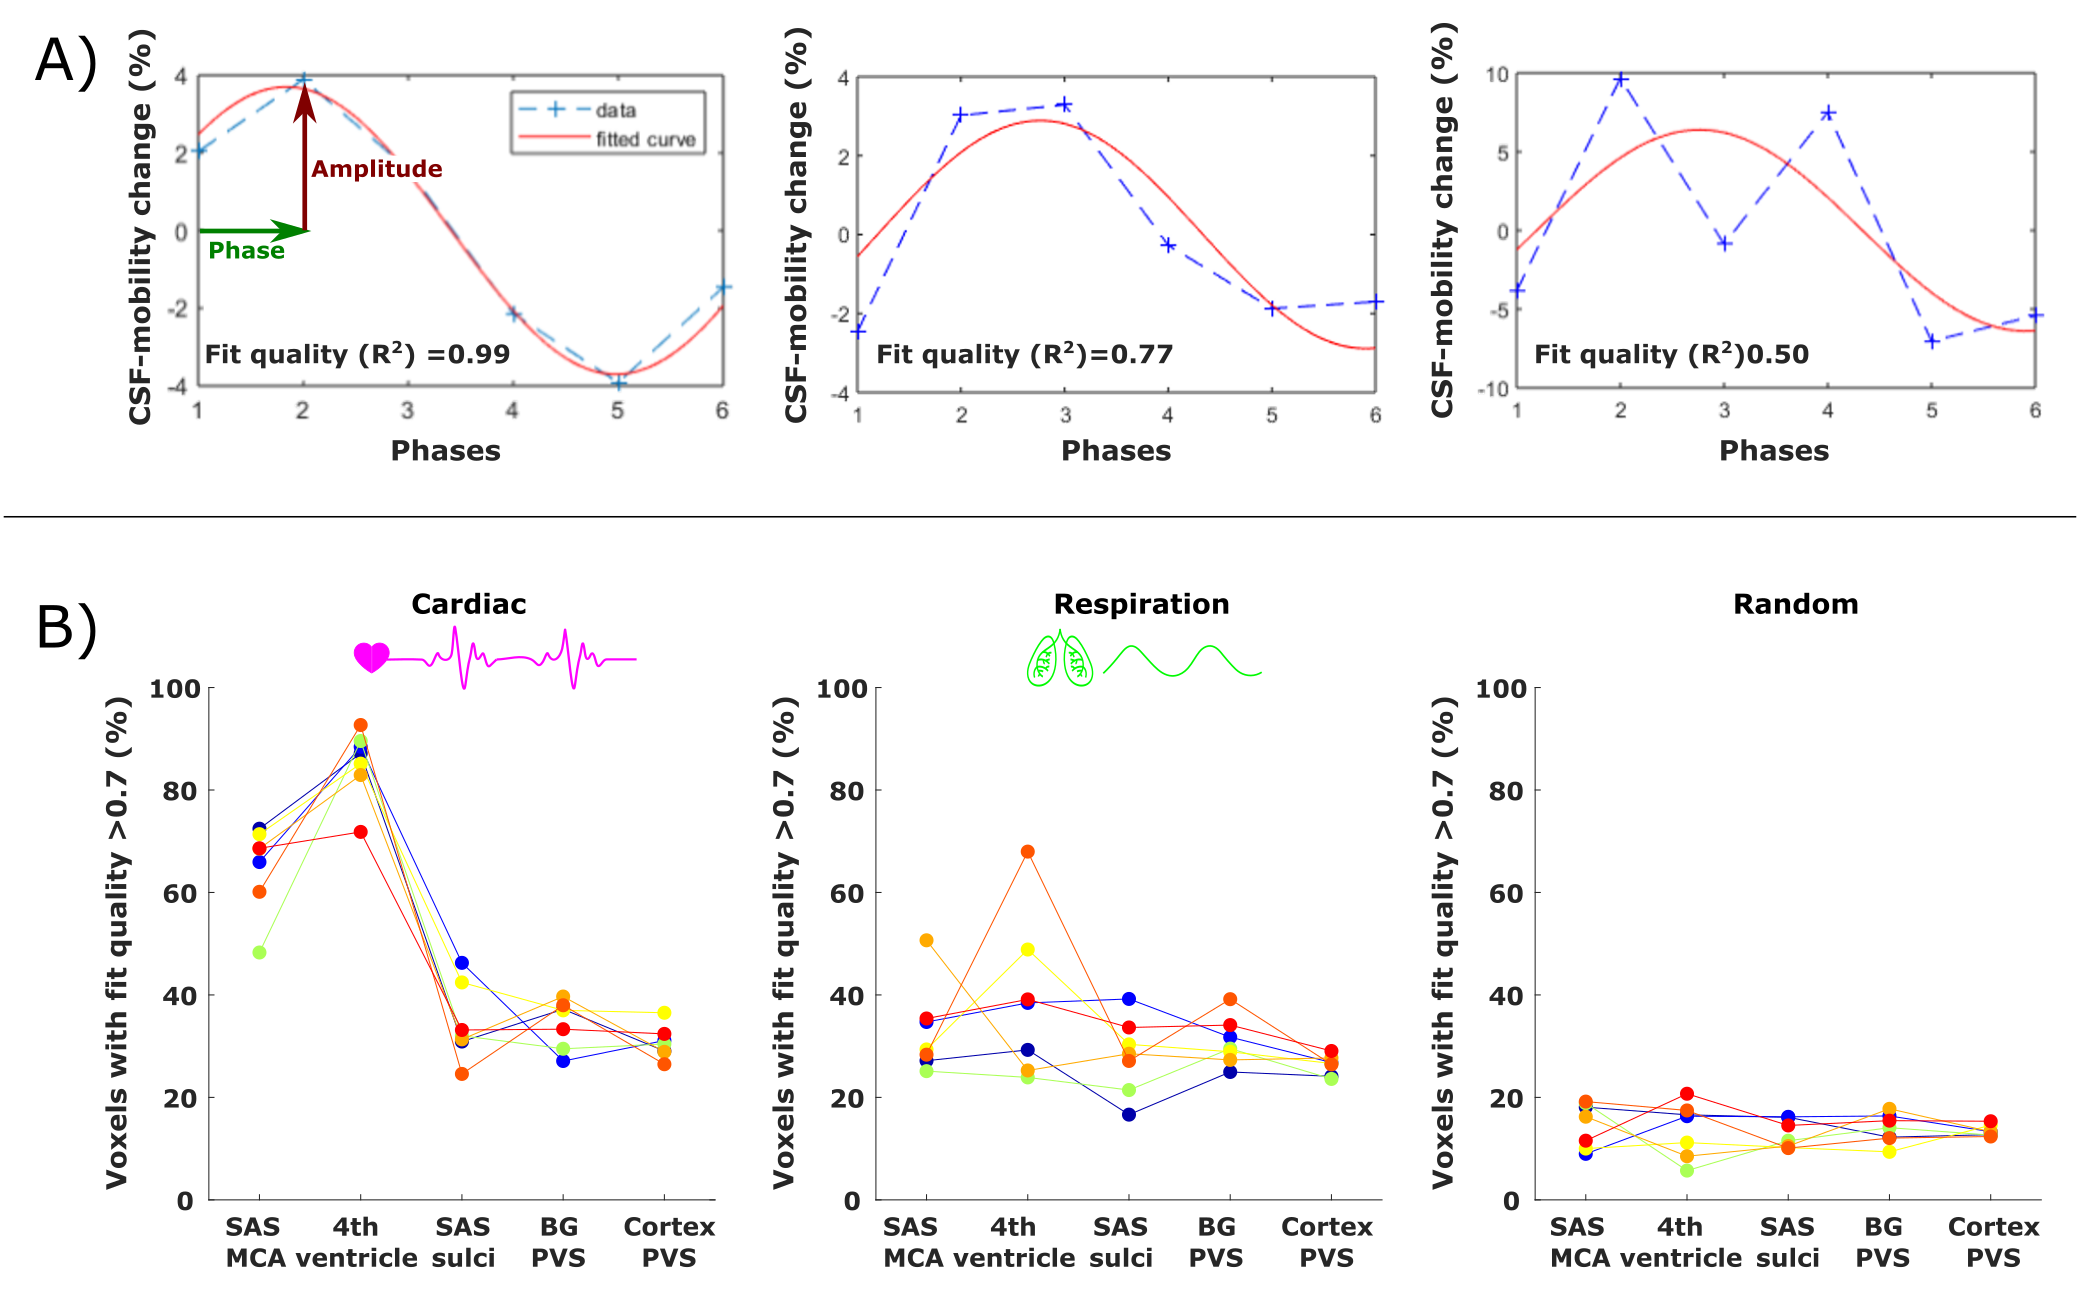
Figure 4: (A) Example of the sinusoidal fit applied (in red) to the signal across phases (dotted blue line) in three different voxels. The associated fit quality is shown in the insert. (B) Percentage of voxels that show a good fit (R2 > 0.7) to the sinusoidal model (relative to the total amount of voxels in the ROI) for the cardiac (left), respiration (middle) and random (right) binning in five ROIs. Every colored line corresponds to the values in one subject.
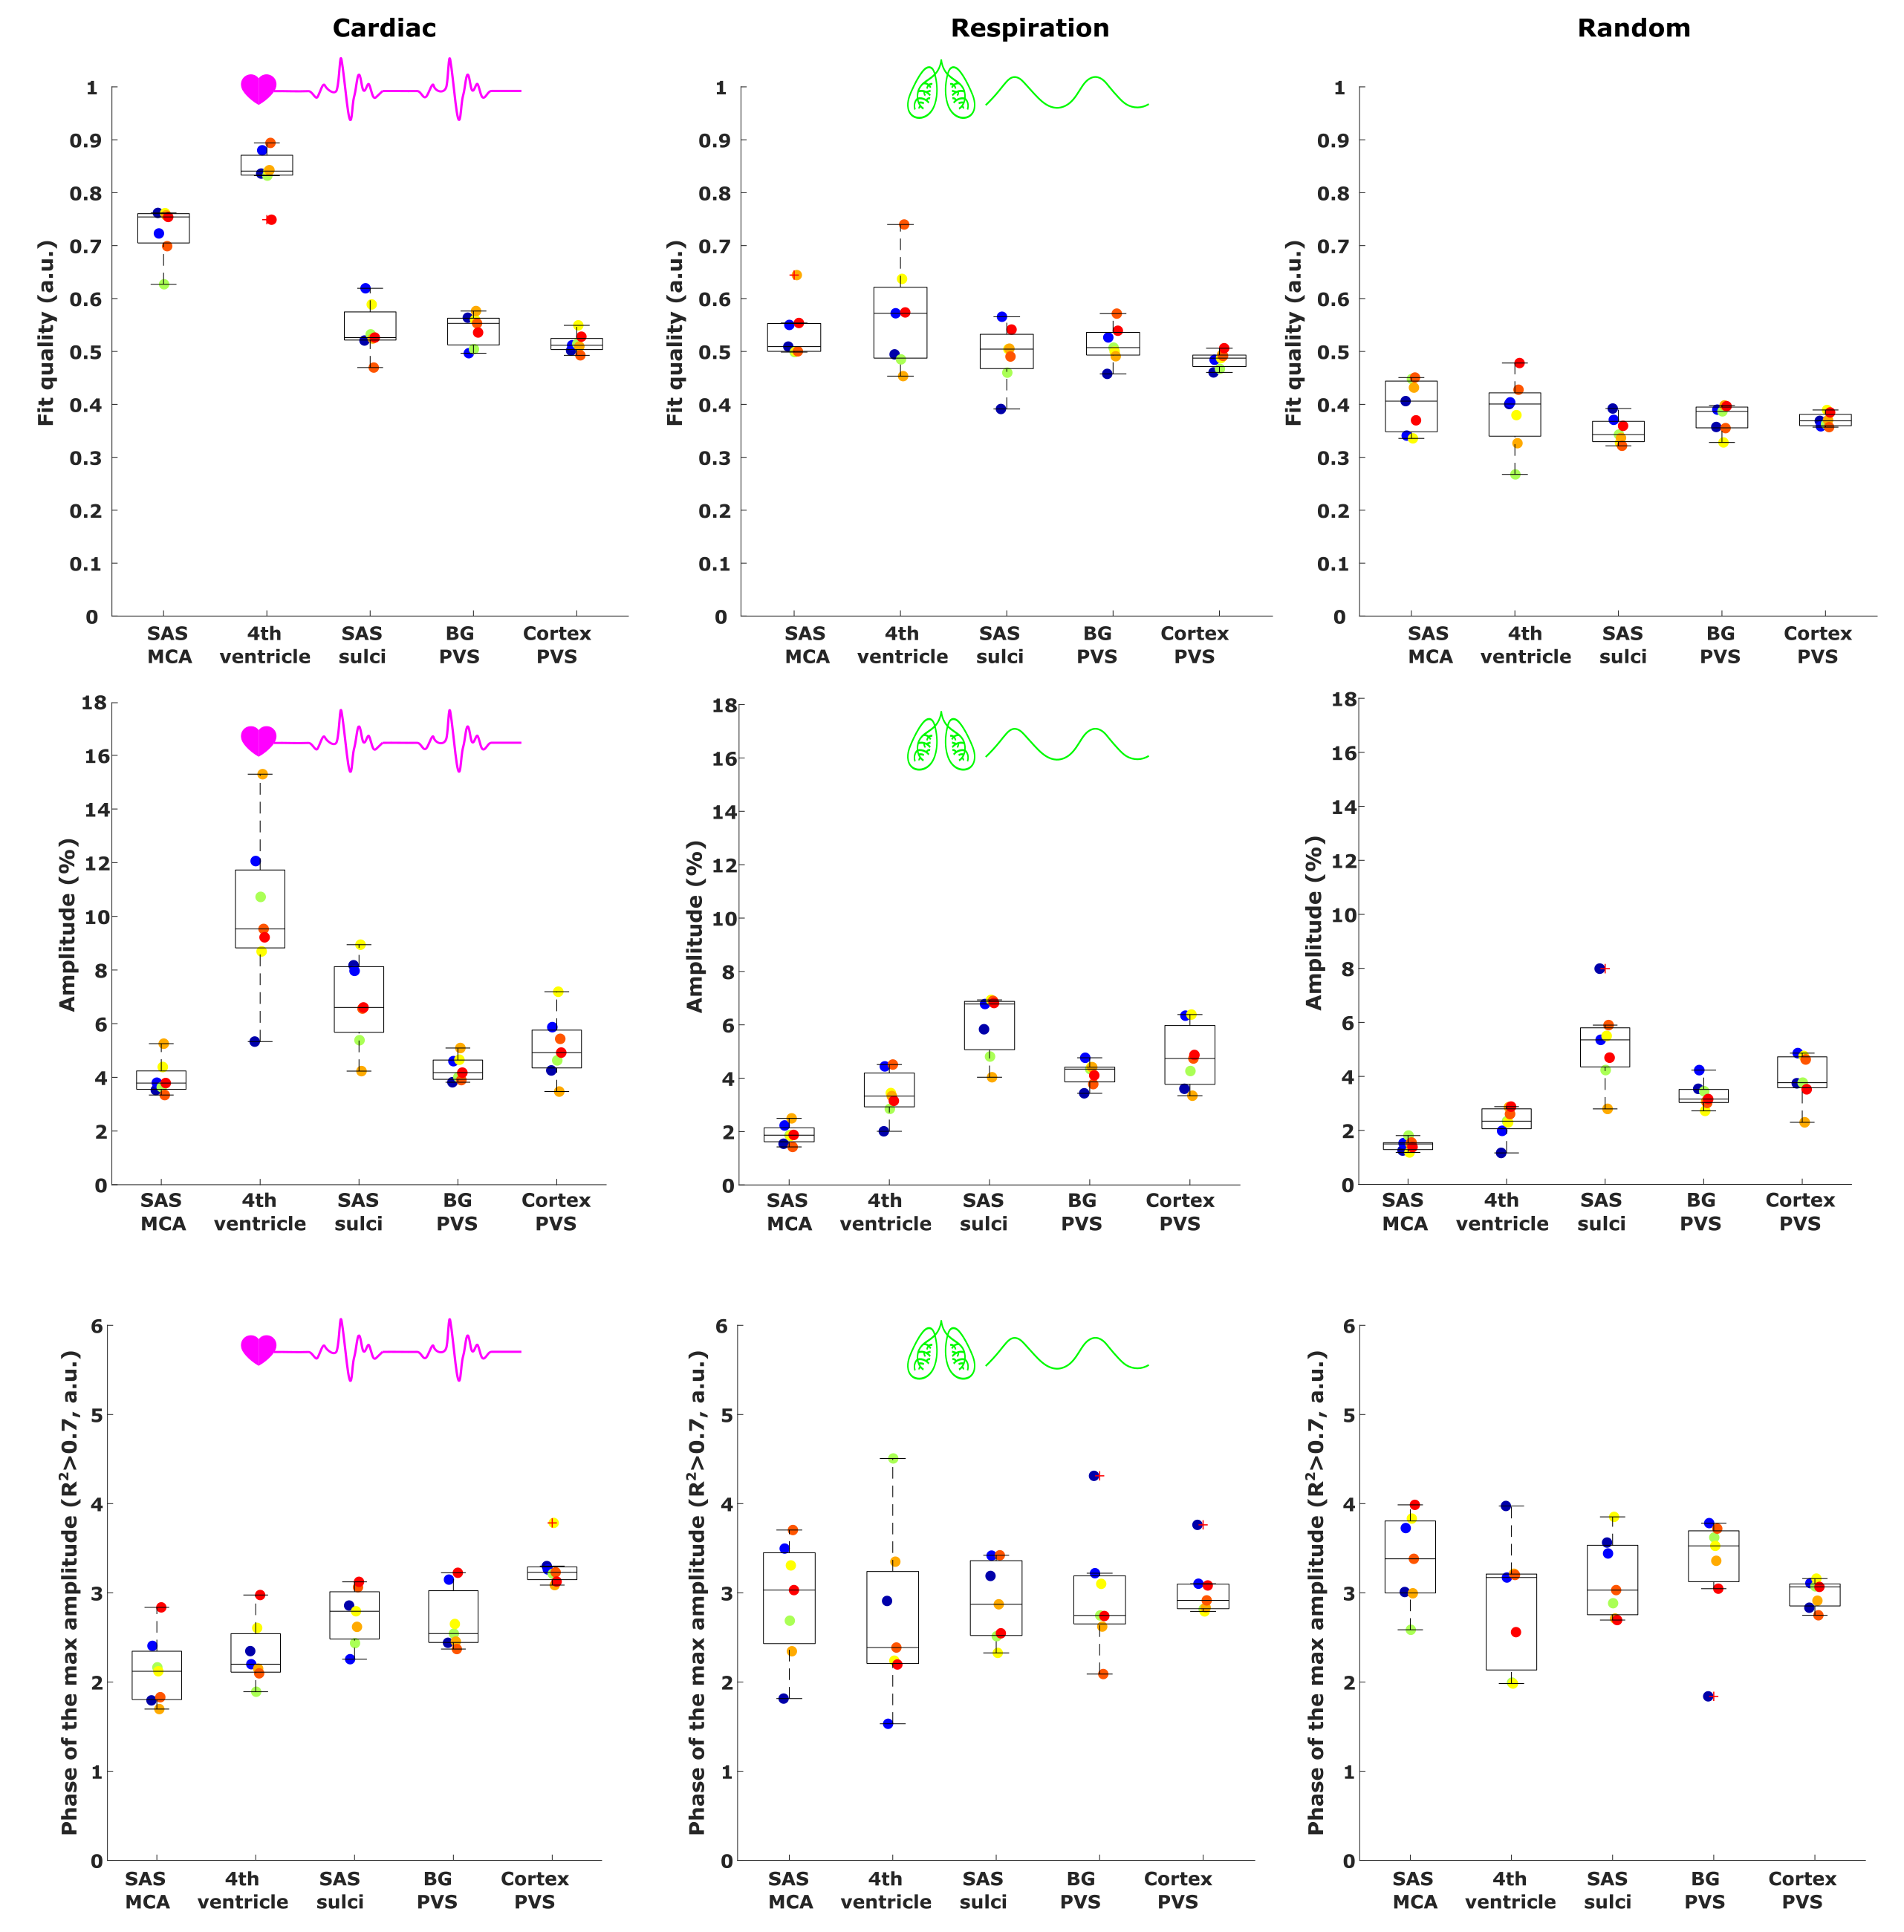
Figure 5: Comparison between the effect of the cardiac (left), respiration (middle) and random (right) binning on the fit output parameters: fit quality (top), amplitude of the maximum (%) (middle) and phase of the maximum CSF-mobility change (bottom) (see Fig.4A). For the phase, only voxels presenting a good fit quality (>0.7) were included. Each colored point represents the value in one subject.