0313
Field-Cycling imaging identifies ischaemic stroke at magnetic field strength below 200 mT1Aberdeen Biomedical Imaging Centre, University of Aberdeen, Aberdeen, United Kingdom, 2Institute of Medical Engineering, Graz University of Technology, Graz, Austria, 3Institute of eHealth, University of Applied Sciences FH JOANNEUM, Graz, Austria, 4BioTechMed-Graz, Graz, Austria, 5Institute of Medical Sciences, University of Aberdeen, Aberdeen, United Kingdom
Synopsis
Field-Cycling imaging (FCI) is a new imaging technique able to image over a range of low magnetic field levels by rapid switching, to explore the variations in T1 relaxation time as a function of the magnetic field strength, known as T1 dispersion. Here we measured the T1 dispersion contrast from patients with ischaemic stroke. The infarct region in T1 maps corresponded to clinical images. T1 dispersions had different profiles between stroke areas and healthy brain areas, showing that ischaemic strokes can be imaged below 200 mT without contrast agents.
Introduction
Computed tomography in acute stroke is a ‘blunt’ tool that gives limited information in early infarction while conventional magnetic resonance imaging is of limited practical use due to access, time and safety issues. New approaches are being explored using low-field devices but stroke contrast in such regime is poorly known. Field-Cycling imaging1,2 (FCI) is a novel modality that can image over a range of magnetic field strengths through rapid switching between magnetic field levels. This allows measurement of the field-dependent changes of the longitudinal T1 relaxation time, known as T1 dispersion. T1 dispersion provides information on molecular dynamics exploiting novel biomarkers that are invisible to conventional MRI. A whole-body field cycling system2 has been developed and approved for clinical studies in Aberdeen, allowing multi-field T1 mapping at any field from 0.2 T to 0.2 mT. Here we report the results of the PUFFINS (Potential Use of Fast Filed Cycling MRI IN Stroke) study that aims to assess whether FCI can identify sub-acute strokes.Methods
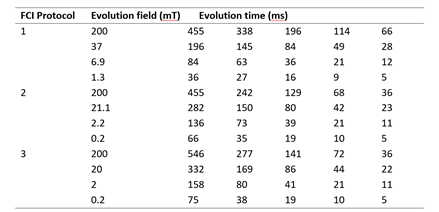
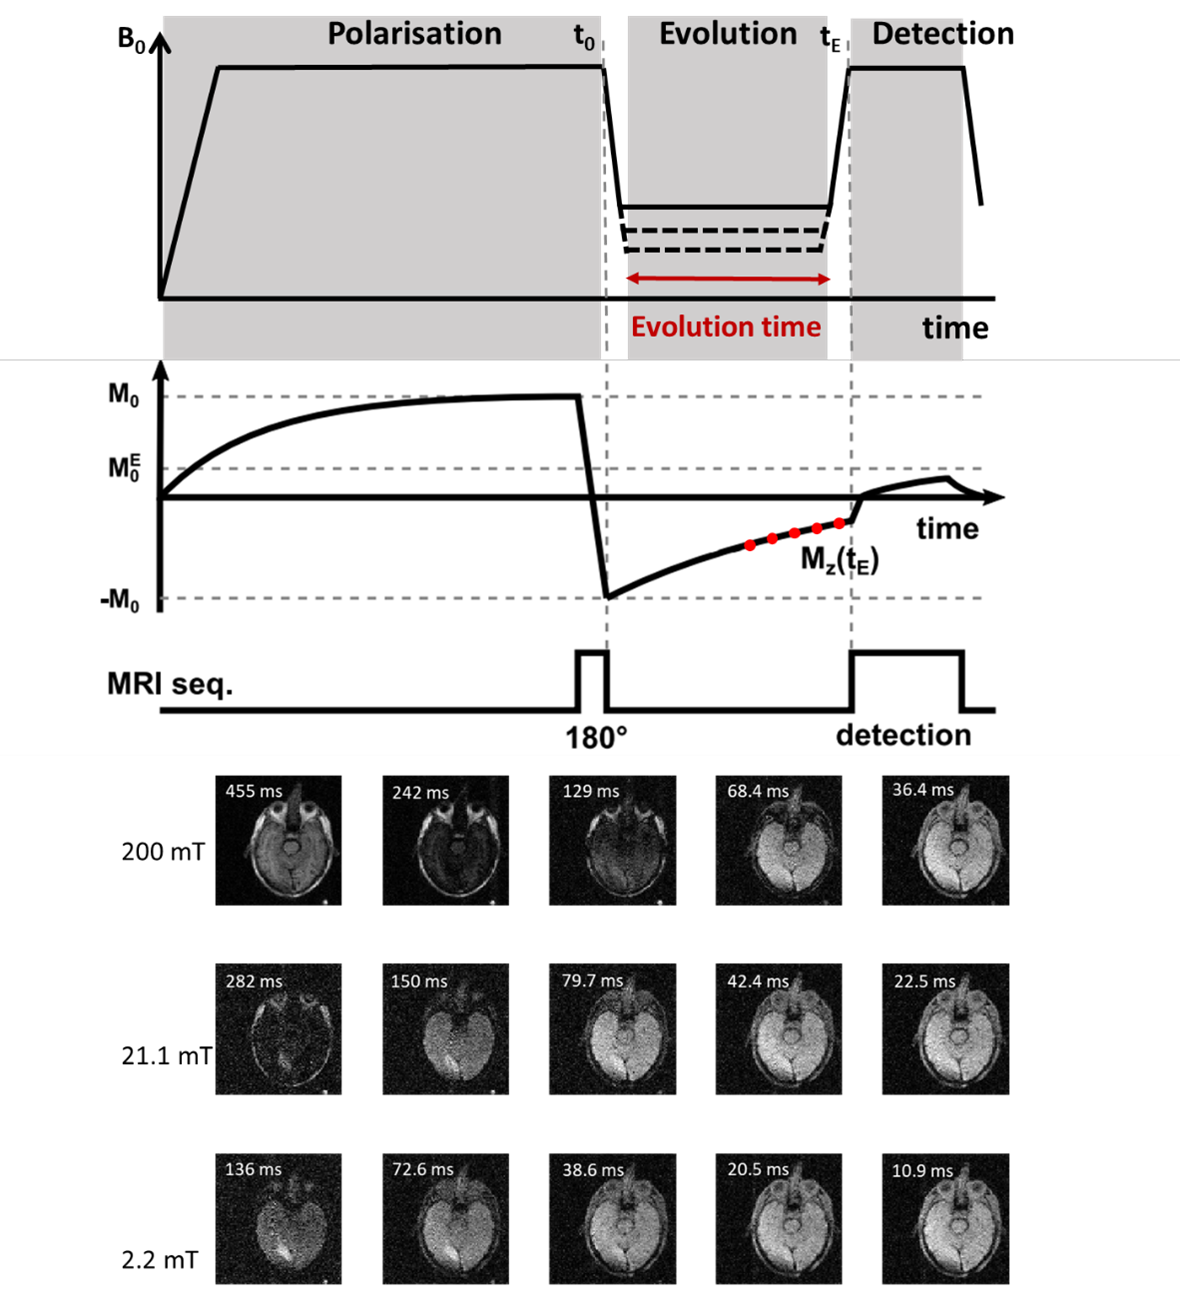
35 patients gave informed consent to participate in the PUFFINS study from 02/2018 to 06/2021 (ethics approved by NoSREC, number 16/NS/0136). Patients admitted with ischaemic stroke were scanned on the whole-body FCI system within 24 to 96 h after presentation, with a second scan 30 days later. Duration of the FCI examination was 45 minutes, including setup, axial and sagittal scout images and FCI images. FCI images were acquired using a field-cycled inversion recovery spin echo sequence (Figure 1) with four to six evolution fields typically ranging from 0.2 T to 0.2 mT, five evolution times (see Table 1), in-plane resolution of 2 to 4 mm, FOV of 290 mm, slice thickness of 10 mm, TE of 16 to 24 ms, one slice and no averaging. As part of their treatment, patients had a clinical CT scan, some with a 3T MRI scan, acquired within 24 hours of the FCI images that we used for comparison.Post-processing was done in Matlab (Mathworks, 2019a, Natick, USA) using in-house software3. Multi-field T1 quantification was performed in Python using a joint total generalised variation (TGV) regularisation in conjunction with an iteratively regularised Gauss-Newton approach4,5. T1 dispersions were extracted from three ROIs selected manually over grey matter, white matter and infarct regions, using the clinical CT and MRI images for validation. The stroke-to-brain T1 contrast across evolution fields was calculated as6
C = (T1stroke-T1normal)/T1normal
where T1stroke is the T1 value of the infarct region and T1normal is the mean T1 value of white and grey matter.
Results
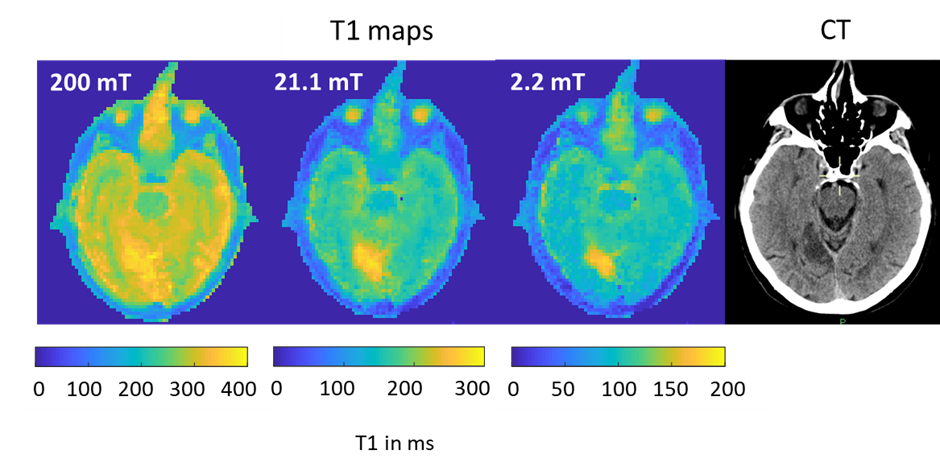
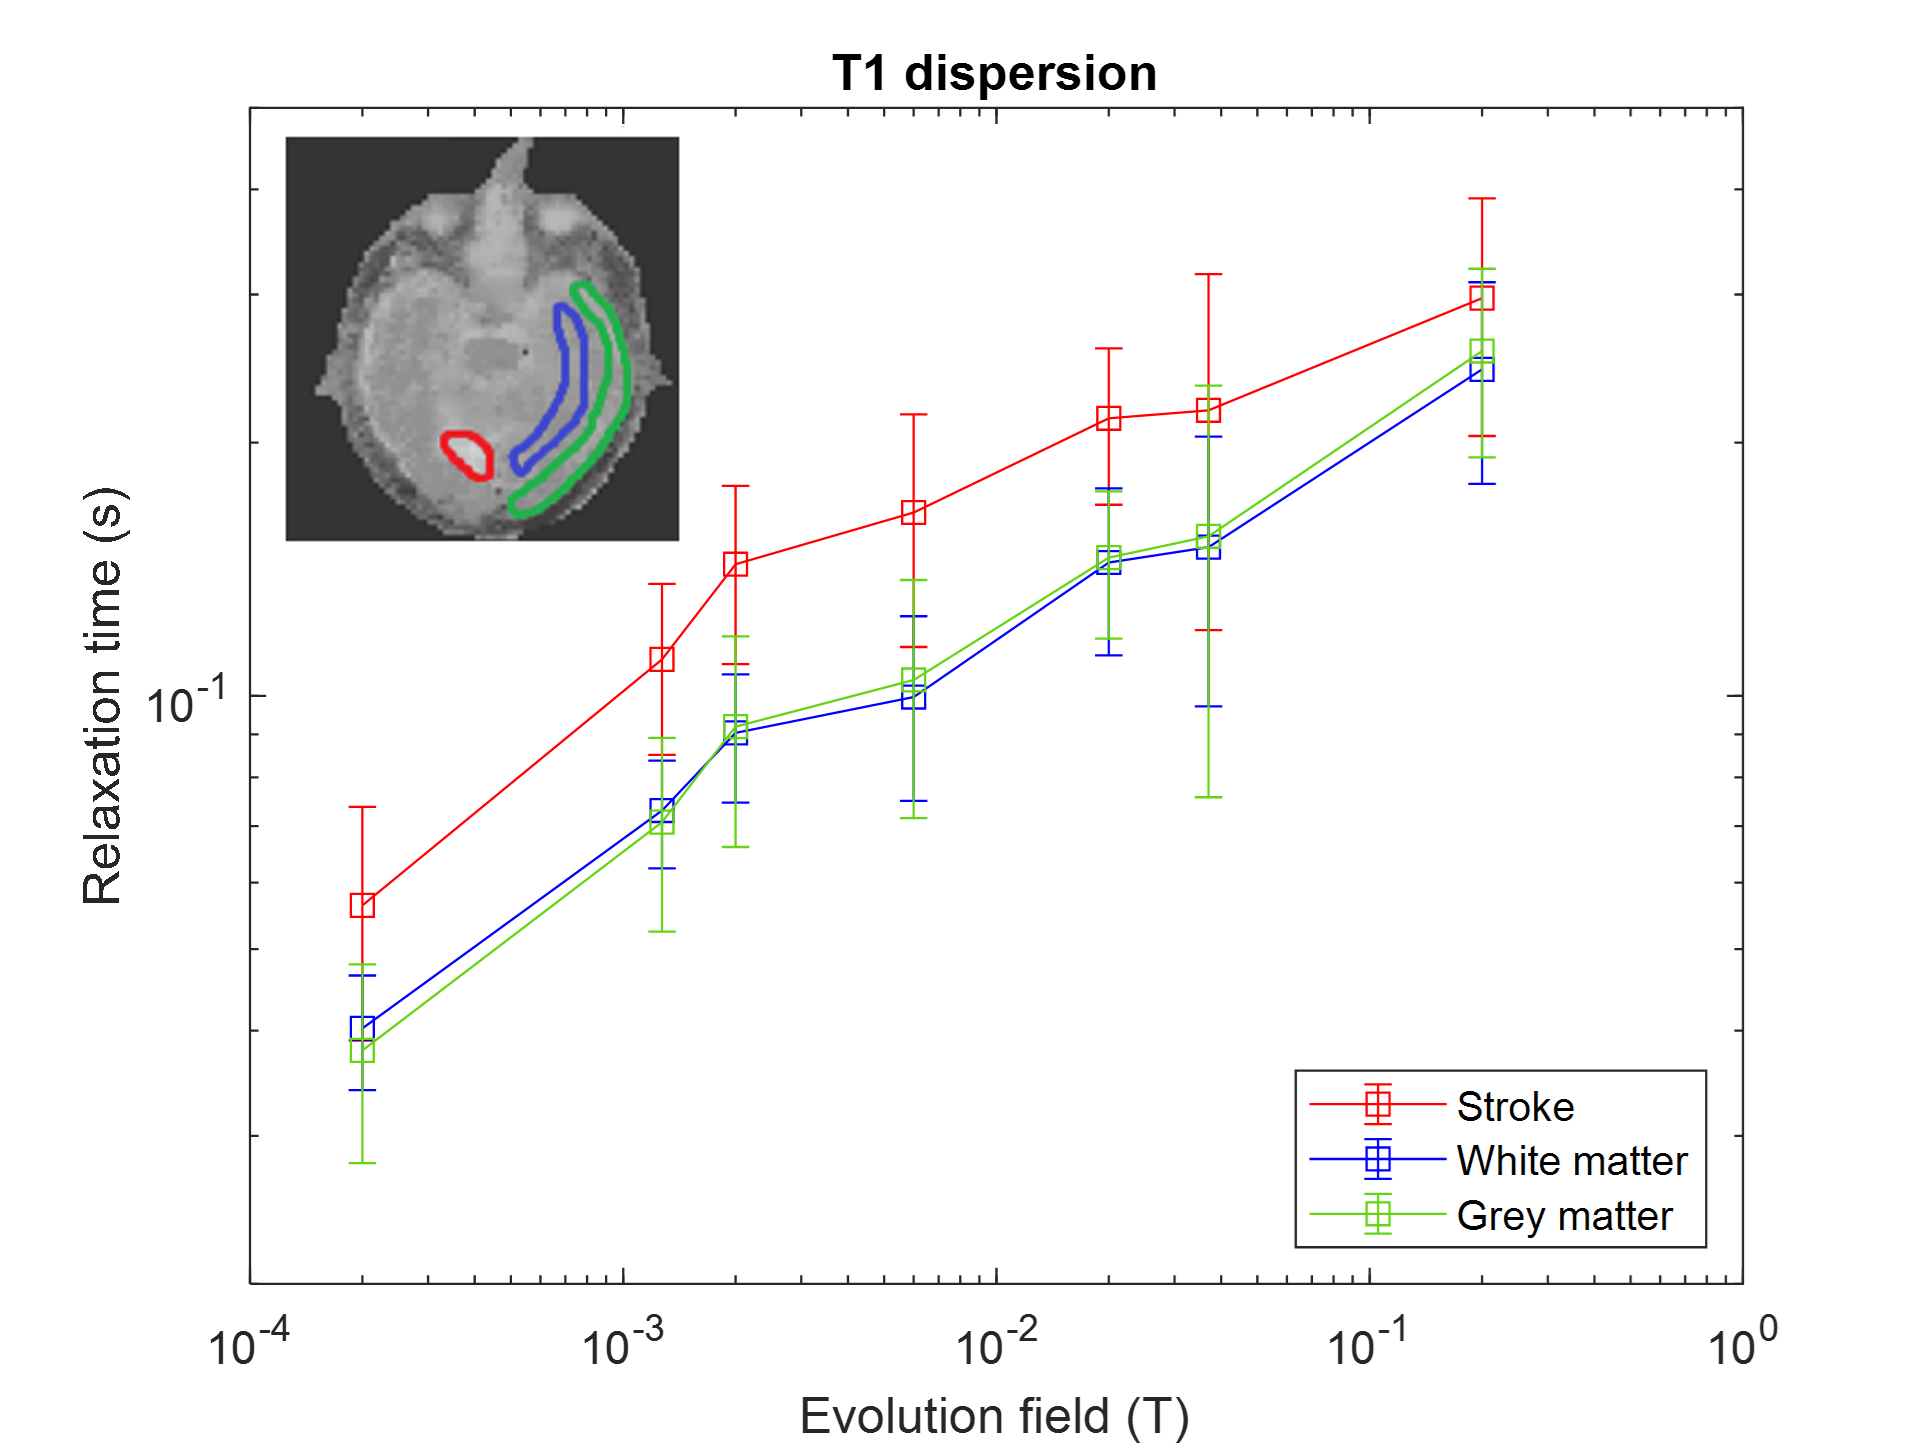
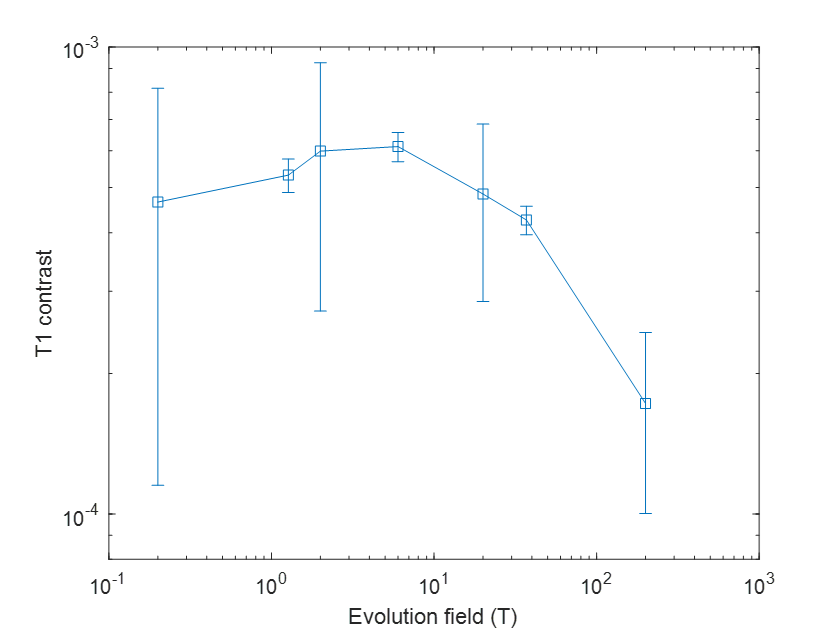
Ten FCI scans were included in the study from eight patients. Five patients did not complete the scan due to claustrophobia and/or unsuitable body habitus, while in fifteen patients there were technical issues. In five patients the single-slice scan missed small areas of infarction. Four patients completed both scans but only two follow up scans were included due to technical issues. The infarct region measured by T1 maps corresponded with the CT and 3T MRI images, when available (Figure 2). The T1 maps exhibited visible T1 contrast below 200 mT (Figure 2). The in-vivo T1 dispersion profiles obtained from the T1 images showed profiles for the stroke area that differed from other brain tissues in the low-field regime (below 200 mT) (Figure 3). The T1 contrast increased markedly as the evolution magnetic strength field decreased, reaching a maximum at 2 to 6 mT (Figure 4).Discussion
This is the first-ever measurement of T1 dispersion in patients with ischaemic stroke. The results showed that significant contrast is available below 200 mT in patients with stroke, which discriminates between healthy and ischaemic brain regions but also shows the limitations in T1 contrast at 200 mT. These changes may reflect modifications of water diffusion across cell membranes due to cellular adaptation or death7.Conclusions
We have demonstrated the potential of low fields in ischaemic stroke and created a new tool to understand the pathophysiology of diseases, in vivo. We hope these results will help to better understand disease mechanisms in stroke and to guide the design process of dedicated low-field devices. This first ever FCI in vivo clinical study greatly helped us to improve the technology and we are currently starting the second stage of the PUFFINS study to explore potential biomarkers in FCI for the differentiation of stroke types and mimics.Acknowledgements
This project has received funding from the European Union’s Horizon 2020 research and innovation programme under grant agreement No 668119 (project “IDentIFY”). We acknowledge the support of the Scottish Stroke Research Network and Chief Scientist Office (CSO).References
1. Lurie, D. J. et al. Fast field-cycling magnetic resonance imaging. Cr Phys. 2010;11, 136-148.
2. Broche LM, Ross PJ, Davies GR, MacLeod MJ, Lurie DJ. A whole-body Fast Field-Cycling scanner for clinical molecular imaging studies. Sci. Rep. 2019;9(1):10402.
3. Broche LM, Ross PJ, Davies GR, Lurie DJ. Simple algorithm for the correction of MRI image artefacts due to random phase fluctuations. Magn. Reson. Imaging. 2017;44:55-59.
4. Bödenler M, Maier O, Stollberger R, Broche LM, Ross PJ, MacLeod MJ, Scharfetter H. Joint multi-field T1 quantification for fast field-cycling MRI. Magn. Reson. Med. 2021; 86:2049–2063.
5. Maier O, Spann SM, Bödenler M, Stollberger R. PyQMRI: An accelerated Python based Quantitative MRI toolbox. Open Source Softw. 2020;5: 2727.
6. Edelman R, Leloudas N, Pang J, Bailes J, Merrell R, Koktzoglou I. Twofold improved tumor-to-brain contrast using a novel T1 relaxation-enhanced steady-state (T1RESS) MRI technique. Sci Adv. 2020; 28:6(44):eabd1635.
7. Ruggiero MR, Baroni S, Pezzana S, Ferrante G, Geninatti Crich S, Aime S. Evidence for the Role of Intracellular Water Lifetime as a Tumour Biomarker Obtained by In Vivo Field-Cycling Relaxometry. Angew Chem Int Ed Engl. 2018;57(25):7468-7472.
Figures