0312
Assessing potential correlation between T2 relaxation and diffusion of brain lactate1Université Paris-Saclay, CEA, CNRS, MIRCen, Laboratoire des Maladies Neurodégénératives, Fontenay aux Roses, France
Synopsis
Little or no correlation exists between diffusion and T2 relaxation of intracellular brain metabolites, as measured by MRS. However, for lactate, which is both intracellular and extracellular, some correlation might exist, which would be crucial to interpret lactate diffusion. Using a frequency-selective diffusion-weighted (DW) MRS sequence that removes J-modulation on the lactate peak at 1.3 ppm, thus preserving lactate signal even at long TE, we investigated the effect of echo time TE on lactate diffusion-weighted attenuation, for TE between 50.9 and 110.9 ms. It appears that the effect of TE on the apparent diffusivity and kurtosis is negligible.
Introduction
Diffusion-weighted magnetic resonance (DW-MRS) spectroscopy is sensitive to the microstructure of the environment where metabolites are diffusing1. In parallel, microstructure and diffusion also influence relaxation time T2. Hence, some correlation may exist between diffusion and T2 relaxation in biological tissues. The effect of increasing TE on DW-signal attenuation of intracellular metabolites (e.g. NAA, total creatine…) has already been investigated in the mouse brain, showing no (or very limited) effect between TE=33.4 ms and 73.4 ms 2. Situation might be different for lactate, which is present in both intracellular and extracellular space3, two compartments likely exhibiting different diffusion properties4, and where T2 might also be different. This is an important point in the perspective of modeling DW-MRS data to determine to what extent lactate is present in the different compartments5,6 (e.g. this would weight signal contribution of each compartment according to T2). However, this question has been eluded so far, due to the difficulty to measure lactate diffusion.Here, we use a frequency-selective spin echo DW-MRS sequence7, where TE can be varied without inducing J-modulation on the CH3 lactate peak, thus allowing to retain signal even at long TE. With this approach, we are able to show that TE does not influence lactate diffusion for TE ranging from 50 to 110 ms.
Method
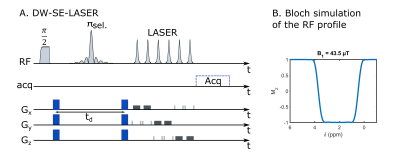
Six anesthetized mice were scanned in a Bruker Scanner at 11.7 T equipped with a cryoprobe. The isoflurane level varied from 1.4 % to 1.7 % between animals, but was kept constant throughout the experiment for each animal. The attenuation of N-acetylaspartate + N-acetylaspartylglutamate (tNAA), choline compounds (tCho), creatine + phosphocreatine (tCr), taurine (Tau), myo-inositol (Ins) and lactate (Lac) were measured in a 13.2-µL voxel centered in the striatum, for diffusion-weightings b=[0.02,1.2,3.02,6,10] ms/µm2, at different echo times TE=[50.9,66.9,86.9,110.9] ms while keeping the diffusion time constant (td=20 ms). Diffusion gradients duration was set to 3.6 ms. Two sets of 32 repetitions were acquired with a frequency-selective diffusion-weighted spin-echo sequence followed by LASER localization (figure 1A). The single-band pi-pulse (SB) used in the DW-spin-echo block was generated with the Shinnar-Leroux algorithm to refocus the 0.1-4.0 ppm range (figure 1B), thus avoiding refocusing the 4.1-ppm CH lactate group coupled to the 1.3-ppm CH3, resulting in suppression of J-modulation. The diffusion gradient direction was changed at each repetition to perform powder-averaging. Individual scans were frequency- and phased-corrected before averaging, and spectra were analyzed with LCModel8. Experimental MM spectra acquired for each TE were included in LCModel basis-sets. Attenuations were fitted to estimate the average diffusivity and average kurtosis given by 9:$$$S(b)=S(b=0)exp(-bD_{app}+\frac{1}{6}K_{app}(bD_{app})^2)$$$
with Dapp the apparent diffusivity and Kapp the apparent kurtosis.
Results and discussion
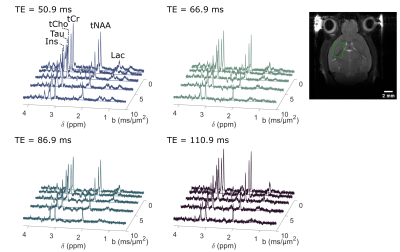
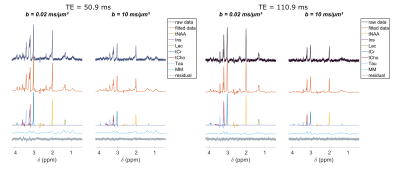
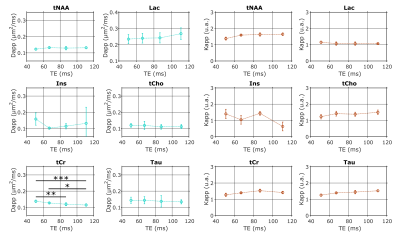
The frequency-selective spin echo sequence allows measuring lactate peak without J-modulation, regardless of TE. We observe (figure 2) that the lactate peak is clearly visible in the raw data even at long TE and for the largest b-value. Such lactate signal allows an acceptable LCModel estimation (figure 3) with an average CRLB of less than 9 % in the worst condition (b=10 ms/µm² and TE=110.9 ms). The selective SE sequence therefore appears to be decisive in the context of this study. Nevertheless, the Ins peak is quite low due to its location on the edges of the SB selection band, resulting in relatively large quantification errors. The average signal attenuation for lactate (as well as for the other metabolites) reveals no variation when increasing TE (figure 4).Dapp and Kapp (figure 5) exhibit no significant change (calculated with a repeated measures ANOVA) when increasing TE in the 50-110 ms range for almost all metabolites, except for tCr which exhibits slightly decreasing Dapp. For intracellular metabolites, Dapp is around 0.15 µm²/ms at all TE, while Kapp remains fairly constant around 1.5. The kurtosis is also constant around 1.5 whatever the echo time and for almost all metabolites. For lactate, the diffusivity is higher and constant around 0.25 µm²/ms, while the kurtosis is slightly lower (around 1.3) than for the other metabolites, suggesting an impact of the extracellular compartment, but no T2 effect is observed on these diffusion parameters. Hence, in grey matter, for TE ranging from 50 to 110 ms, no significant correlation between T2 relaxation and lactate diffusion is observed, as for almost all intracellular metabolites. Therefore, when interpreting lactate diffusion, it seems legitimate to consider only the diffusion properties within the different compartments where lactate is located, without considering potential T2 differences. The small decrease in tCr apparent diffusivity remains of unclear origin. Nevertheless the constant Dapp for the other metabolites is consistent with the literature2.
Conclusion
Using a frequency-selective DW-SE sequence, no effect of T2 was observed on lactate diffusion for TE ranging from 50 to 110 ms. This suggests that lactate diffusion might be modeled by considering only the diffusion properties of the different compartments and the fraction of lactate in each compartment (as well as potential inter-compartment exchange), without accounting for relaxation effects.Acknowledgements
This project has received funding from the European Research Council (ERC) under the European Union’s Horizon 2020 research and innovation programmes (grant agreement No 818266).References
1. Ronen, I. & Valette, J. Diffusion-Weighted Magnetic Resonance Spectroscopy. in eMagRes 733–750 (American Cancer Society, 2015). doi:10.1002/9780470034590.emrstm1471.
2. Ligneul, C., Palombo, M. & Valette, J. Metabolite diffusion up to very high b in the mouse brain in vivo: Revisiting the potential correlation between relaxation and diffusion properties. Magnetic Resonance in Medicine 77, 1390–1398 (2017).
3. Mächler, P. et al. In Vivo Evidence for a Lactate Gradient from Astrocytes to Neurons. Cell Metabolism 23, 94–102 (2016).
4. Vincent, M. et al. Characterizing extracellular diffusion properties using diffusion-weighted MRS of sucrose injected in mouse brain. NMR in Biomedicine 34, e4478 (2021).
5. Pfeuffer, J., Tkác, I. & Gruetter, R. Extracellular-intracellular distribution of glucose and lactate in the rat brain assessed noninvasively by diffusion-weighted 1H nuclear magnetic resonance spectroscopy in vivo. J Cereb Blood Flow Metab 20, 736–746 (2000).
6. Ligneul, C. et al. Diffusion-weighted magnetic resonance spectroscopy enables cell-specific monitoring of astrocyte reactivity in vivo. NeuroImage 191, 457–469 (2019).
7. Mougel, E., Malaquin, Vincent, M. & Valette, J. Using selective RF pulses in diffusion-weighted MRS for lactate diffusion measurements with minimal J-modulation. in Proc. Intl. Soc. Mag. Reson. Med. 29 0286 (2021).
8. Provencher, S. W. Automatic quantitation of localized in vivo 1H spectra with LCModel. NMR in Biomedicine 14, 260–264 (2001).
9. Jensen, J. H. & Helpern, J. A. Quantifying Non-Gaussian Water Diffusion by Means of Pulsed-Field-Gradient MRI. in Proc. Intl. Soc. Mag. Reson. Med. 13 1 (2003).
Figures


