0311
Multi-Parametric Single-Shot Magnetic Resonance Spectroscopy for Fast Metabolite-Specific Concentration and T2 Determination
Rudy Rizzo1,2 and Roland Kreis1,2
1Magnetic Resonance Methodology, Institute of Diagnostic and Interventional Neuroradiology, University of Bern, Bern, Switzerland, 2Translational Imaging Center, sitem-insel, Bern, Switzerland
1Magnetic Resonance Methodology, Institute of Diagnostic and Interventional Neuroradiology, University of Bern, Bern, Switzerland, 2Translational Imaging Center, sitem-insel, Bern, Switzerland
Synopsis
Multi-Echo Single-Shot (MESS) spectroscopy is tested in-vivo aiming at simultaneous determination of metabolite content and T2 times through simultaneous multi-parametric model fitting of partially sampled echoes. Cramer-Rao Lower Bounds (CRLBs) are used as measure of performances. The novel scheme was compared with the traditional Multi-Echo Multi-Shot (MEMS) method. Results confirmed former in-silico studies and indicate that MESS outperforms MEMS for simultaneous determinations of T2s and concentrations, with improvements ranging from 5-20% for T2s and 10-50% for concentrations.
Introduction
Clinical MRS usually lacks subject-specific relaxation times for full individual quantification. Methods for a comprehensive evaluation of concentrations and relaxation times (and macromolecular background) have been proposed that are based on combined evaluations of multiple different acquisitions (e.g. different TE, TR or inversion times)1-5, but given the additional scan time needed, are not in widespread use. Multi-echo data from a single acquisition – where a CPMG sequence can be used to prolong the range of high SNR to longer acquisition times – can be used as alternative, though at the expense of resolution of the spectra and at the expense of gaps in the acquired data where RF pulses and gradient crushers are applied6,7. Similarly, multi-TE data is in more widespread use in spectroscopic imaging, where ‑just like in RARE‑ multiple echo acquisitions can be used to cover k-space in different echo periods and speed the coverage of the full range8,9.In this work, we propose a novel acquisition scheme of acquiring multi-TE data in a single acquisition to be used in a combined fitting process, where the half echo of the shortest TE is fitted with the full echo recorded for later TEs, including the extended tail of the last echo that provides resolution information for the whole echo train.
Methods
Multi-Echo Single-Shot (MESS) spectroscopy was investigated in comparison to the traditional Multi-Echo Multi-Shot (MEMS) scheme, Fig.1. Six healthy volunteers, occipital cingulate cortex (OCC) VOI: 20x31x17mm3, 3T MR Scanner (Prisma, Siemens), 64-channel receive head coil. SemiLaser localization10 (TEs: batch #1: 35/60.6/86.2ms; batch #2: 140/213.6/287.2ms, TR: 2000ms, SW:4kHz) with metabolite cycling (MC) for simultaneous acquisition of water and metabolite data. Five OVS bands for lipid and nasal cavity artifact suppression.MESS design, Fig.1: two optimized symmetric Mao slice-selective π pulses (1.5x slice width) create the 2nd and 3rd recorded echo; slice orientation with minimal lipid contamination. The 1st echo is acquired as FID for Δ=8ms and Δ=32ms respectively for batch #1 and #2. Second and third echoes are acquired as partially sampled full echoes, where the last window lasts to achieve an overall 1 second acquisition length. Crusher scheme together with phase cycling are optimized to minimize unwanted coherence pathways11 and calibrate echo timing. Data processing with jmrui and MATLAB.
Simultaneous 2D fitting in FitAID12 with time-domain model and frequency domain minimization. Voigt-line shapes, basis sets simulated in Vespa, 16 metabolites. Macro Molecular Background (MMBG) pattern simulated as sum of overlapping densely and equally spaced Voigt lines13. Prior knowledge: T2s fit freely for 6 major metabolites and MMBG; minor metabolites-T2 linked to glutamate. Set-ups: 3 echoes (6 volunteers) or 6 echoes (1 volunteer). Concentrations are calculated referencing to water. T1s taken from literature13. Tissue-specific water relaxation and partial volume correction for CSF included. CRLBs are taken as measure for achievable precision. FID and 2nd echo of MESS are zero-filled to match 3rd echo. To compare equivalent total experimental time for the two methods, CRLBs of MEMS are corrected by √3.
Results & Discussion
Fig.2 illustrates the acquired data, fit and residues for the 6 TE scheme with MEMS and MESS. The shortest TEs spectra in MESS (35 and 140ms) show very limited resolution. MESS spectra show a linear phase offset due to the partial echo acquisition. The residual water peak for echoes 1,2,4 and 5 cannot be removed by HLSVD filtering given the low resolution but is included in the model. A multi-step fit strategy is required for fitting stability.Estimated concentrations (Fig.3) and T2 values (Fig.4) are in line with literature values for OCC14. The figures include fit uncertainties (CRLB) and cohort variation (range in boxplots) for 3-TE data from 6 volunteers. MEMS and MESS yielded similar estimates (no bias) whereas precision for concentration and T2 estimates is better for MESS. The initial case of using 6-TEs promises further improvement of precision.
Conclusions
- The MESS experimental scheme for fast determination of concentrations and T2s for metabolites with complex spectral patterns has been tested in vivo and combines short and long TE recordings with unequal data length from single acquisitions with simultaneous model fitting.
- The novel approach promises increased precision or inversely shorter experimental time compared to traditional approaches while achieving comparable accuracy of estimates, as expected from simulations15.
- MEMS with partial echo sampling for 2nd and 3rd echo needs to be compared for final proof of superiority of the proposed scheme.
Acknowledgements
This work is supported by the Marie-Sklodowska-Curie Grant ITN-39 237 (Inspire-Med).References
- Kreis, R. et al. Integrated data acquisition and processing to determine metabolite contents, relaxation times, and macromolecule baseline in single examinations of individual subjects. Magn. Reson. Med. 54, 761–768 (2005).
- Kukurova, I. et al. Two-dimensional spectroscopic imaging with combined free induction decay and long-TE acquisition (FID echo spectroscopic imaging, FIDESI) for the detection of intramyocellular lipids in calf muscle at 7 T. NMR Biomed. 27, 980–987 (2014).
- Bolliger, C. S. et al. On the use of Cramér-Rao minimum variance bounds for the design of magnetic resonance spectroscopy experiments. Neuroimage 83, 1031–1040 (2013).
- An, L. et al. Simultaneous determination of metabolite concentrations, T1 and T2 relaxation times. Magn. Reson. Med. 78, 2072–2081 (2017).
- Kulpanovich, A. et al.. The application of magnetic resonance fingerprinting to single voxel proton spectroscopy. NMR in Biomedicine 31, 1-14 (2019).
- Kiefer, A. P. et al. Multiple-echo proton spectroscopic imaging using time domain parametric spectral analysis. Magn. Reson. Med. 39, 528–538 (1998).
- Ronen, I. et al. Rapid multi-echo measurement of brain metabolite T2 values at 7T using a single-shot spectroscopic Carr-Purcell-Meiboom-Gill sequence and prior information. NMR Biomed. 26, 1291–1298 (2013).
- Duyn, J. H. et al. Fast proton spectroscopic imaging of human brain using multiple spin‐echoes. Magn. Reson. Med. 30, 409–414 (1993).
- Dydak, U. et al. Parallel spectroscopic imaging with spin-echo trains. Magn. Reson. Med. 50, 196–200 (2003).
- Oz, G. et al. Short-echo, single-shot, full-intensity proton magnetic resonance spectroscopy for neurochemical profiling at 4 T: validation in the cerebellum and brainstem. Magn. Reson. Med. 65, 901-910 (2011).
- Landheer, K. et al. Dephasing optimization through coherence order pathway selection (DOTCOPS) for improved crusher schemes in MR spectroscopy. Magn. Reason. Med. 83, 391-402 (2019).
- Chong, D. G. Q. et al. Two-dimensional linear-combination model fitting of magnetic resonance spectra to define the macromolecule baseline using FiTAID, a Fitting Tool for Arrays of Interrelated Datasets. Magn. Reson. Mater. Physics, Biol. Med. 24, 147–164 (2011).
- Hoefemann, M. et al. Parameterization of metabolite and macromolecule contributions in interrelated MR spectra of human brain using multidimensional modeling. NMR Biomed. 33, e4328 (2020).
- Marjańska, M. et al. Region-specific aging of the human brain as evidenced by neurochemical profiles measured noninvasively in the posterior cingulate cortex and the occipital lobe using 1H magnetic resonance spectroscopy at 7 T. Neuroscience. 23, 168-177 (2017).
- Rizzo, R. et al. Potential benefits from Multi-Echo Single-Shot Spectroscopy with a combined fitting process. ISMRM 2020, #3668
Figures
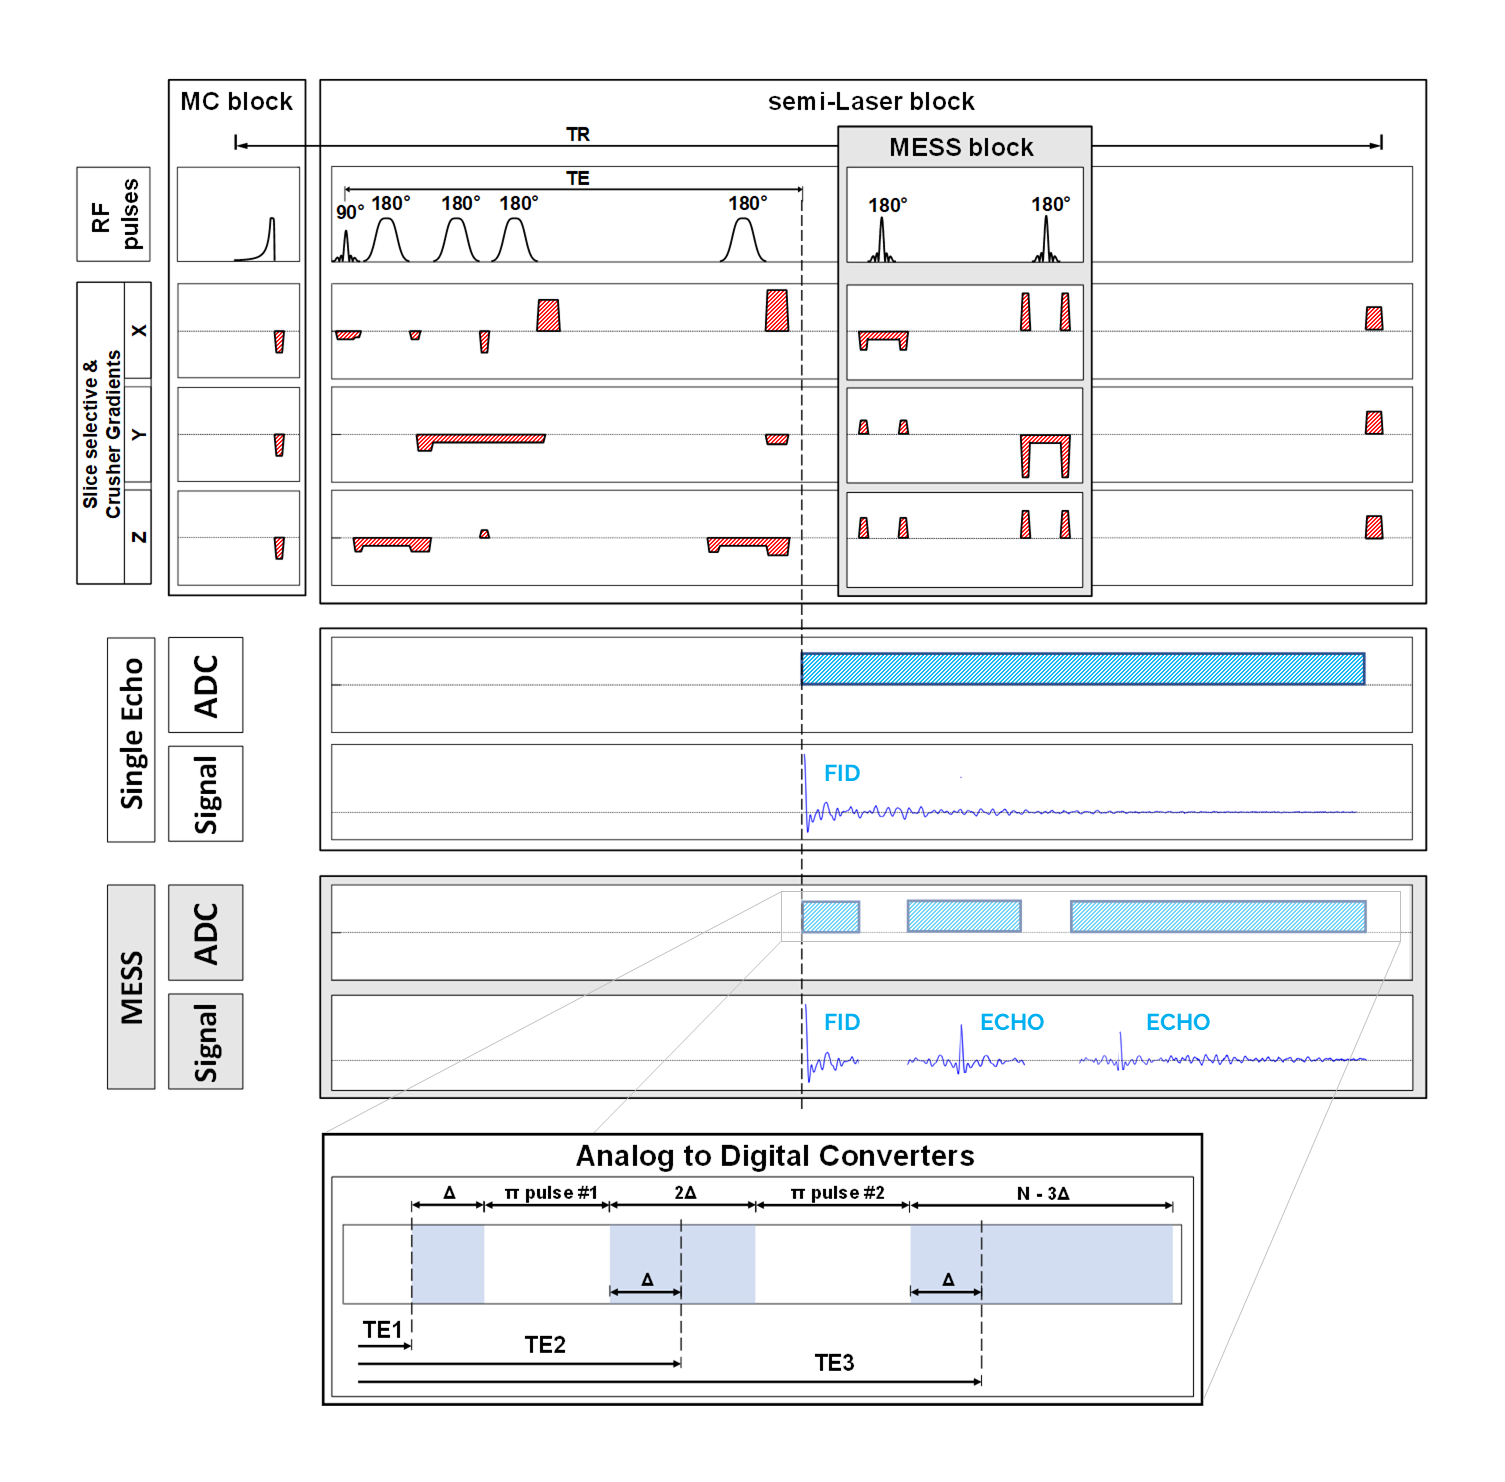
Fig.1: Acquisition scheme: (white background)
standard semiLaser localization, (gray background) MESS. Zoom-in for dedicated
echo timing.
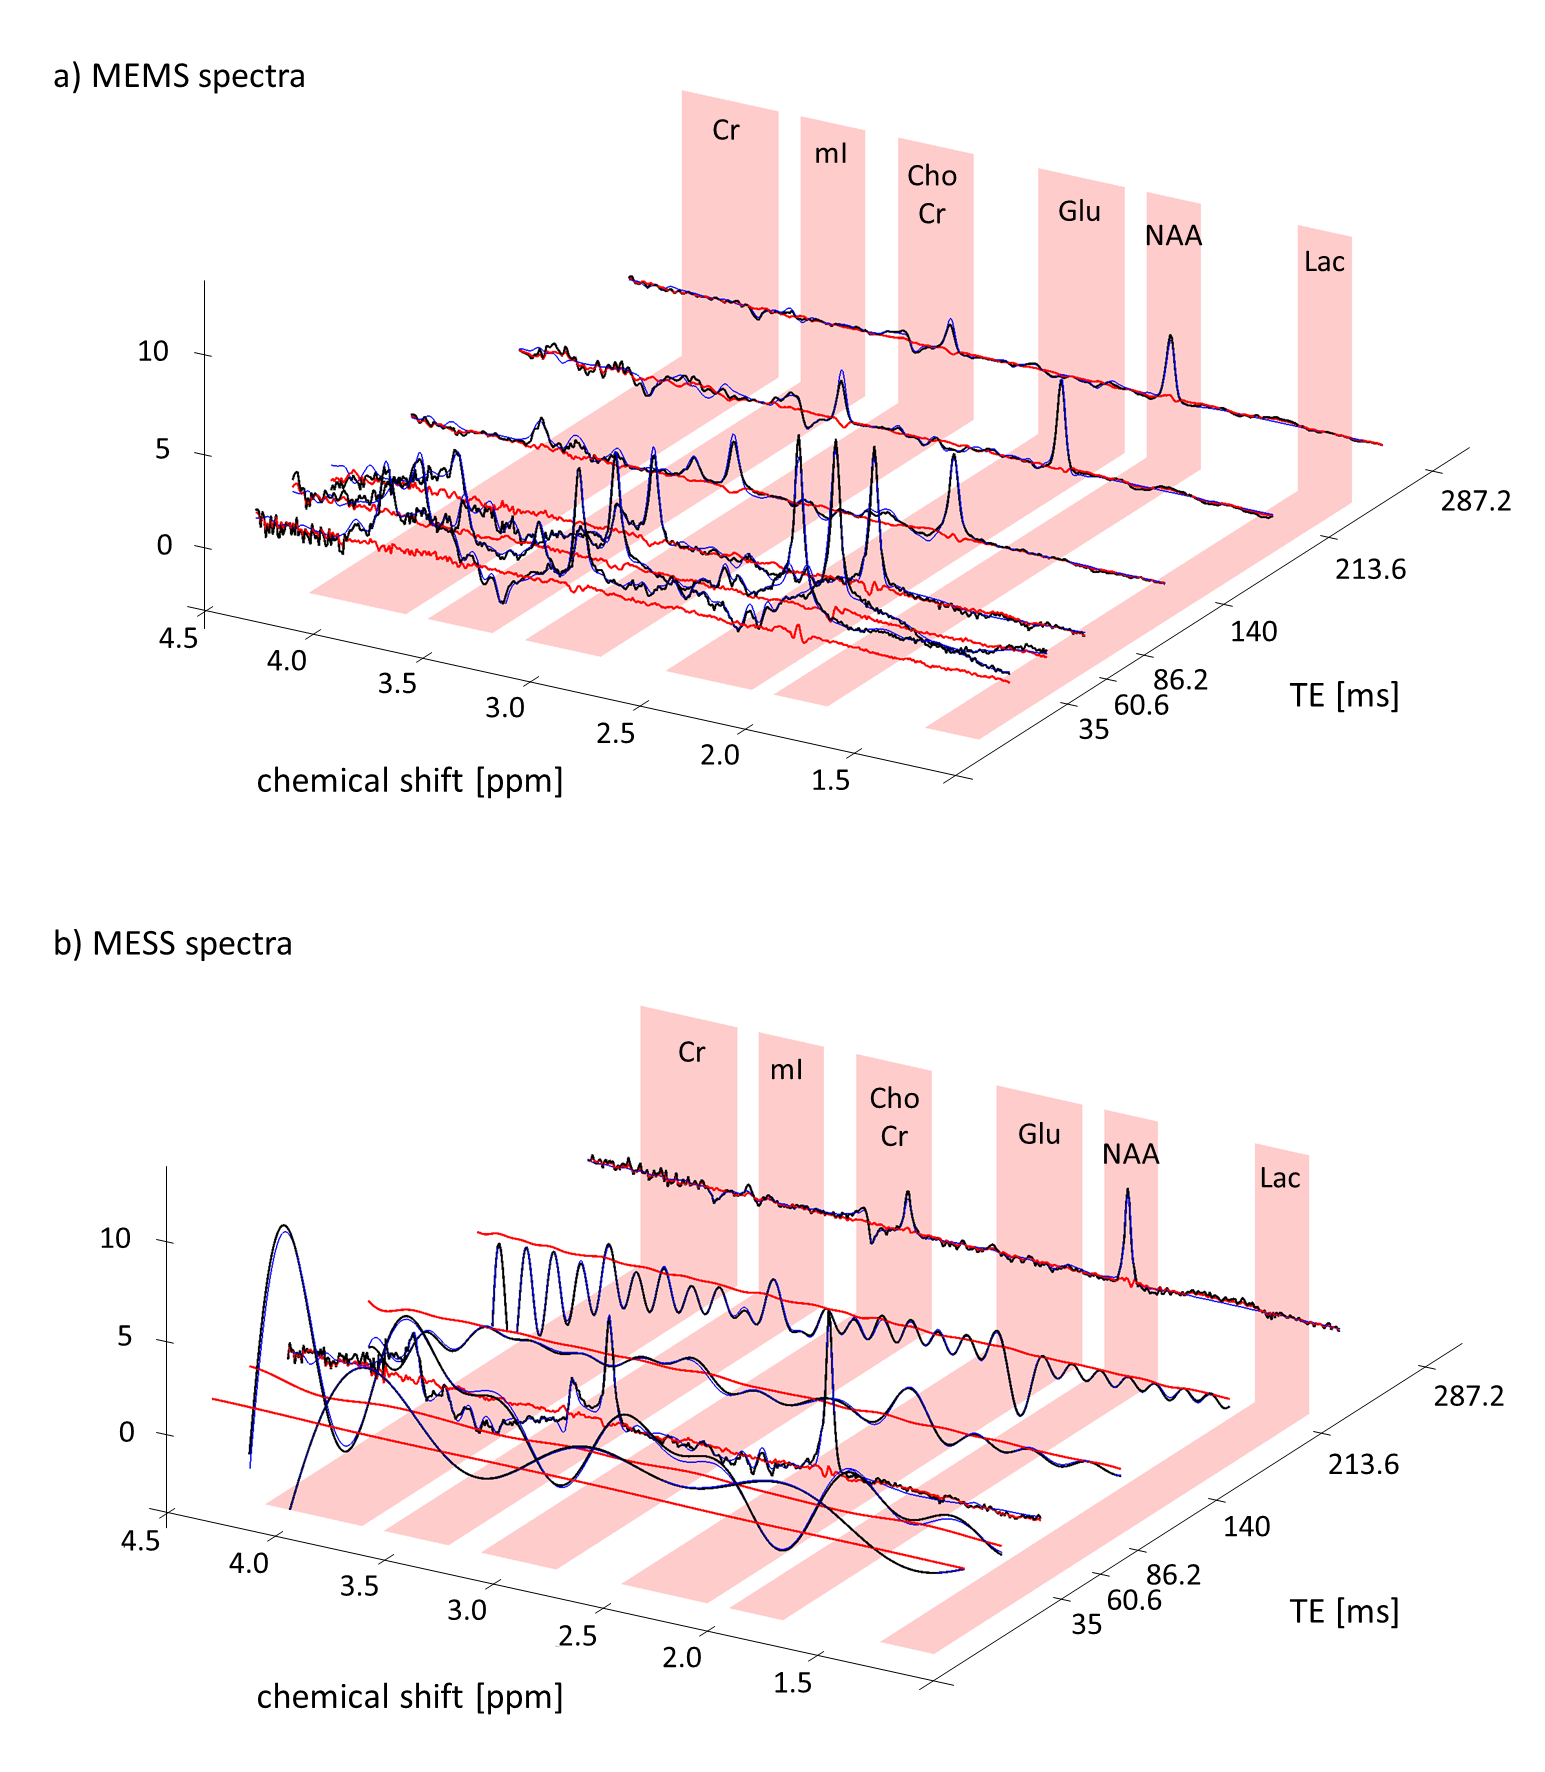
Fig2.: Acquired data
of 6TEs protocol of single volunteer (black), fitted model (blue) and residues (red). a) MEMS
dataset, b) MESS dataset.
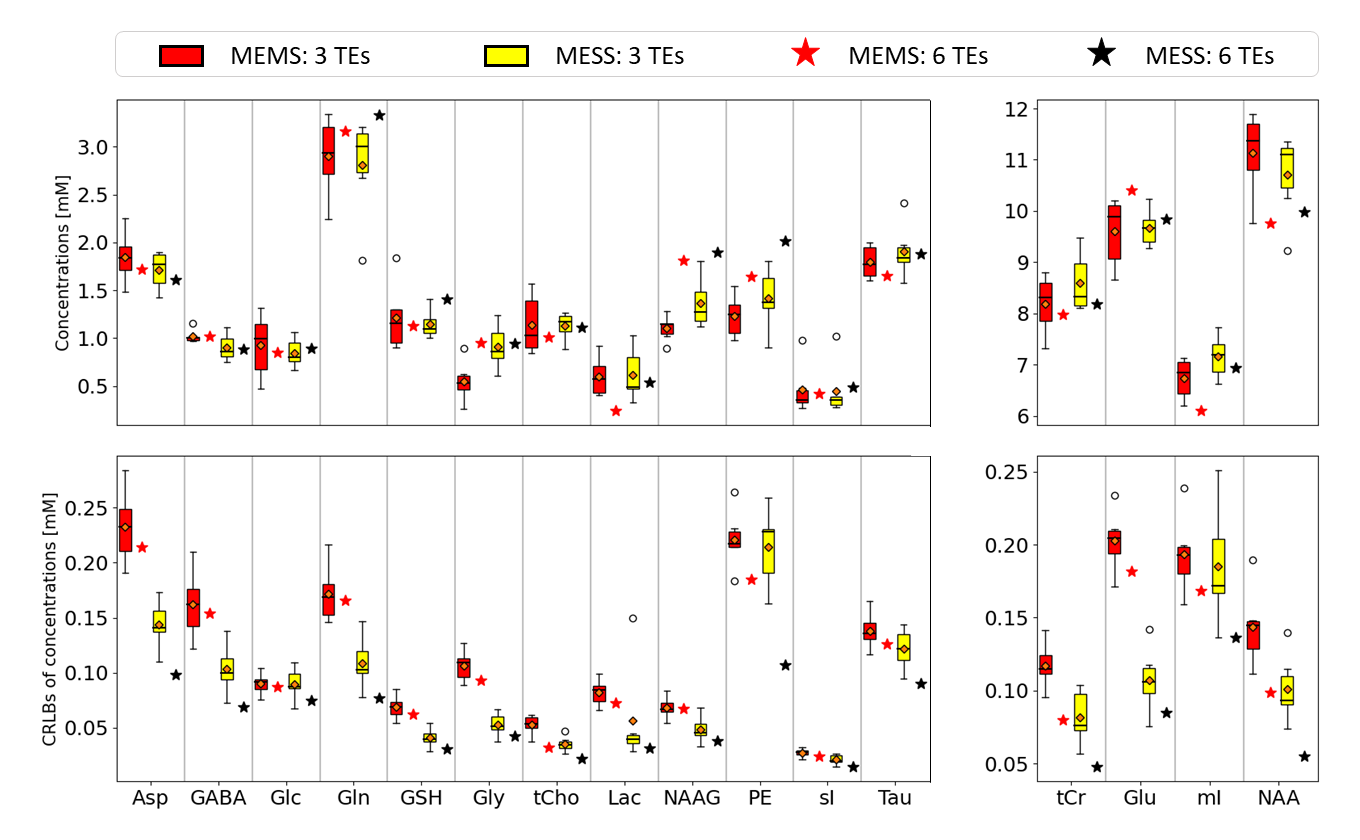
Fig3. Estimates and
uncertainties for concentrations (Asp: aspartate, GABA: gamma-aminobutyric
acid, Glc: glucose, Gln: glutamine, GSH: glutathione, Gly: glycine, tCho: total choline, Lac: lactate,
NAAG: N-acetylaspartylglutamic acid, PE: Phosphatidylethanolamine, sI:
syllo-Inositol, Tau: taurine, tCr: total Creatine, Glu: glutamate, mI:
myo-Inositol, NAA: N-acetylaspartate).
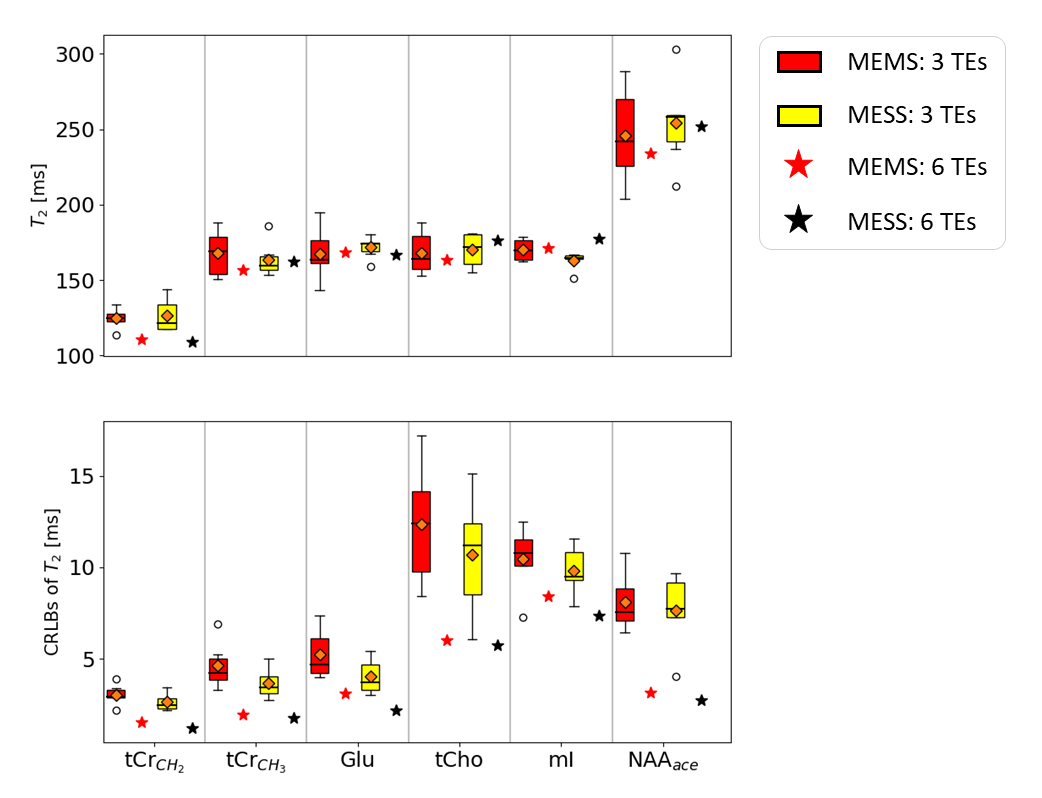
Fig.4: Estimates and
uncertainties for T2s (tCr: CH3: 3ppm peak; CH2 for
3.9ppm peak, tCho: choline CH3 for
trimethylammonium part, NAA: ace for CH3 acetyl group).
DOI: https://doi.org/10.58530/2022/0311