0309
Dynamic fitting of functional MRS, diffusion weighted MRS, and edited MRS using a single interface1Wellcome Centre for Integrative Neuroimaging, FMRIB, Nuffield Department of Clinical Neurosciences, University of Oxford, Oxford, United Kingdom
Synopsis
Dynamic magnetic resonance spectroscopy acquires multiple spectra under changing experimental conditions. Examples include editing, functional MRS, and diffusion weighted MRS. In this work we introduce a new tool that allows direct fitting of a dynamic signal model to multiple spectra simultaneously. Incorporation of a dynamic model into multi-spectra fitting reduces the number of parameters to be estimated from noisy data, reducing overall uncertainty.
The tool is demonstrated on simulated and multi-subject in vivo datasets, highlighting the high flexibility of the tool, which is open source and available as part of the FSL-MRS toolbox.
Introduction
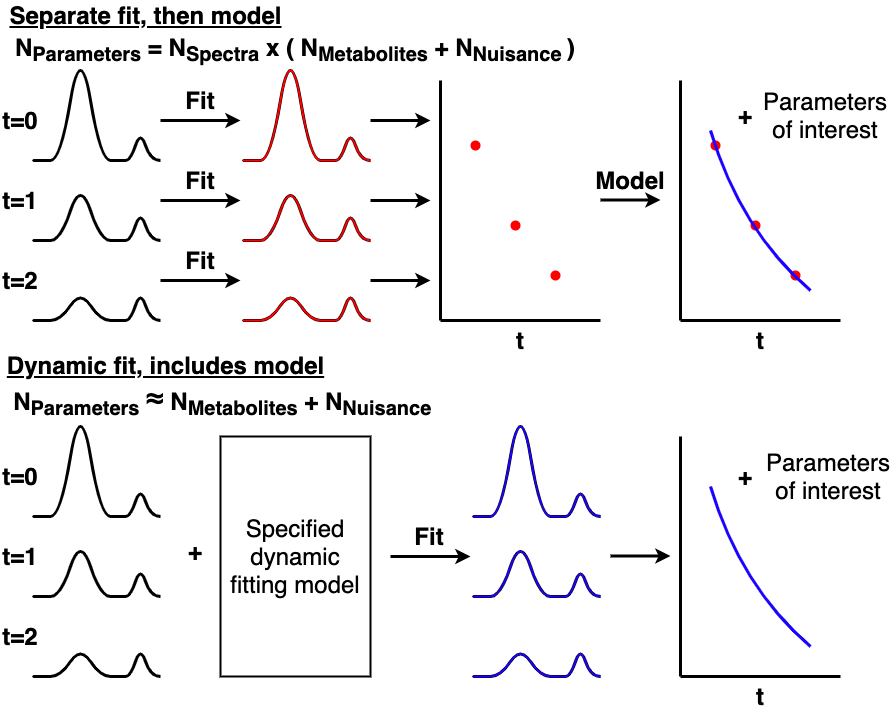
Dynamic magnetic resonance spectroscopy (MRS) comprises any MRS acquisition where multiple spectra are acquired under changing experimental conditions. This could reflect different MRS acquisitions, for example introducing a spectral editing saturation pulse1, or incrementing diffusion sensitising gradients (dwMRS)2. Alternatively, changing metabolite concentrations can be monitored during a functional task3.Often fitting of the above methods either happens:
- after forming a difference spectrum (editing); or,
- by fitting each individual transient separately, before fitting a dynamic or temporal model in a second step (dwMRS and fMRS).
Methods
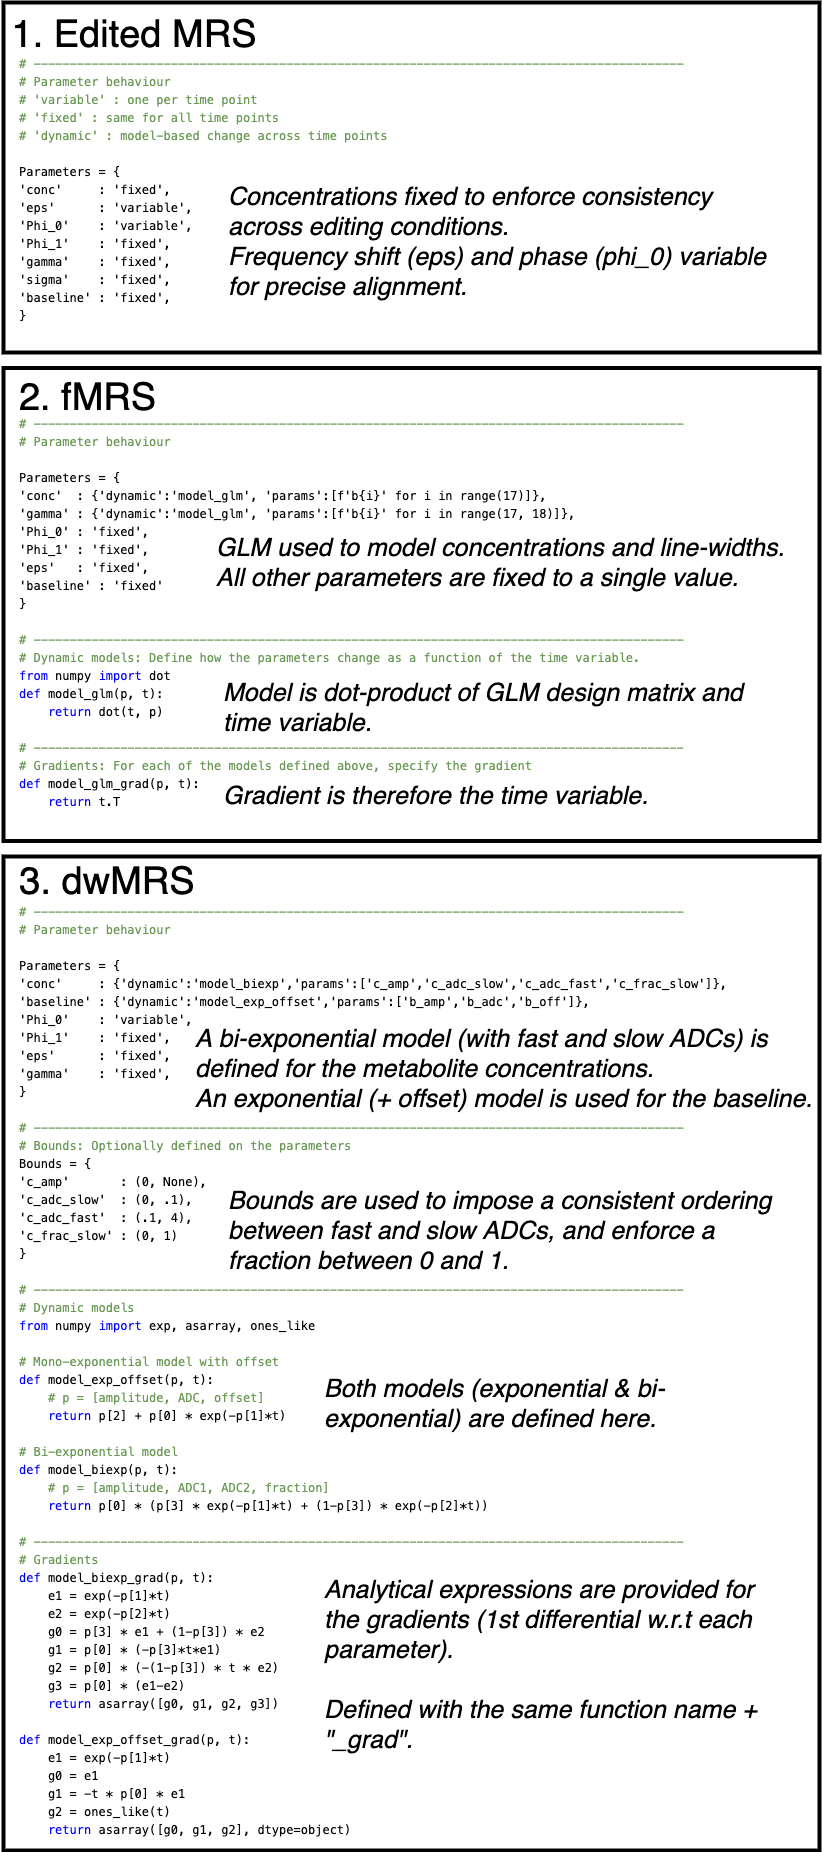
The tool utilises the spectral fitting model of FSL-MRS, modifying the signal model to be time dependent:$$s(\nu,t)=B(\nu,t)+e^{-j(\Phi_0(t)+\nu\Phi_1(t)}\sum_kc_k(t)\mathcal{F}[m_k(\tau,t)e^{-\tau(\gamma(t)+j\epsilon(t))}].$$Where the time dependence of the concentration $$$c_k$$$, lineshape $$$\gamma$$$ , shift $$$\epsilon$$$ , phase $$$\Phi$$$, and baseline $$$B$$$ parameters is specified in an editable, Python language, configuration file (Figure 2). Parameters may be fixed, estimated per time-point, or constrained by a model. Alongside the ability to specify linear combination basis set per transient, the configuration file enables dynamic models to be specified for many different types of MRS.
MEGA-PRESS
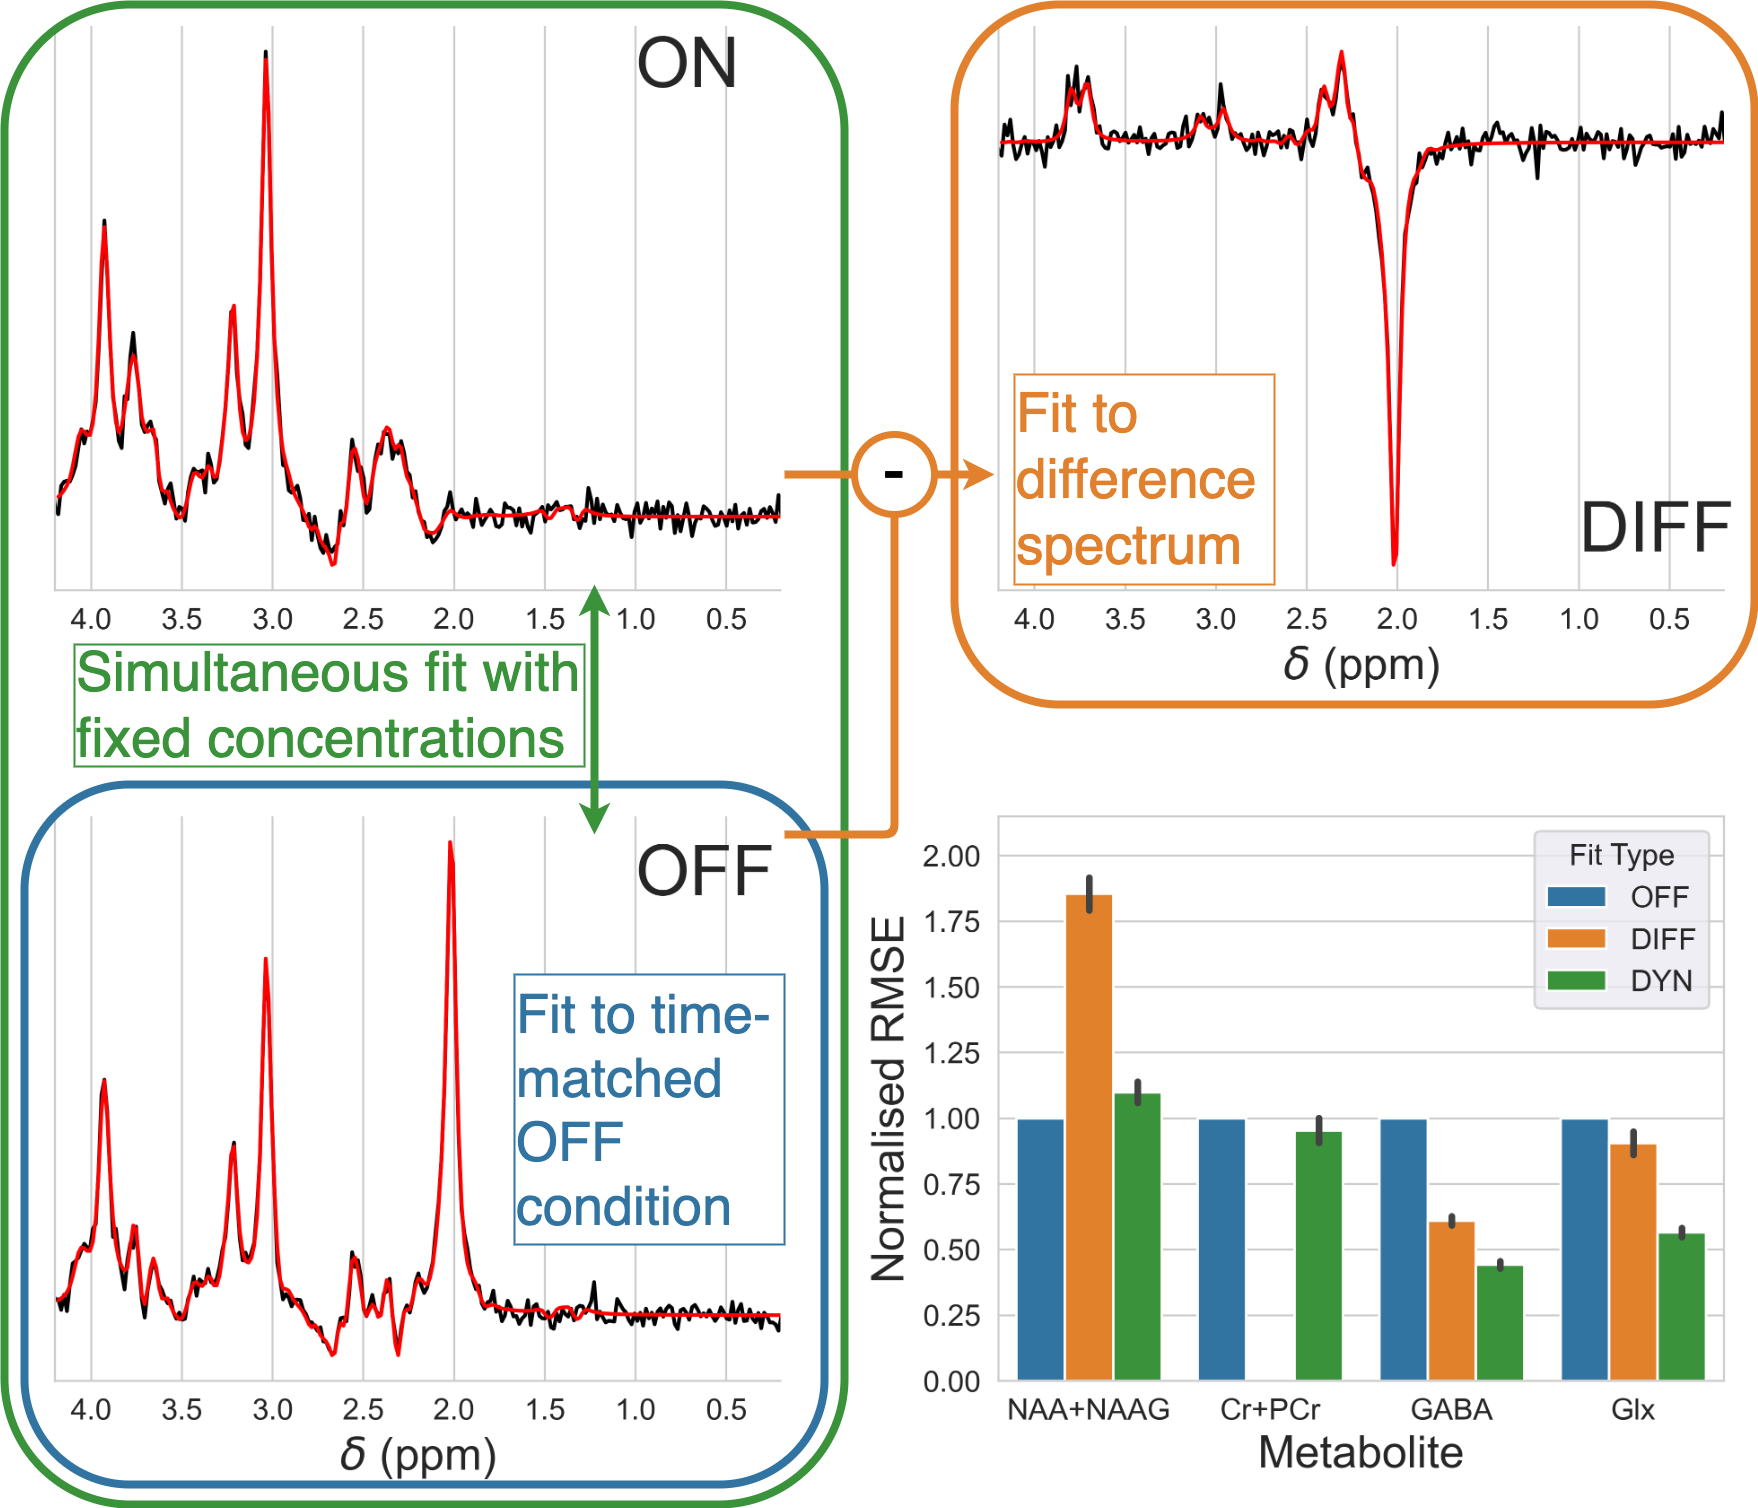
Synthetic MEGA-PRESS data was produced from basis sets (excluding macromolecules) simulated for the on-resonance (ON) and control (OFF) editing conditions. Parameters (concentrations, frequency shifts, line broadening, phase) were constant between the two conditions. Noise with equal standard deviation was added to each spectrum. Fitting was carried out repeatedly to form a Monte Carlo simulation on 1) just the OFF spectrum (with $$$1/\sqrt2$$$ noise SD), 2) the difference spectrum (ON-OFF), and 3) dynamically using the model specified in Figure 2.1.
fMRS
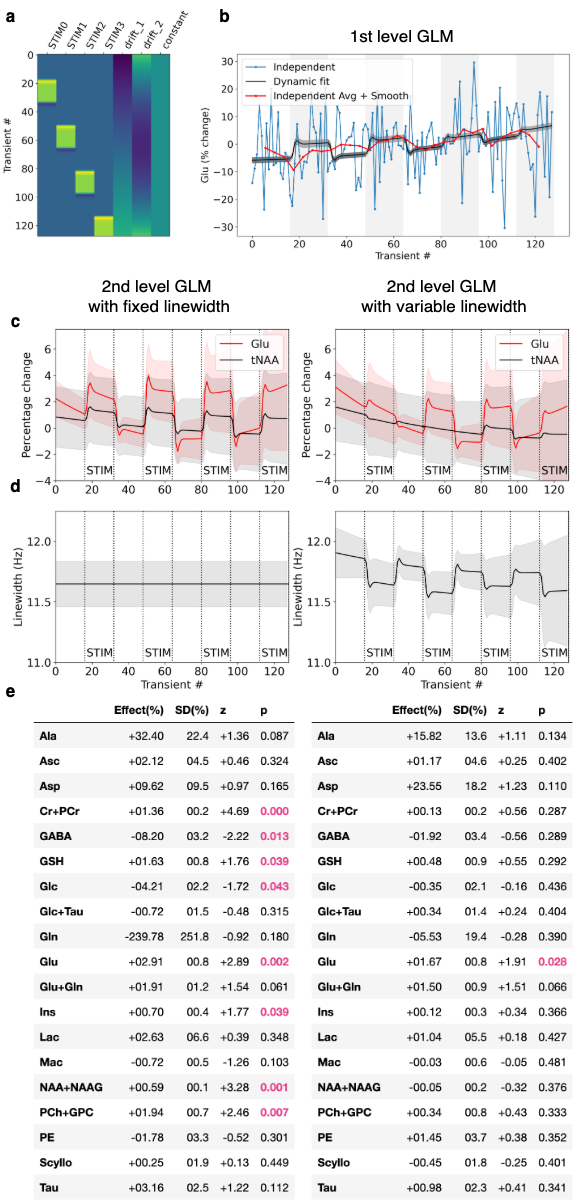
A published visual checkerboard fMRS dataset comprising single voxel spectra from the occipital lobe was analysed using a general linear model (GLM) 5. A design matrix (created using Nilearn 6, Figure 4a) specified four possible blocks of activation for each metabolite, aligned with the visual stimulation. Each dataset was fit using the model in Figure 2.2, which applies the same design matrix to the line-broadening parameter (to account for BOLD), and using a model with fixed line-broadening. A second level GLM (across subjects, random effect) calculated mean activation of each metabolite using FSL’s FLAMEO 7.
dwMRS
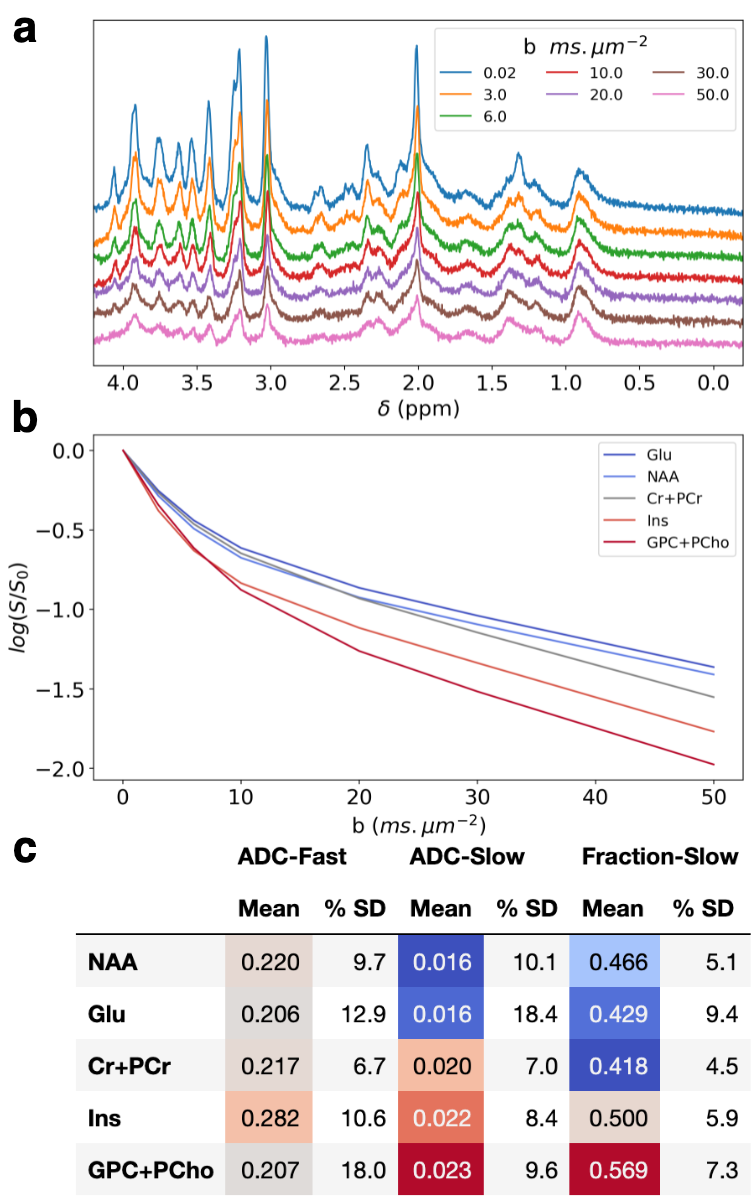
A diffusion model was directly fit to a 11.7 T STE-LASER dataset acquired from a wild-type mouse 8. The dataset comprises spectra of increasing b-value (0.02 – 50 ms.μm-2, Figure 5a). Dynamic fitting was carried out using a single basis set and the model specified Figure 2.3. The model specified constant line-broadening, frequency, and first order phase; variable zero order phase; and (bi)exponential decays for metabolite concentrations and polynomial baseline.
Results
MEGA-PRESSDynamic fitting carried out by the proposed tool showed the lowest RMSE (Figure 3) for GABA and Glx measurements. Dynamic fitting was also able to fit other metabolite concentrations (e.g. tNAA & tCr) not present in the difference spectrum, with equivalent accuracy to the fit of an unedited (OFF) spectrum.
fMRS
The glutamate (Glu) concentrations measured from a single subject is shown in Figure 4b. The dynamically fitted GLM is compared with independent fitting of each of the 128 timepoints, and independent fitting of averaged blocks of four timepoints (further smoothed after fitting). Whilst it is hard to see the effect of the stimulation in the independent fitting, it becomes apparent in the heavily smoothed fits, and is clearly visible in the dynamically fitted concentrations.
The second-level, across subjects analysis showed that accounting for line-narrowing arising from the BOLD effect is important. With a fixed linewidth, significant activation (p<0.05) is observed for many of the prominent singlet resonances. If line narrowing is modelled in the GLM using the same stimulus timings, only Glu activation remains significant, matching the original publication. The estimated line-narrowing (Figure 4d) matches the 0.21 Hz reported in the original publication.
dwMRS
The results of the dwMRS dynamic fitting are shown in Figure 5. Different diffusion behaviour of predominantly neuronal and predominantly glial metabolites can be observed 9. The fast and slow ADC parameters and single subject uncertainty are quantified by the tool.
Discussion & Conclusion
We have introduced a new dynamic spectroscopy fitting tool. It can exploit known signal models in dynamic experiments to reduce the influence of noise in typically low SNR data.A dynamic model constrains or reduces the number of parameters compared to independent fitting. Therefore, fit flexibility is reduced. This lowers uncertainty, but the fit of each spectrum will be biased. Imposing an inappropriate model will lead to large bias, therefore careful model selection must be made by the user.
Whilst similar tools have been developed 10, this tool is open source and allows arbitrary model flexibility for different experiments. Beyond the three examples demonstrated here, other uses include MR fingerprinting 11, or physiological kinetics 12.
Acknowledgements
We thank Betina Ip and Julien Valette for providing data used in this work.
WTC is supported by a grant from the Wellcome Trust and the Royal Society (102584/Z/13/Z). SJ is supported by a Wellcome Collaborative Award (215573/Z/19/Z) and a Wellcome Senior Fellowship (221933/Z/20/Z). The Wellcome Centre for Integrative Neuroimaging is supported by core funding from the Wellcome Trust (203139/Z/16/Z).
References
1. Choi I-Y, Andronesi OC, Barker P, et al. Spectral editing in 1H magnetic resonance spectroscopy: Experts’ consensus recommendations. NMR in Biomedicine 2021;34:e4411 doi: 10.1002/nbm.4411.
2. Ronen I, Valette J. Diffusion-Weighted Magnetic Resonance Spectroscopy. In: eMagRes. American Cancer Society; 2015. pp. 733–750. doi: 10.1002/9780470034590.emrstm1471.
3. Bednařík P, Tkáč I, Giove F, et al. Neurochemical and BOLD Responses during Neuronal Activation Measured in the Human Visual Cortex at 7 Tesla. J Cereb Blood Flow Metab 2015;35:601–610 doi: 10.1038/jcbfm.2014.233.
4. Clarke WT, Stagg CJ, Jbabdi S. FSL-MRS: An end-to-end spectroscopy analysis package. Magnetic Resonance in Medicine 2021;85:2950–2964 doi: 10.1002/mrm.28630.
5. Ip IB, Berrington A, Hess AT, Parker AJ, Emir UE, Bridge H. Combined fMRI-MRS acquires simultaneous glutamate and BOLD-fMRI signals in the human brain. Neuroimage 2017;155:113–119 doi: 10.1016/j.neuroimage.2017.04.030.
6. Abraham A, Pedregosa F, Eickenberg M, et al. Machine learning for neuroimaging with scikit-learn. Frontiers in Neuroinformatics 2014;8:14 doi: 10.3389/fninf.2014.00014.
7. Woolrich MW, Behrens TEJ, Beckmann CF, Jenkinson M, Smith SM. Multilevel linear modelling for FMRI group analysis using Bayesian inference. NeuroImage 2004;21:1732–1747 doi: 10.1016/j.neuroimage.2003.12.023.
8. Ligneul C, Palombo M, Hernández-Garzón E, et al. Diffusion-weighted magnetic resonance spectroscopy enables cell-specific monitoring of astrocyte reactivity in vivo. NeuroImage 2019;191:457–469 doi: 10.1016/j.neuroimage.2019.02.046.
9. Palombo M, Shemesh N, Ronen I, Valette J. Insights into brain microstructure from in vivo DW-MRS. NeuroImage 2018;182:97–116 doi: 10.1016/j.neuroimage.2017.11.028.
10. Chong DGQ, Kreis R, Bolliger CS, Boesch C, Slotboom J. Two-dimensional linear-combination model fitting of magnetic resonance spectra to define the macromolecule baseline using FiTAID, a Fitting Tool for Arrays of Interrelated Datasets. Magn Reson Mater Phy 2011;24:147–164 doi: 10.1007/s10334-011-0246-y.
11. Kulpanovich A, Tal A. The application of magnetic resonance fingerprinting to single voxel proton spectroscopy. NMR in Biomedicine 2018;31:e4001 doi: 10.1002/nbm.4001.
12. Zierhut ML, Yen Y-F, Chen AP, et al. Kinetic modeling of hyperpolarized 13C1-pyruvate metabolism in normal rats and TRAMP mice. Journal of Magnetic Resonance 2010;202:85–92 doi: 10.1016/j.jmr.2009.10.003.
Figures