0308
Robust diffusion-weighted spectroscopic imaging throughout the mouse brain1Université Paris-Saclay, Commissariat à l’Energie Atomique et aux Energies Alternatives (CEA), Centre National de la Recherche Scientifique (CNRS), Molecular Imaging Research Center (MIRCen), Laboratoire des Maladies Neurodégénératives, Fontenay aux Roses, France
Synopsis
Being more specific to cellular microstructure than water diffusion, diffusion-weighted spectroscopic imaging (DW-MRSI) is a powerful tool for measuring disorders in cortical gray matter. Nevertheless, measurement in the cortex is difficult due to its proximity to the skull. We propose a selective DW-MRSI sequence, which avoids lipid contamination and measures the signal of metabolites even in the cortex. We performed an in vivo acquisition with this sequence and were able to measure an apparent diffusion coefficient over an entire brain slab.
Introduction
Diffusion-weighted MR spectroscopy (DW-MRS) is a powerful tool to assess cellular microstructure of the brain1,2. Mapping alterations of metabolite diffusion across the brain using DW spectroscopic imaging (DW-MRSI) is potentially of great interest for disease monitoring, in particular in regions such as cortical gray matter where water diffusion is presumably less specific to cell microstructure due to exchange3. Despite a few attempts, this remains difficult, and in general the cortex is excluded from the selected volume-of-interest4,5. Here we propose a sequence to measure metabolite apparent diffusion coefficient (ADC) over a whole slab, including the cortex, while paying particular attention to minimize measurement bias. Briefly, we incorporate the following elements:- Frequency-selective excitation excluding lipids, combined with adiabatic slice-selection, to acquire metabolites spectra without lipid contamination in a slab. In addition, using such selective pulse, there is no need for water suppression, allowing short TR.
- Isotropic diffusion-encoding module with QMAS gradients6, so that ADC is not biased by macroscopic anisotropy that may exist in small voxels.
- Navigator data acquired on metabolite signal instead of water signal, to correct for bulk motion without bias due to CSF flow5.
We perform in vivo acquisition in the mouse brain, demonstrating the possibility to measure ADC maps over a very large area of the brain.
Method
DW-MRSI sequence. The sequence (Fig.1) consists of a frequency-selective 20-ms excitation pulse generated with the Shinnar-Leroux algorithm, to select a 952-Hz band (1.9 ppm, followed by a pair of adiabatic refocusing pulses to perform slab selection. QMAS diffusion-weighting gradients (21-ms duration) are inserted between the two adiabatic pulses. MRSI phase-encoding is performed just before the acquisition. A navigator (8-ms duration to achieve some spectral resolution on NAA peak) is placed before phase-encoding gradients, but after QMAS gradients, so that it carries phase and frequency shifts induced by bulk motion during the QMAS gradient.In-vivo acquisition. A wild-type mouse anesthetized with isoflurane (1.6%) was scanned in an 11.7 T BioSpec Bruker scanner equipped with a cryoprobe. Automatic 1st and 2nd order shimming was performed within a box inside the brain, with the same thickness as the slice. For the selective DW-MRSI parameters were the following: FOV=11 13 mm², matrix size of 20 20, 1-mm slice thickness, TE=51 ms, TR=500 ms, and Hanning-weighted k-space acquisition, resulting in 36-min acquisition time. Acquisitions were performed for b=0.2 and 2.49 ms/µm². Besides the frequency-selective pulse, OVS were added around the brain to remove some residual lipid signal.
Reconstruction pipeline. Signal of each k-space data is phased- and frequency-corrected based on the NAA peak of the corresponding navigator signal. After Fourier transform, localized spectra are fitted with LCModel7, using a basis-set simulated with home-made routines. ADC is finally calculated according to $$$ADC=- \frac{ln(S(b)/S(b=0))}{∆b}$$$.
Results and discussion
MRSI throughout the brain. Metabolite signal is relatively homogeneous in gray matter, even in pixel on the very edge of the brain (Fig.2). The frequency-selective RF pulse and OVS remove much of lipid contamination, but the spectra in the posterior brain region / cerebellum are slightly distorted. Nevertheless, for regions away from the center (top on the image) the shim remains poor, and the spectra are clearly broadened (~3-fold linewidth increase) in the anterior brain region. Despite different attempts, we could never simultaneously achieve good shim in the central and anterior parts of the brain. Total NAA (tNAA=NAA+NAAG) and total creatine (tCr=Cr+PCr) signal estimation is reliable at both b-value (Fig.3). The ~1×1-µm² effective in-plane resolution (considering the effect of Hanning-weighting) allows some structures to be recognized in metabolite maps, e.g. low concentration of tNAA and tCr in ventricles is clearly visible.ADC maps. ADC maps were computed for tNAA and tCr (Fig.4). ADC does not vary much throughout the brain, except near CSF-containing regions. Average ADC for tNAA is 0.195±0.038 µm²/ms in a large gray matter voxel in the central region (blue ROI) and 0.197±0.021 µm²/ms in the cortex (green ROI), in line with the literature for short diffusion times8. The ADC of tCr is equal to 0.202±0.027 µm²/ms in the central region and 0.201±0.032 µm²/ms in the cortex. The differences in ADC were not significantly different (t test) between these two brain regions, suggesting homogeneous diffusivity throughout the gray matter. Near the CSF regions, poor shimming and lower SNR could explain the higher ADC measured here. It appears that shimming remains a limiting factor for obtaining whole-brain ADC mapping.
Conclusion
We demonstrated here that the frequency selective DW-MRSI sequence could yield acceptable ADC measurements throughout a whole brain slab, even close to the skull, with good spatial resolution. The limiting factors are mainly the acquisition time (although some acceleration technique might be considered in the future) and the difficulty to achieve good shimming throughout the brain.Acknowledgements
This project has received funding from the European Research Council (ERC) under the European Union’s Horizon 2020 research and innovation programmes (grant agreement No 818266).References
1. Ronen, I. & Valette, J. Diffusion-Weighted Magnetic Resonance Spectroscopy. in eMagRes 733–750 (American Cancer Society, 2015). doi:10.1002/9780470034590.emrstm1471.
2. Ligneul, C. et al. Diffusion-weighted magnetic resonance spectroscopy enables cell-specific monitoring of astrocyte reactivity in vivo. NeuroImage 191, 457–469 (2019).
3. Jelescu, I. O., de Skowronski, A., Palombo, M. & Novikov, D. S. Neurite Exchange Imaging (NEXI): A minimal model of diffusion in gray matter with inter-compartment water exchange. arXiv:2108.06121 [physics] (2021).
4. Posse, S., Otazo, R., Dager, S. R. & Alger, J. MR spectroscopic imaging: Principles and recent advances. Journal of Magnetic Resonance Imaging 37, 1301–1325 (2013).
5. Ercan, A. E., Techawiboonwong, A., Versluis, M. J., Webb, A. G. & Ronen, I. Diffusion-weighted chemical shift imaging of human brain metabolites at 7T. Magn Reson Med 73, 2053–2061 (2015).
6. Westin, C.-F. et al. Q-space trajectory imaging for multidimensional diffusion MRI of the human brain. NeuroImage 135, 345–362 (2016).
7. Provencher, S. W. Automatic quantitation of localized in vivo 1H spectra with LCModel. NMR in Biomedicine 14, 260–264 (2001).
8. Valette, J., Ligneul, C., Marchadour, C., Najac, C. & Palombo, M. Brain Metabolite Diffusion from Ultra-Short to Ultra-Long Time Scales: What Do We Learn, Where Should We Go? Front. Neurosci. 12, 2 (2018).
Figures
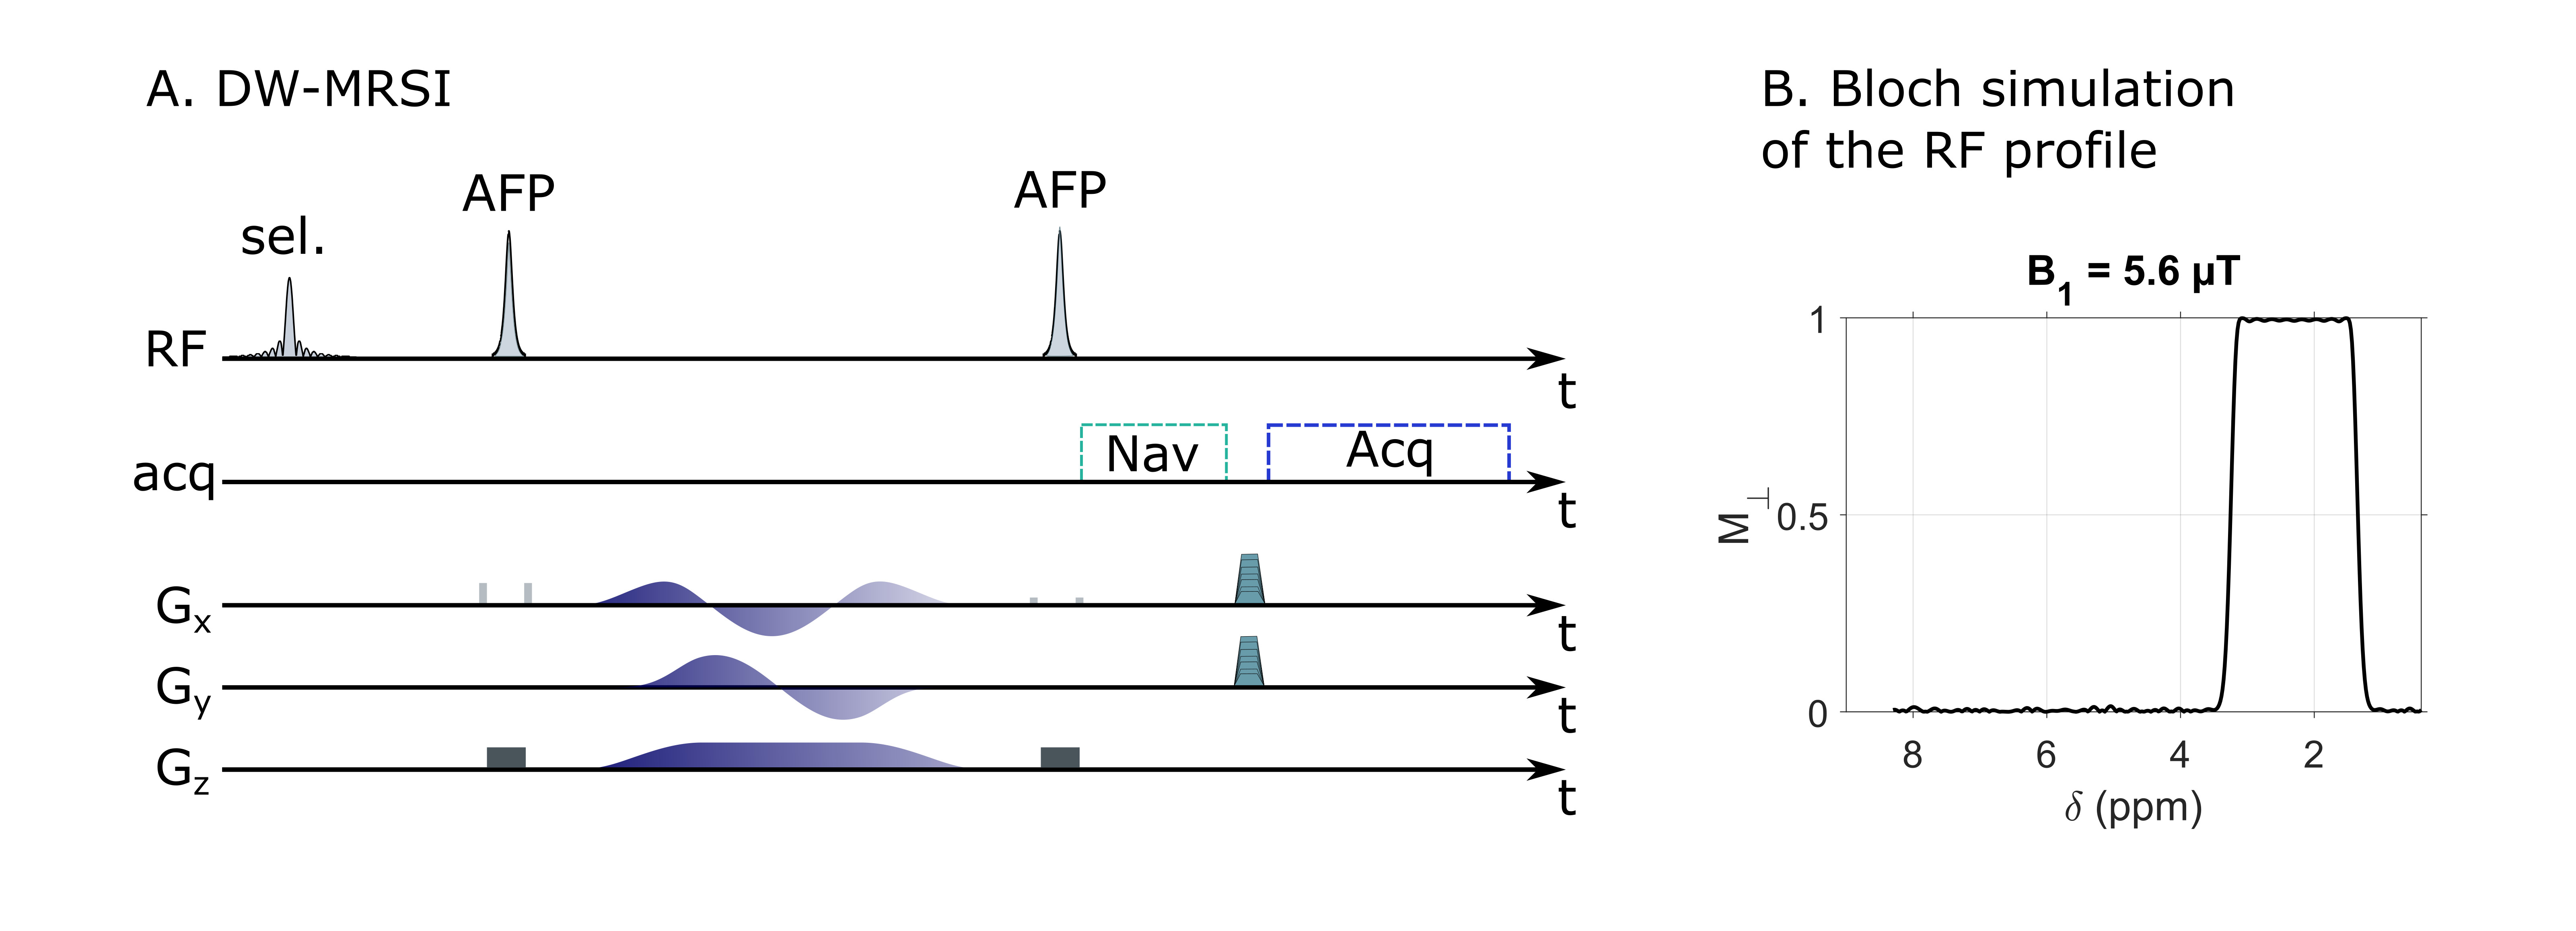


Figure 4: Apparent diffusion coefficient maps for tNAA (left) and tCr (right). ADC is homogeneous in the brain for tCr and tNAA in the two brain region of interest in the gray matter: central region (blue) and cortex (green).