0307
Changes in occipital GABA, glutamate/glutamine concentrations and cerebral oxygen metabolism in response to visual stimulation1Advanced Imaging Research Center, The University of Texas Southwestern, Dallas, TX, United States, 2Johns Hopkins University, Baltimore, MD, United States, 3The University of Texas Southwestern, Dallas, TX, United States, 4Max Planck Institute for Biological Cybernetics, Tübingen, Germany
Synopsis
The relationship between brain’s GABA and glutamate/glutamine (Glx) concentrations measured by 1H MRS, hemodynamic response, neural signaling, and behavior is poorly understood. Here, the relationship between MRS-detectable GABA and Glx signals and MR hemodynamic contrasts during visual stimulation were examined. It was observed that changes in GABA+ and Glx were positively correlated with the BOLD response and negatively correlated with their levels at rest. Additionally, task GABA+ concentrations were negatively correlated with cerebral metabolic rate of oxygen (CMRO2). Together, these results suggest shifts in the inhibitory/excitatory balance and metabolism to maintain homeostasis in the brain.
Purpose
The inhibitory/excitatory balance between neurotransmitters GABA and glutamate, is fundamental to the homeostatic regulation of neuronal firing (1,2). Proton magnetic resonance spectroscopy (1H-MRS) is capable of measuring concentrations of both metabolites, and while the molecular behavior of these neurotransmitters is known, relationship between their MRS signals, neural signaling and behavior is not fully understood. Even less is known about the link between neurotransmitters and hemodynamic responses. While baseline GABA concentrations have been related to CMRO2 estimations (3), the relationship between task GABA concentrations and CMRO2 has yet to be examined. Behavior of the GABA+ and glutamate+glutamine (Glx) 1H MRS signals under visual stimulation is examined here and related to hemodynamic imaging contrasts in the human visual cortex.Methods
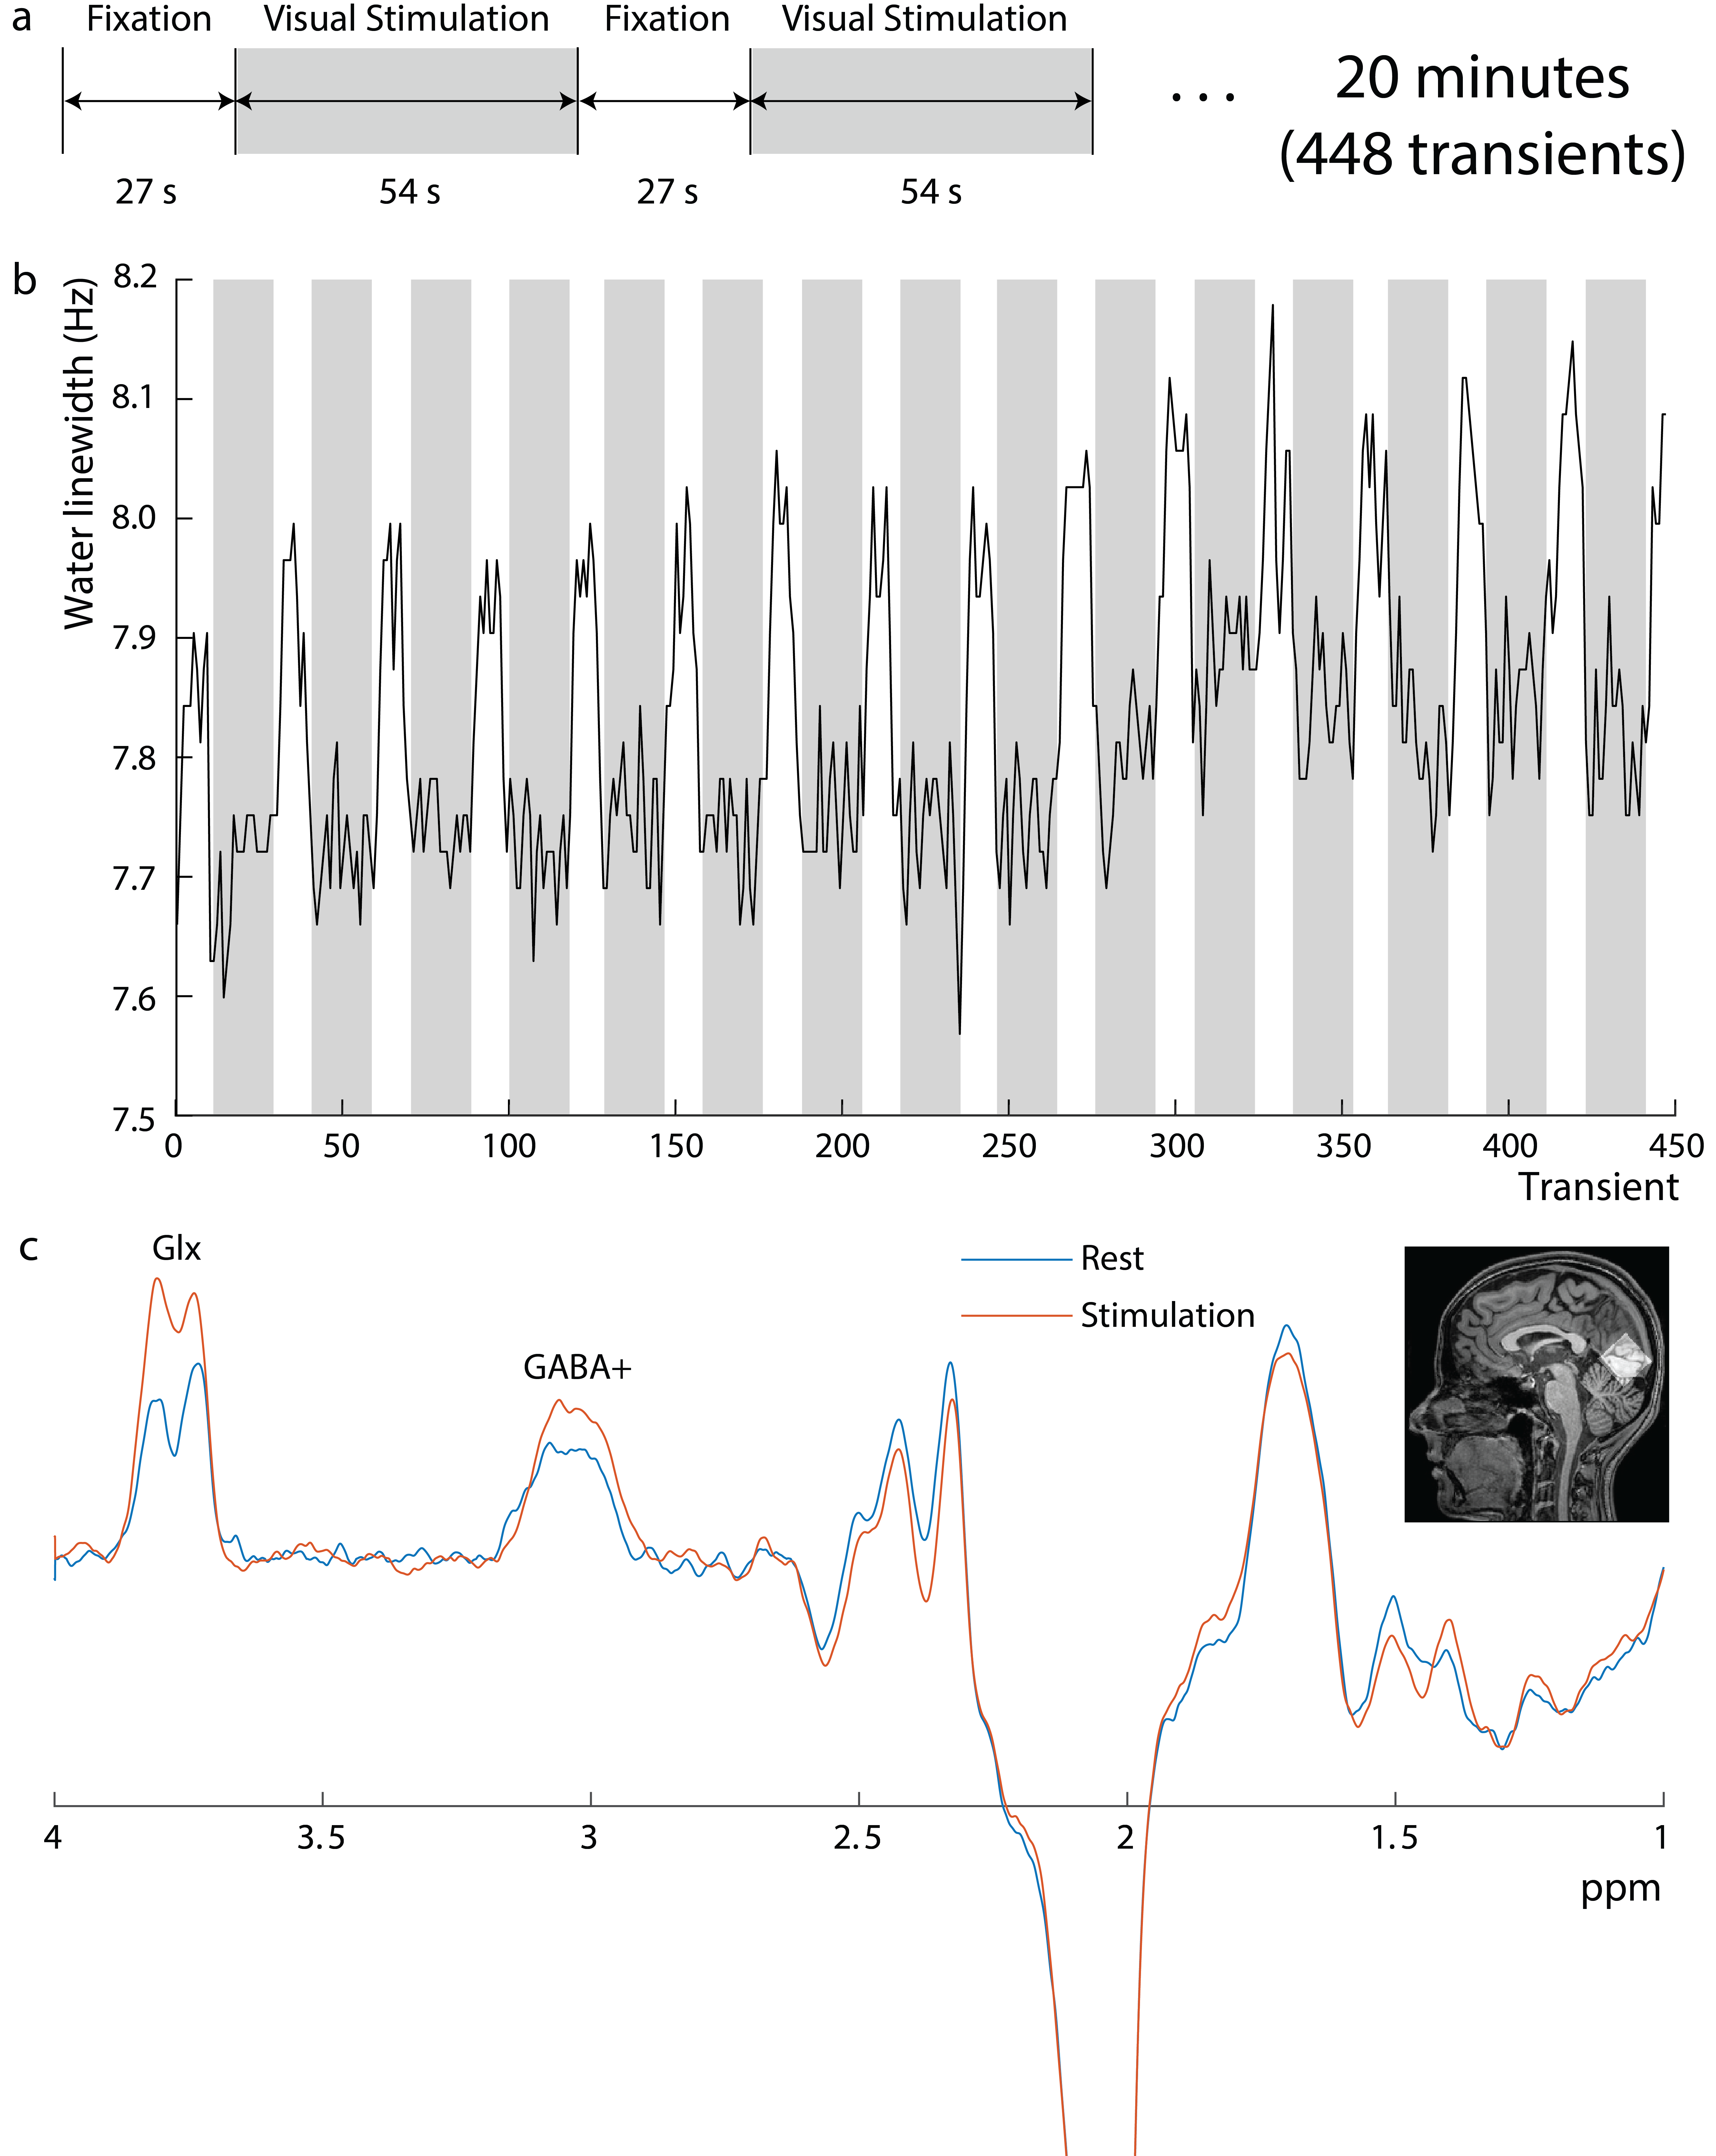
Experiments were performed on a Philips Achieva 3T scanner. Editing of GABA+ (GABA+macromolecules) was performed using a single-voxel MC MEGA sequence (4) in 6 healthy volunteers (4 female, age 27.1±2.7 years) in a 3 cm3 voxel in the Occipital lobe (OCC) with local Institutional Review Board approval. Acquisition parameters include 14-ms editing pulses at 1.9-ppm and 7.5-ppm in edit-ON and edit-OFF , respectively, TE/TR=68ms/2.63s, 448 transients, spectral bandwidth=2-kHz, and scan duration=20 minutes. An alternating blue/yellow flashing checkerboard (27/54s rest/stimulus×16) was used (figure 1a). Two separate edited-MRS scans were performed at different flashing frequencies: 8Hz and 4Hz with a 20-minute break in between. MRS results reflect pooled data from both frequencies. Data was processed using in-house software and Gannet 3.1 (5) with time-domain retrospective phase and frequency correction (6). As the full water signal is made available at each transient by metabolite-cycling, differences in the average water linewidth between rest and stimulation were extracted to estimate the BOLD response and expressed as percentages of the water linewidth during rest. Edited spectra were linewidth-corrected based on these values, spline-baseline-corrected, and fit with Gannet.CMRO2 was measured using the Fick principle as described previously (7-9). Briefly, CMRO2 (µmol O2/min/100g brain-tissue) was quantified based on arterio-venous difference in oxygen content (10) and is written as CMRO2 = CBFxOEFxCa = CBFx(Ya – Yv)xCa (1), where CBF (cerebral-blood-flow) represents the blood supply to the brain, Ya and Yv represent the arterial and venous blood oxygen saturation fraction (in %) respectively, and OEF= (Ya - Yv) is the oxygen-extraction-fraction. Ca represents the oxygen carrying capacity of unit volume blood and is 8.97 mmol O2/mL blood (11). CBF was measured at rest, during 4Hz and 8Hz checkerboard stimulation using a pseudo-continuous-arterial-spin-labeling (pCASL) sequence with following parameters: FOV=220×220mm2, matrix=64×64, 29 axial slices, 5mm-thick, TR/TE=4750/16-ms, label-duration=1.8s, post-label-delay=1.8s, single-shot echo-planar-imaging (EPI), 30 label/control image pairs, 2D readout without background suppression, and duration=4-minutes 45s. Ya was measured using a pulse oximeter and Yv was measured non-invasively in the sagittal sinus using TRUST-MRI (12). OCC (MNI template-space) CBF was used to calculate OCC CMRO2.
Results
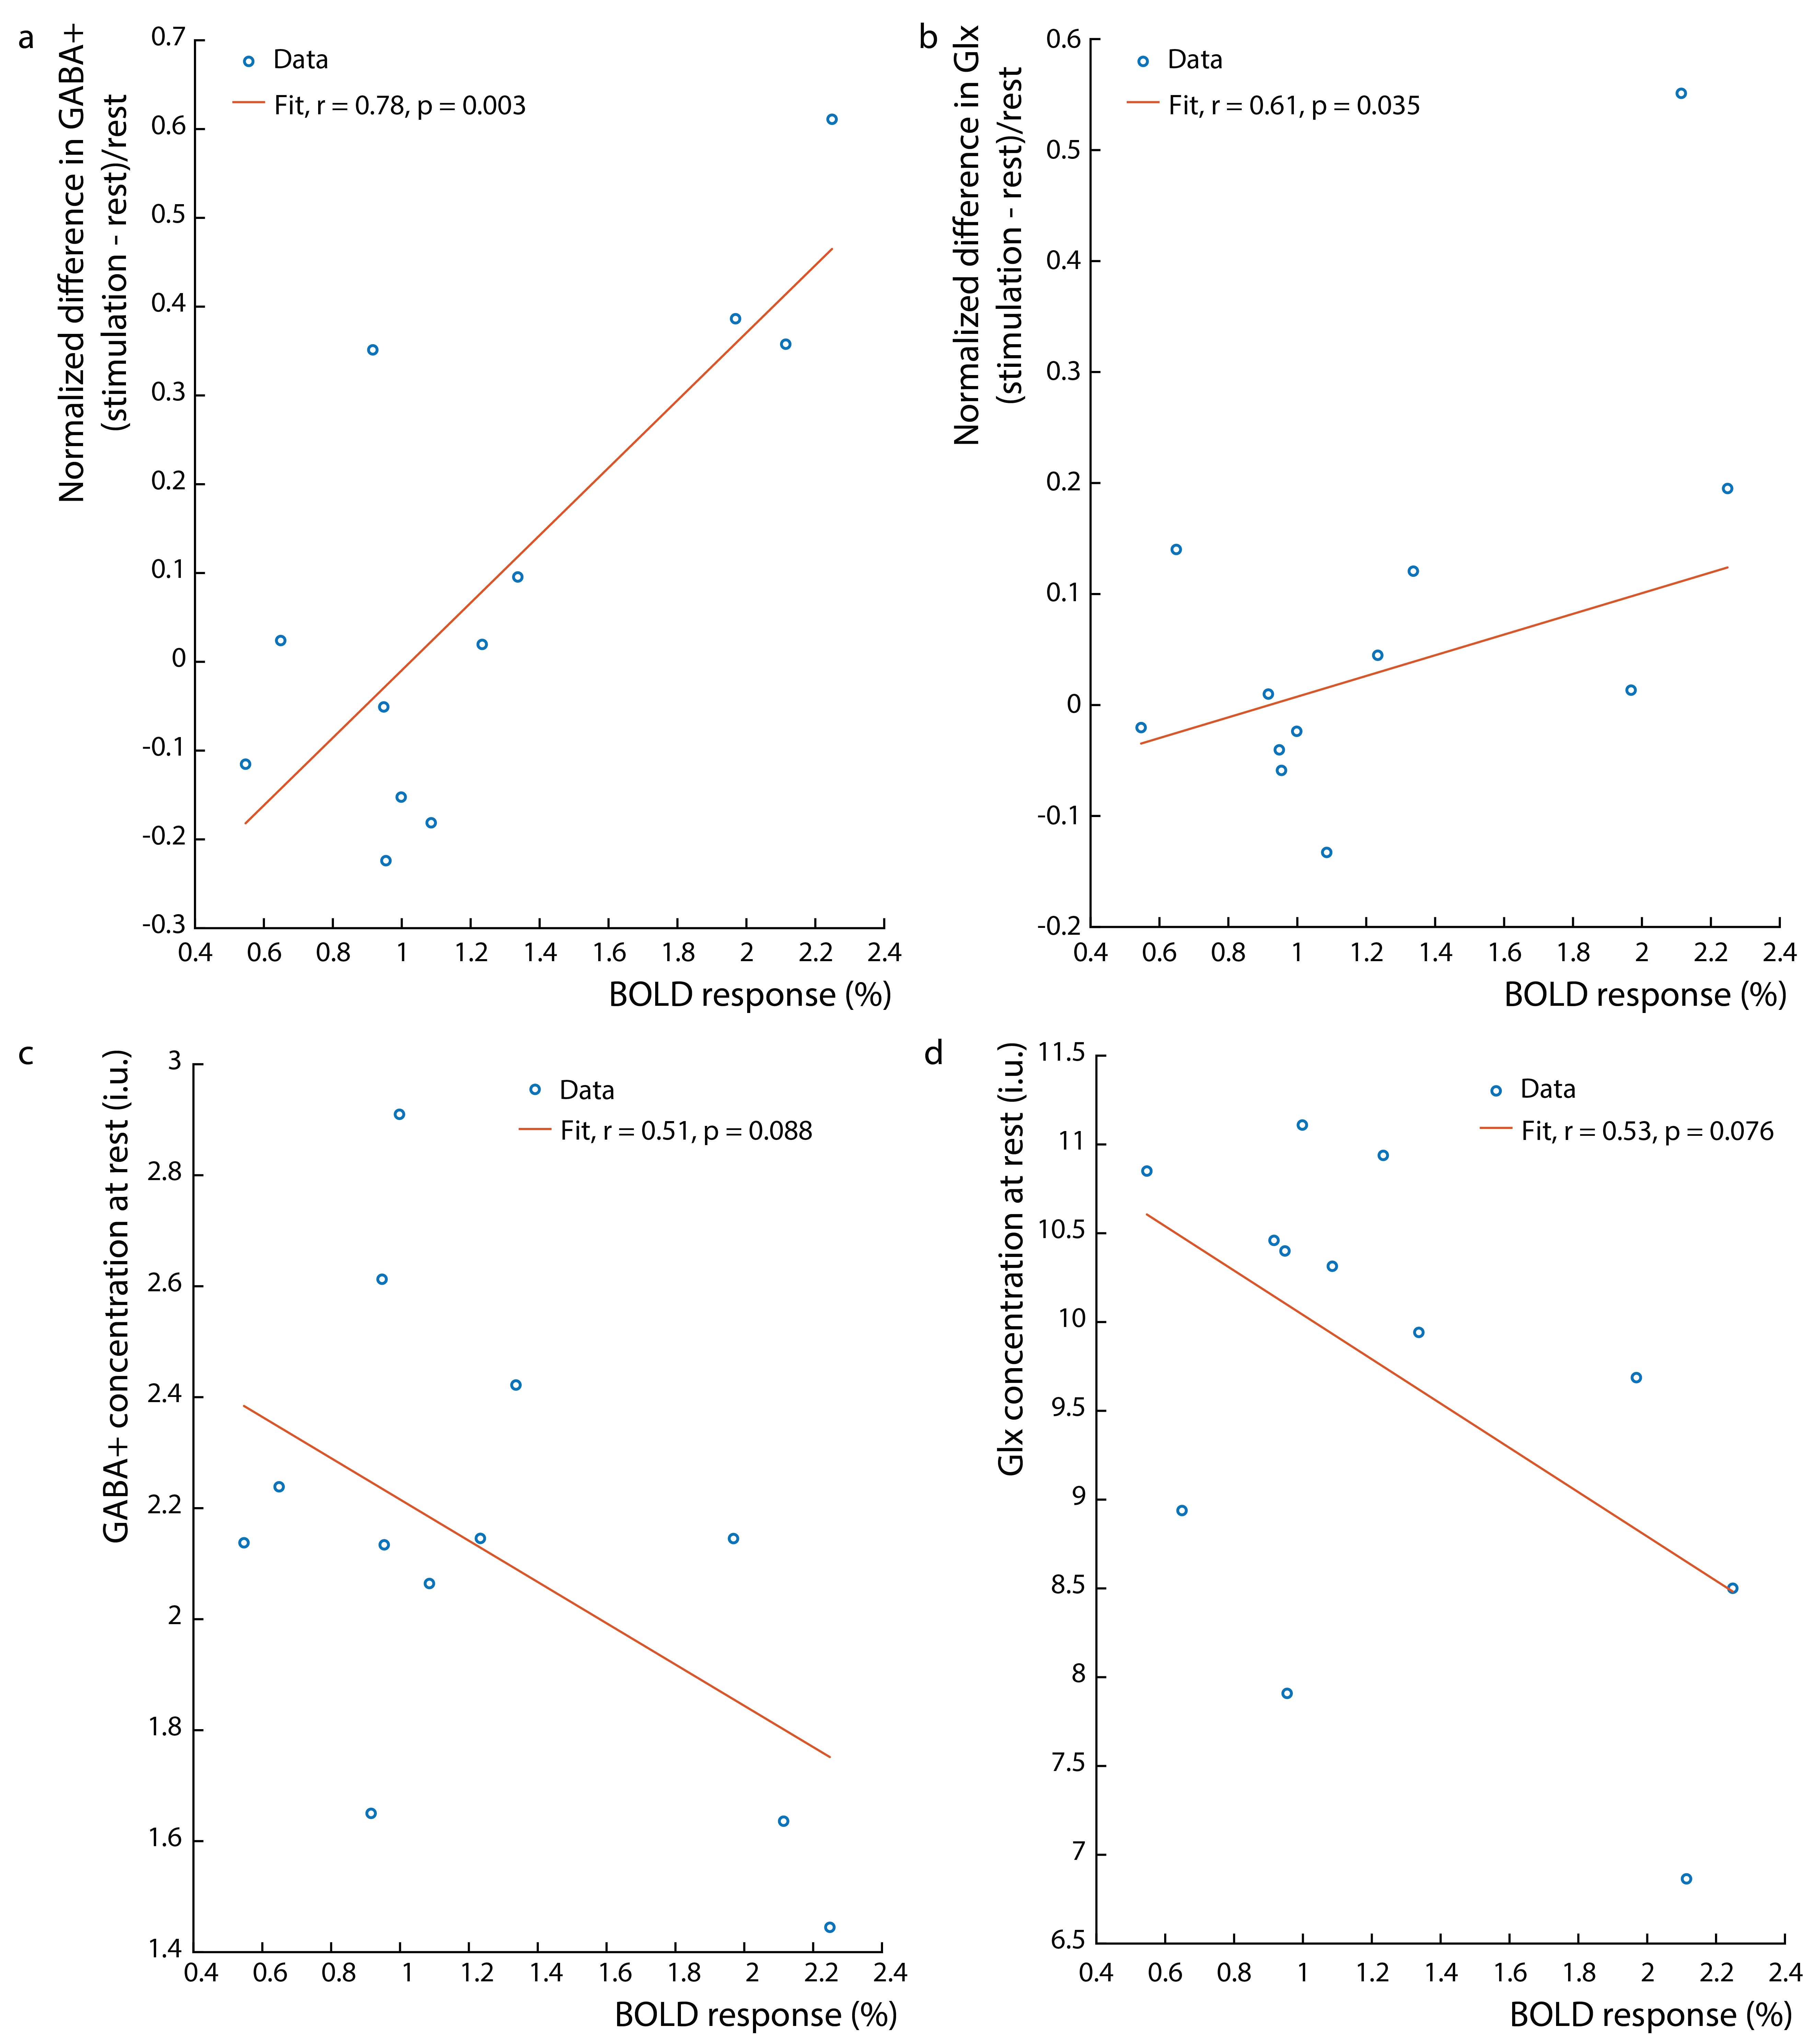
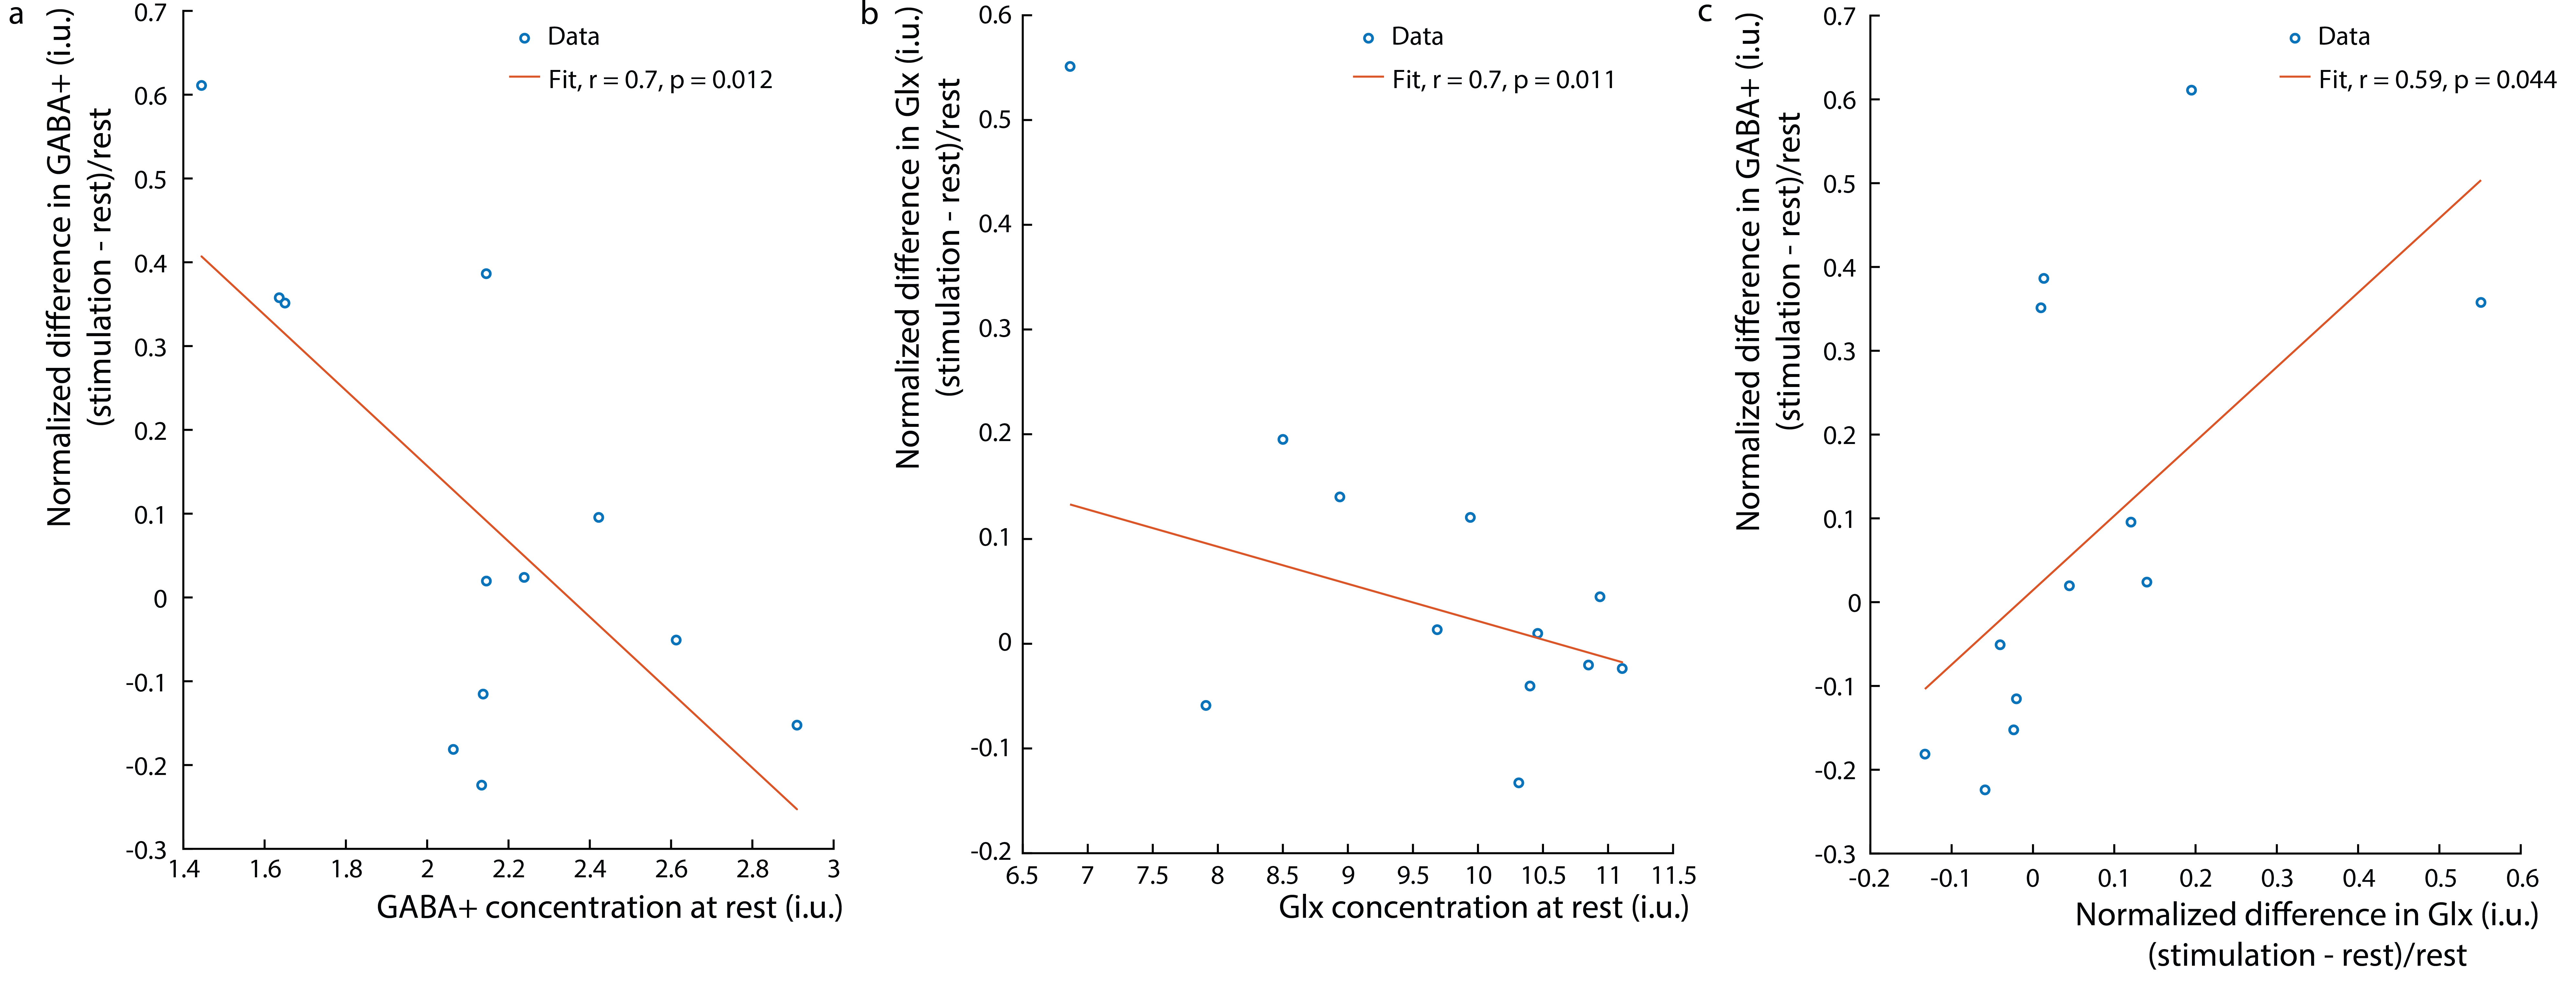
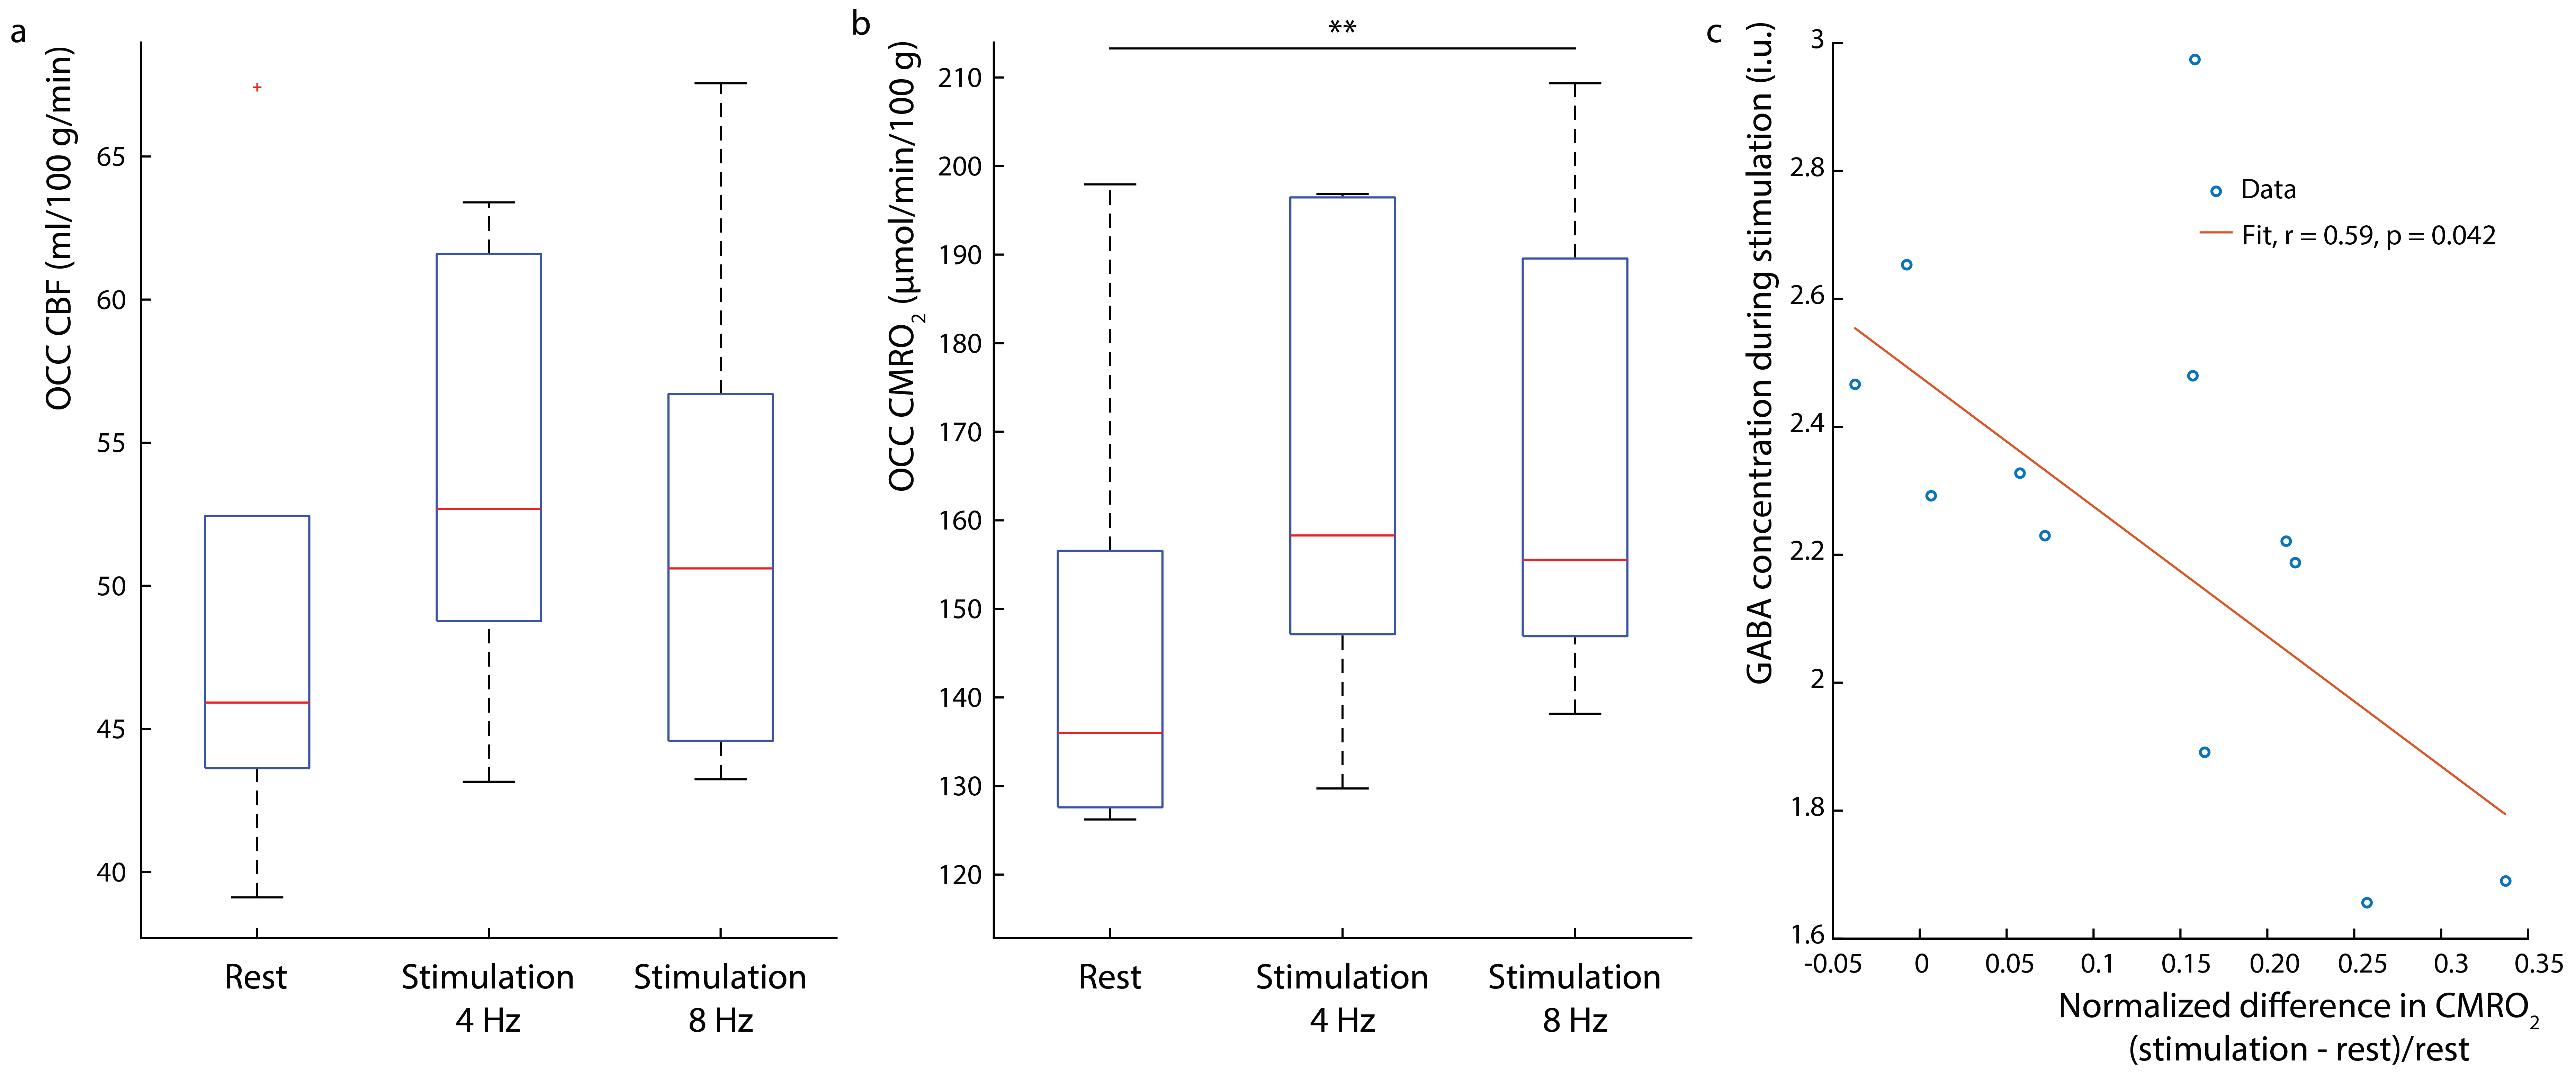
Figure 1b shows the water linewidth MRS time-course in one subject. As expected, the water linewidth decreases by a median of 0.11Hz with stimulation relative to rest, consistent with literature (13-15). Representative GABA-edited spectra show changes in GABA+ and Glx between rest and stimulation (figure 1c). Correlations between changes in GABA+ and Glx concentrations between stimulation and rest, and GABA+ and Glx concentrations at rest versus the BOLD response are plotted in figure 2. Both GABA+ (figure 2a) and Glx (figure 2b) concentration changes display a strong positive correlation with the BOLD response, while resting GABA+ (figure 2c) and Glx (figure 2d) levels show trend to a negative correlation. Confirming these results, GABA+ (figure 3a) and Glx (figure 3b) changes during stimulation were significantly negatively correlated with GABA+ and Glx concentrations at rest, respectively. GABA+ and Glx concentration changes during stimulation were also positively correlated with one another (figure 3c). While there was no statistically significant difference in CBF between stimulation and rest (figure 4a), CMRO2 was higher with 8Hz stimulation than at rest (figure 4b). Additionally, task GABA+ concentrations are negatively correlated with CMRO2 changes (figure 4c).Discussion
Here, it’s shown that MC MEGA can measure dynamic changes in GABA+ and Glx concentrations during visual stimulation. GABA+ and Glx changes are positively correlated with the BOLD response and GABA+ increases are accompanied by Glx increases indicating that excitatory processes might be activated during stimulation as well as compensatory inhibitory processes to maintain the inhibitory-excitatory balance. Alternatively, Glx reflects changes in both glutamate and glutamine, and most of glutamate is a product of the TCA cycle reflecting an increase in oxidative energy metabolism. In line with previous work, glutamate changes could reflect a shift in metabolism to a higher state in response to prolonged stimulation (15-17). It is also shown that GABA+ and Glx increases are negatively correlated with their resting concentrations. This is possibly due to differences in resting GABA+ levels among individuals and consequently differences in effect sizes of GABA+ and Glx upregulation in response to stimulation (18). Also, GABA+ levels during stimulation are negatively correlated with CMRO2 changes, which suggests that an alternate faster energy source from glucose during glycolysis (18-21) may have supplemented energy requirements during prolonged visual stimulation. Consequently, higher task GABA+ levels indicate more inhibitory neurotransmission, which may be neuroprotective, preventing the brain from exhaustion.Acknowledgements
This work was funded by the Cancer Prevention and Research Institute of Texas (CPRIT) (Grant Number: RR180056).References
1. Buzsaki G et al. Neuron 2007.
2. Fergus A et al. Brain Res. 1997.
3. Donahue MJ et al. NeuroImage 2010.
4. Chan KL et al. Magn. Reson. Med. 2021.
5. Edden RAE et al. J. Magn. Reson. Imaging 2013.
6. Near J et al. Magn. Reson. Med. 2015.
7. Thomas BP et al. J. Cereb. Blood Flow 2017.
8. Xu F et al. Magn. Reson. Med. 2009.
9. Chen JJ et al. J. Cereb. Blood Flow Metab. 2010.
10. Kety SS et al. J. Clin. Investig. 1948.
11. Guyton AC et al. Textbook of medical physiology, 11th ed. Philadelphia: Saunders: Elsevier, 2005.
12. Lu et al. Magn. Reson. Med. 2008.
13. Dwyer GE et al. Front. Hum. Neurosci. 2021.
14. Zhu X-H et al. Magn. Reson. Med. 2001.
15. Bednarik P et al. J Cereb Blood Flow Metab. 2015.
16. Mangia et al. J Cereb Blood Flow Metab. 2007.
17. Lin Y et al. J Cereb Blood Flow Metab. 2012.
18. Raichle ME et al. Annu. Rev. Neurosci. 2006.
19. Fox PT et al. Science. 1988
20. McGilvery RW, et al. Biochemistry: A Functional Approach. Philadelphia: Saunders, 1983.
21. Just et al. NMR in Biomed. 2020.
Figures