0303
Assessment of resolution and noise in MR images reconstructed by data driven approaches
Katja Lauer1,2, Jonas Kleineisel1, Alfio Borzì2, Thorsten Alexander Bley1, Herbert Köstler1, and Tobias Wech1
1Department of Diagnostic and Interventional Radiology, University Hospital Würzburg, Würzburg, Germany, 2Institute of Mathematics, University of Würzburg, Würzburg, Germany
1Department of Diagnostic and Interventional Radiology, University Hospital Würzburg, Würzburg, Germany, 2Institute of Mathematics, University of Würzburg, Würzburg, Germany
Synopsis
Data-driven reconstruction of undersampled raw data has gained more and more importance in recent years. Due to the non-linear and non-stationary transform characteristics of these imaging methods, objective image quality assessment is difficult. We propose a heuristic approach based on local point spread functions and multiple replica reconstructions, to enable the derivation of resolution- and g-factor-maps for individual images. The method is exemplarily applied in T1- and T2-weighted images of the brain, using a UNet and a Variational Network trained with data from the fastMRI project.
Purpose
Ill-posed inverse problems for the reconstruction of undersampled MR data are being increasingly solved in a data-driven manner. The general potential for acceleration of both acquisition and reconstruction time is tremendous. For a translation into clinical practice, however, stability and robustness of uncompromised image quality needs to be ensured. To promote objective quality assessment, we suggest an approach based on local point spread functions to determine resolution maps for images reconstructed by non-linear and non-stationary machine learning models. We tested our method for a straightforward Unet architecture and a Variational Network (VarNet), and complemented the evaluation by the determination of g-factor-maps.Methods
A Unet- and a VarNet-architecture were trained using the brain multicoil training dataset of the NYU fastMRI initiative database (fastmri.med.nyu.edu, [1, 2]) and the according publically available benchmark implementations [3]. Exemplary raw data (T1, T2) of a brain examination performed in our department - which was in accordance with the MR protocol of the training data - were then obtained and subjected to the following procedure to determine local resolution (see Fig. 1, [4]):Raw data (T1 and T2) were retrospectively subsampled using equidistant read-outs in phase encoding direction and a fully sampled central area of 8% (total acceleration R=4). Data were initially reconstructed via the trained Unet/Varnet. Subsequently, a single pixel was manipulated by a perturbation [5, 6] of small amplitude and original complex phase (local linearity for the applied amplitude was checked in separate extensive simulations). Data were then transformed back to k-space and the original sampling mask was applied. After applying the data driven reconstruction (Unet/Varnet) again, the initial (un-perturbed) image was subtracted from the latter, yielding a local point spread function (PSF) for the manipulated pixel. This procedure was repeated for all pixels of the image, and the width $$$w$$$ of the mainlobe of each local point spread function at 64% of the maximum amplitude was used as a measure of local resolution. $$$w = 1$$$ corresponds to the ideal resolution as set by k-max, any $$$w>1$$$ was interpreted as blurring. Local resolution were depicted as color encoded maps for a specific reconstruction of an individual image.
In addition, g-factor maps were determined using the multi-replica technique as presented in [7]. Noise correlation was measured to enable 1000 repeated reconstructions, each with additional unique but authentic noise. From the obtained stack of images standard deviations were determined in each pixel $$$i$$$ to derive the spatially resolved g-factor:
$$g_i = \frac{std(recon_i)}{std(noise_i)\sqrt{R}}$$
For comparison, a GRAPPA reconstruction (R=4) was furthermore subjected to the suggested procedures.
Results
Figure 2 shows resolution- and g-factor maps together with reconstructed images for the test images with T2-contrast. Figure 3 depicts corresponding maps and images for T1. The Unet reconstruction suffers from systematic errors (see red arrows), which are not present in the images obtained by VarNet. Resolution maps show a slight increase of $$$w$$$ for a number of pixels in Unet and Varnet. The g-factor maps reveal denoising for areas of constant magnitude and elevated noise at edges. Varnet shows slightly higher g-factors with respect to Unet. Resolution and g-factor maps for GRAPPA do not reflect image structures, but show the classical picture with g-factors of typical amplitude for the given setup.Discussion
The presented approach provides a quantitative means to evaluate machine learning driven MR reconstruction techniques. Perturbing images in a linear range of the reconstruction method allows mimicking classical tools for the objective classification of imaging systems. This technique can help transferring methods into clinical application. With minor shortcomings with respect to the image quality of the fully sampled reference and the absence of clear systematic errors, VarNet reconstructions appeared stable and robust in our experiments of 4 times accelerated imaging in the head. Future work will include a comparison with model-based approaches and the investigation of sampling patterns with decreased sampling density towards the periphery of k-space, as frequently exploited for model- and data-driven acceleration.Acknowledgements
We acknowledge support from the German Ministry for Education and Research under Research Grant 05M20WKA.We further thank Facebook AI Research (FAIR) and NYU Langone Health for making MR raw data and source code openly available.References
[1] Knoll et al. Radiol Artif Intell. 29;2(1):e190007, 2020 [2] Zbontar et al. https://arxiv.org/abs/1811.08839, 2019 [3] https://github.com/facebookresearch/fastMRI/ [4] Wech et al. Med Phys., 39(7):4328-38., 2012 [5] Fessler et al. IEEE Trans. Image Process., 5(9), 1346-1358, 1996 [6] Chan et al. Magn Reson Med. 86(4):1873-1887, 2021 [7] Robson et al., Magn Reson Med. 60(4):895-907, 2008Figures
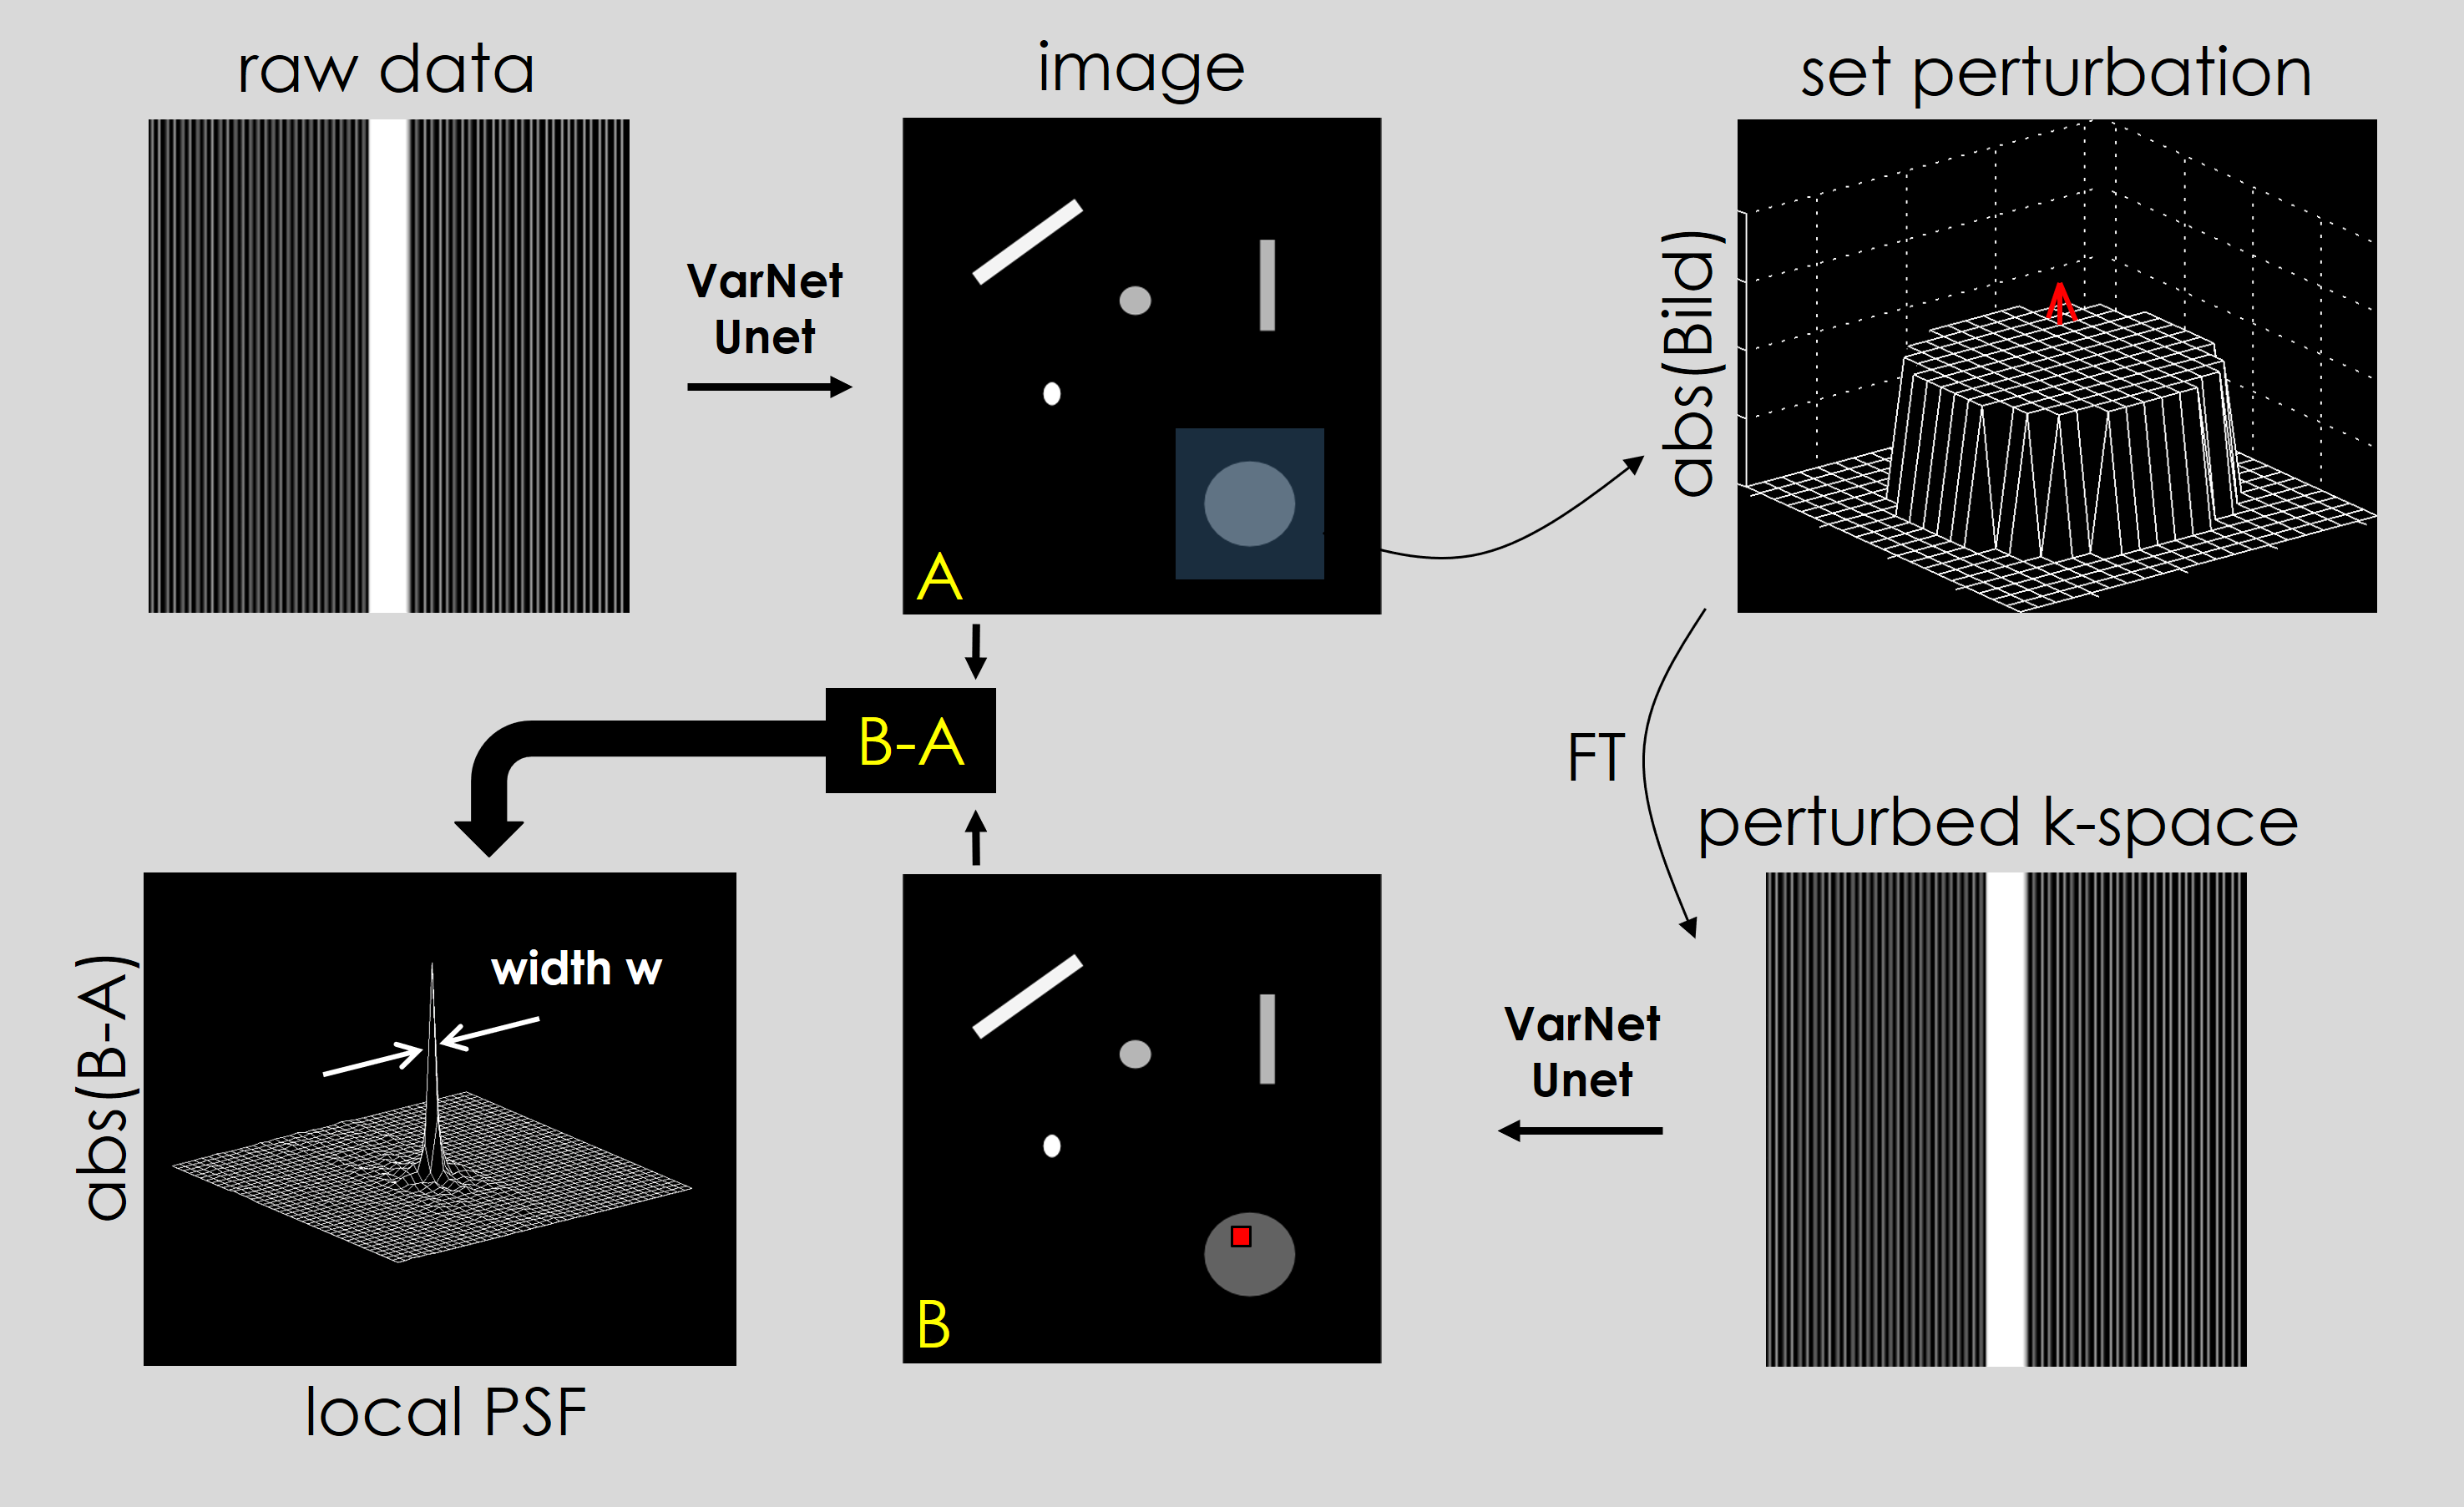
Figure 1: Illustration of the proposed procedure to determine local point spread functions, which are ultimately used to derive the local resolution within an indivdual image.
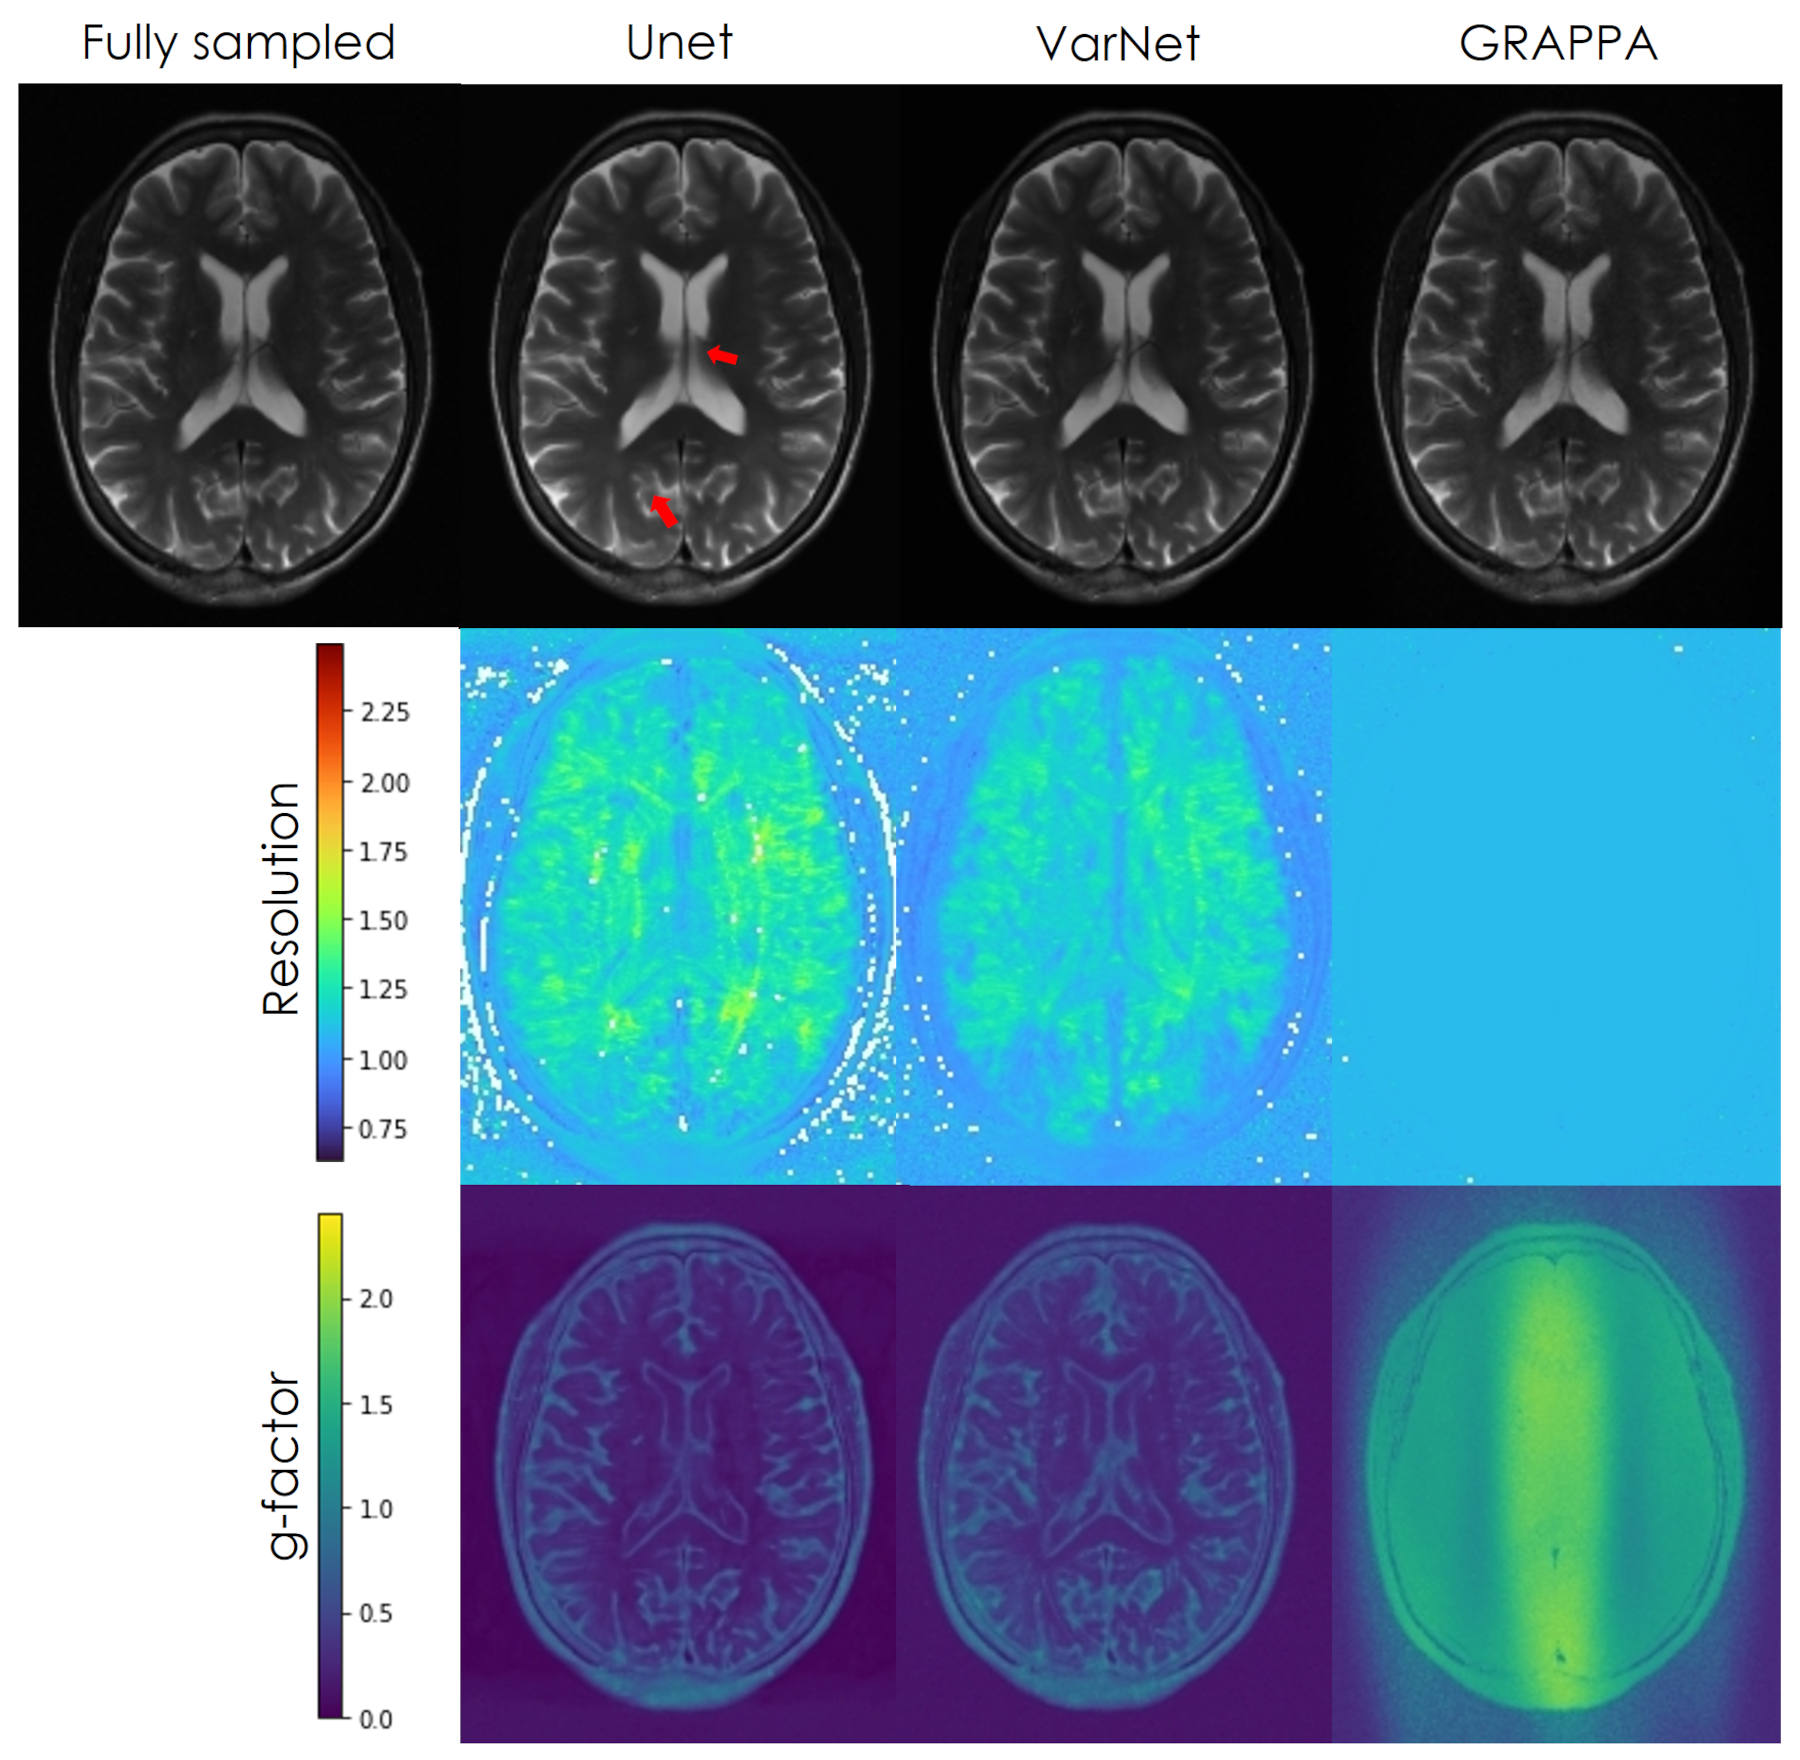
Figure 2: Resolution- and g-factor-maps for a T2-weighted image acquired in an exemplary subject.
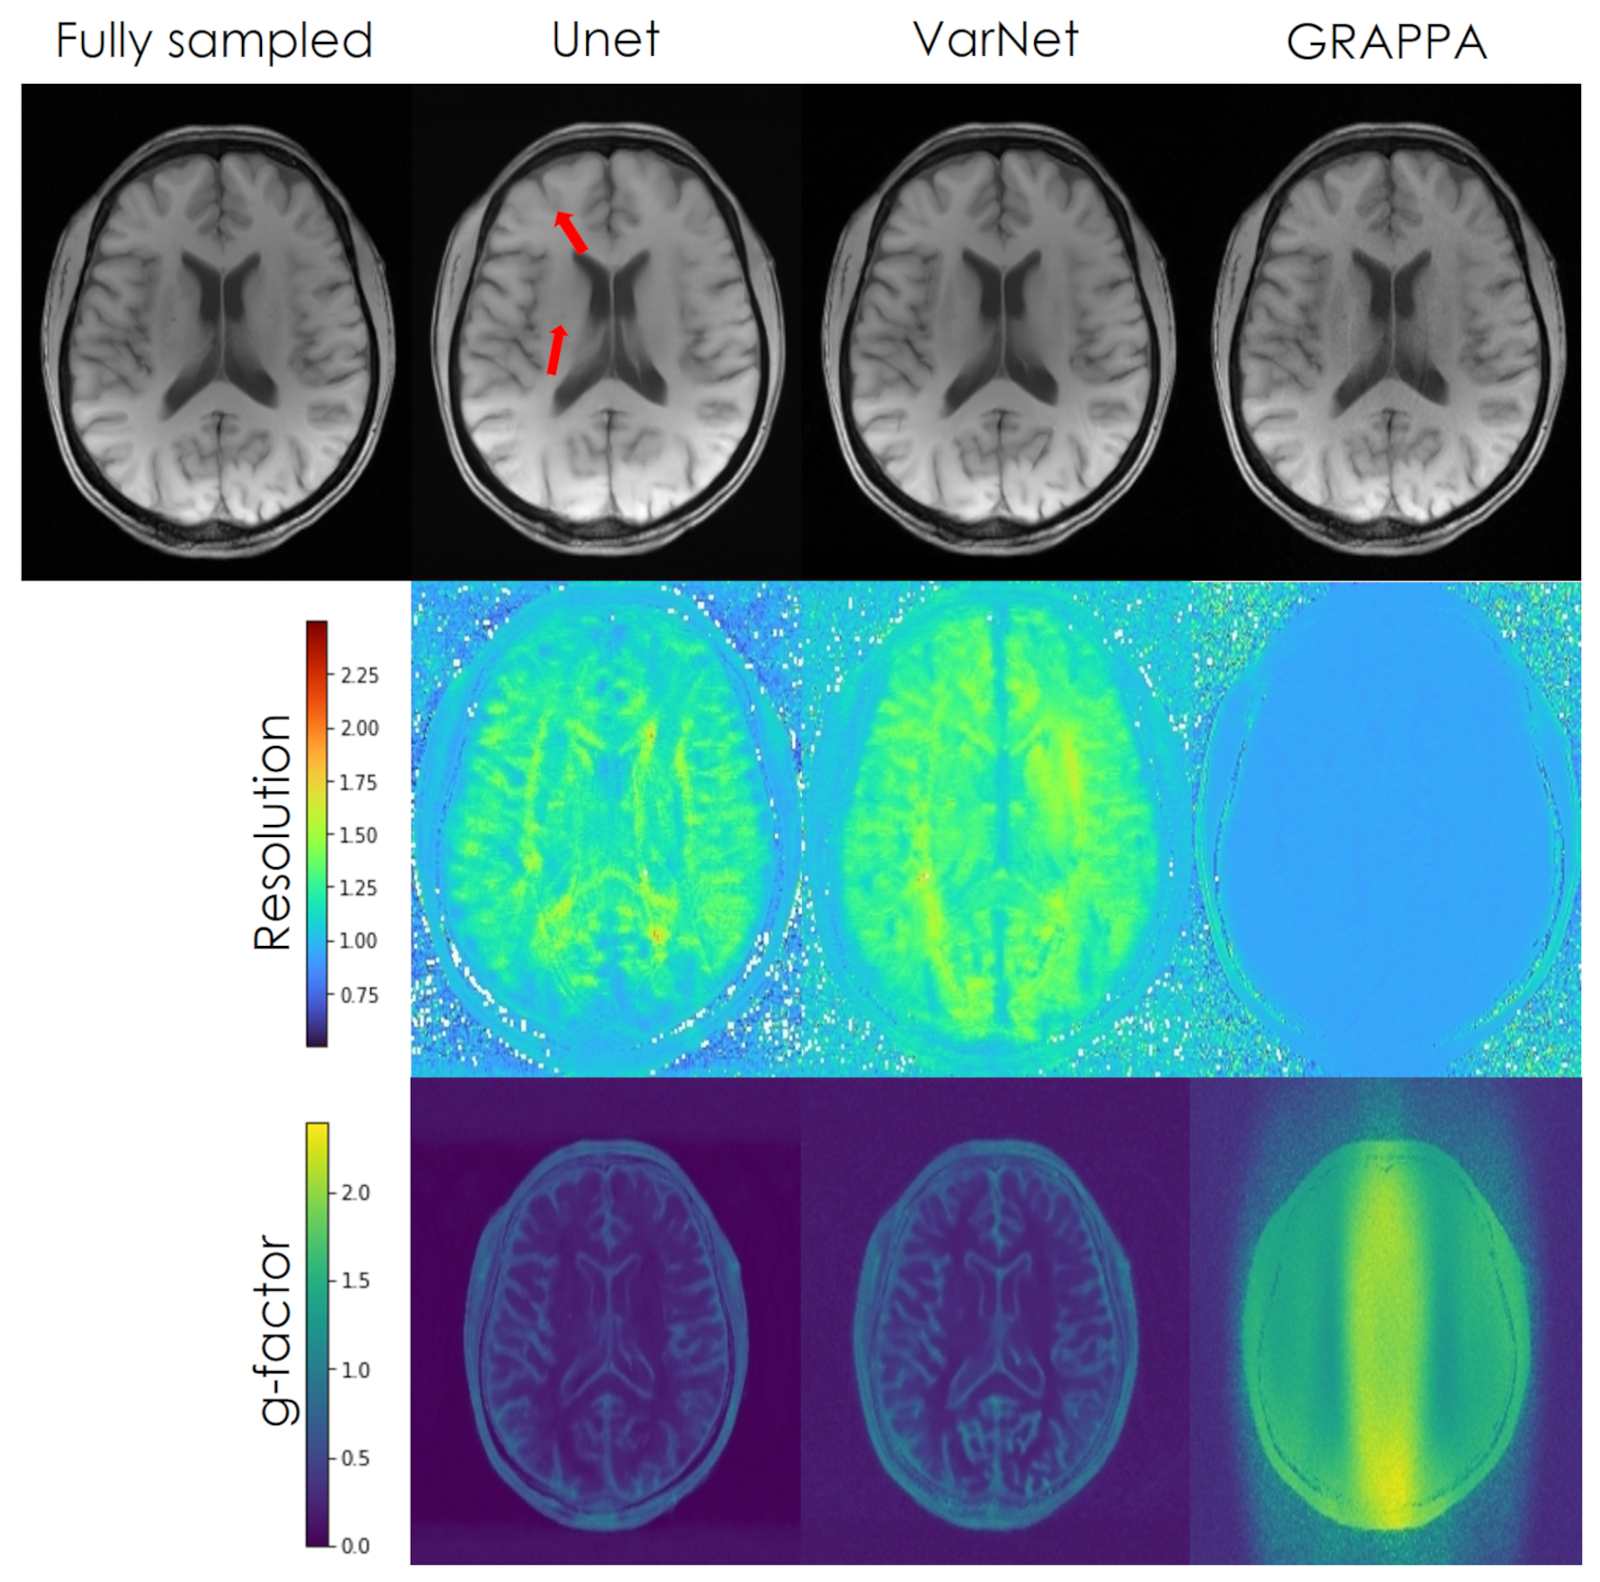
Figure 3: Resolution- and g-factor-maps for a T1-weighted image acquired in an exemplary subject.
DOI: https://doi.org/10.58530/2022/0303