0302
T2-deblurred deep learning super-resolution for turbo spin echo MRI1Biomedical Imaging Research Institute, Cedars-Sinai Medical Center, Los Angeles, CA, United States, 2Department of Bioengineering, University of California, Los Angeles, Los Angeles, CA, United States, 3Department of Developmental Biology, University of Pittsburgh, Pittsburgh, PA, United States
Synopsis
Deep learning MR super-resolution (SR) is a promising approach to reduce scan time without requiring custom sequences and iterative reconstruction. However, previous SR approaches are incompatible with turbo spin echo (TSE) sequence due to differences in T2 blurring effects between high-resolution and low-resolution TSE images. Here we propose a T2-deblurred deep learning SR model for 3x3 in-plane super-resolution of 3D TSE images. Our method accelerated scanning by 9x in both retrospective and prospective testing and provided better image quality than previous SR methods.
Introduction
Deep learning MR super-resolution (SR) is a promising approach to reduce scan time without requiring custom sequences and iterative reconstruction. Previous SR approaches1,2 have been primarily applied to gradient echo sequences, for which lowering the nominal resolution at the scanner can be reasonably modeled by simple k-space truncation. However, lowering the nominal resolution of other sequences such as turbo spin echo (TSE) requires modifying echo times and echo trains, which in turn modifies the T2 effects of the point spread function (PSF). SR models trained only on k-space truncated labels do not account for this additional T2 blurring, presenting a challenge for prospective application of SR models to TSE images.In this work, we propose a T2-corrected deep learning SR model for 3x3 in-plane super-resolution of 3D TSE images. We tested our model both retrospectively and prospectively on mouse embryo images. Mouse models are important in modeling human diseases and developing therapeutic strategies, because mice and humans share related physiology, anatomy and genes3. However, sub-50-micron 3D TSE for phenotyping mouse embryos requires 15 hours to acquire. Our 3x3 super-resolution model shortens the acquisition time to 1.7 hours.
Background
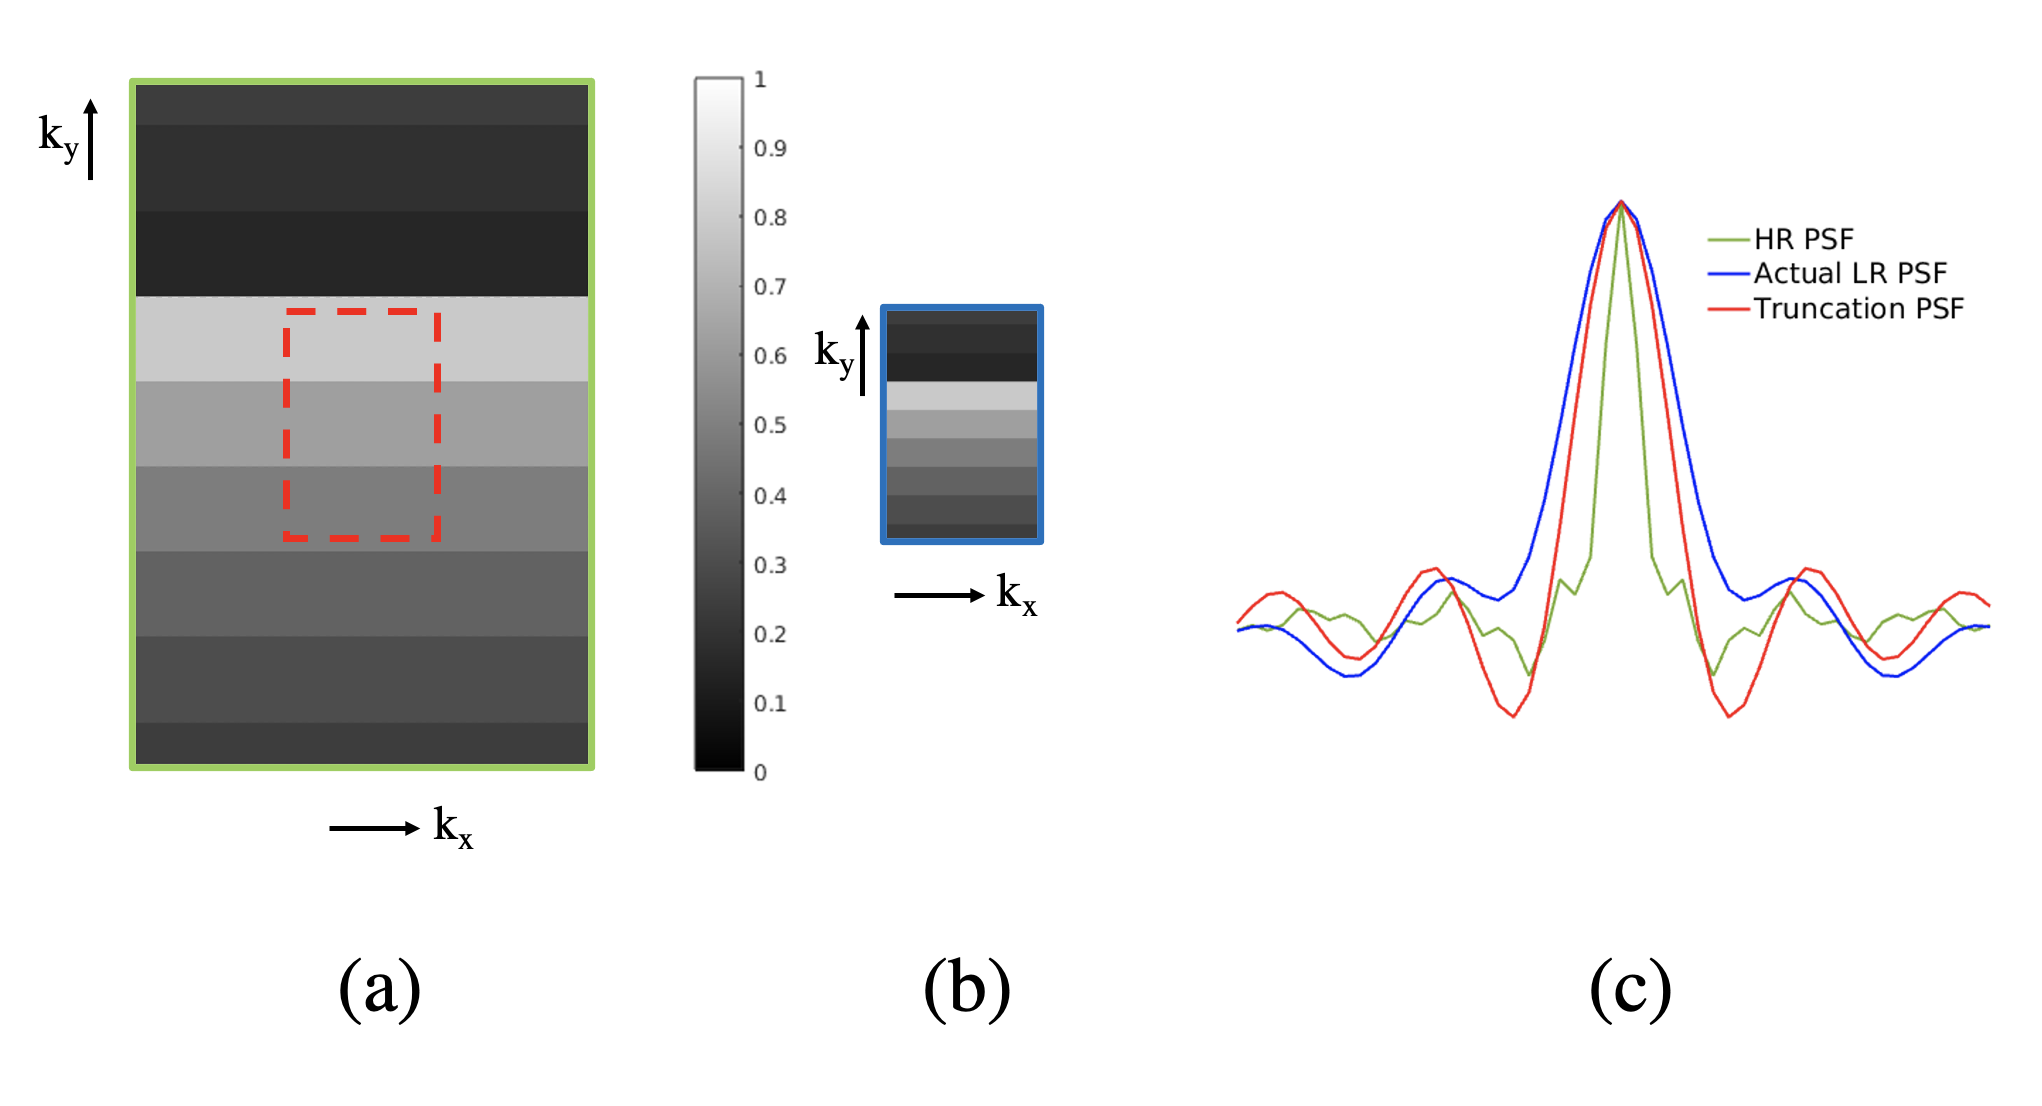
In TSE acquisitions, different regions of the acquired k-space have different echo times (TEs), creating a T2-dependent PSF in the image domain (Figure 1). Echo train differences between high-resolution (HR) images and prospectively-acquired low-resolution (LR) images cause different T2 blurring effects between HR and LR images. If LR training images are generated by simply truncating the HR k-space, the T2 weightings of generated LR k-space will be different from the weightings of prospective LR k-space, as demonstrated in Figure 1(b). This causes a mismatch between LR training images and prospective LR images. If T2 estimates are known, it is possible to do TSE weighting correction to produce training LR images that have similar T2 blurring patterns as prospective LR images.Methods
Data acquisition for training and retrospective testingHigh-resolution ex-vivo mice embryo MRI was carried out on a 7T Bruker scanner with a 3D TSE sequence (ETL=8). Each scan took 15 hours (FOV=40x14x9 mm3, matrix size=1024x304x196), with a spatial resolution of 39x46x46 μm3. A total of 60 litters were imaged for a total of over 300 embryos. One litter was also scanned in LR with 3x3 lower in-plane resolution (matrix size=1024x101x65, spatial resolution=39x138x138 μm3, scan time=1.7 hours) to estimate typical T2 values.
Image preprocessing
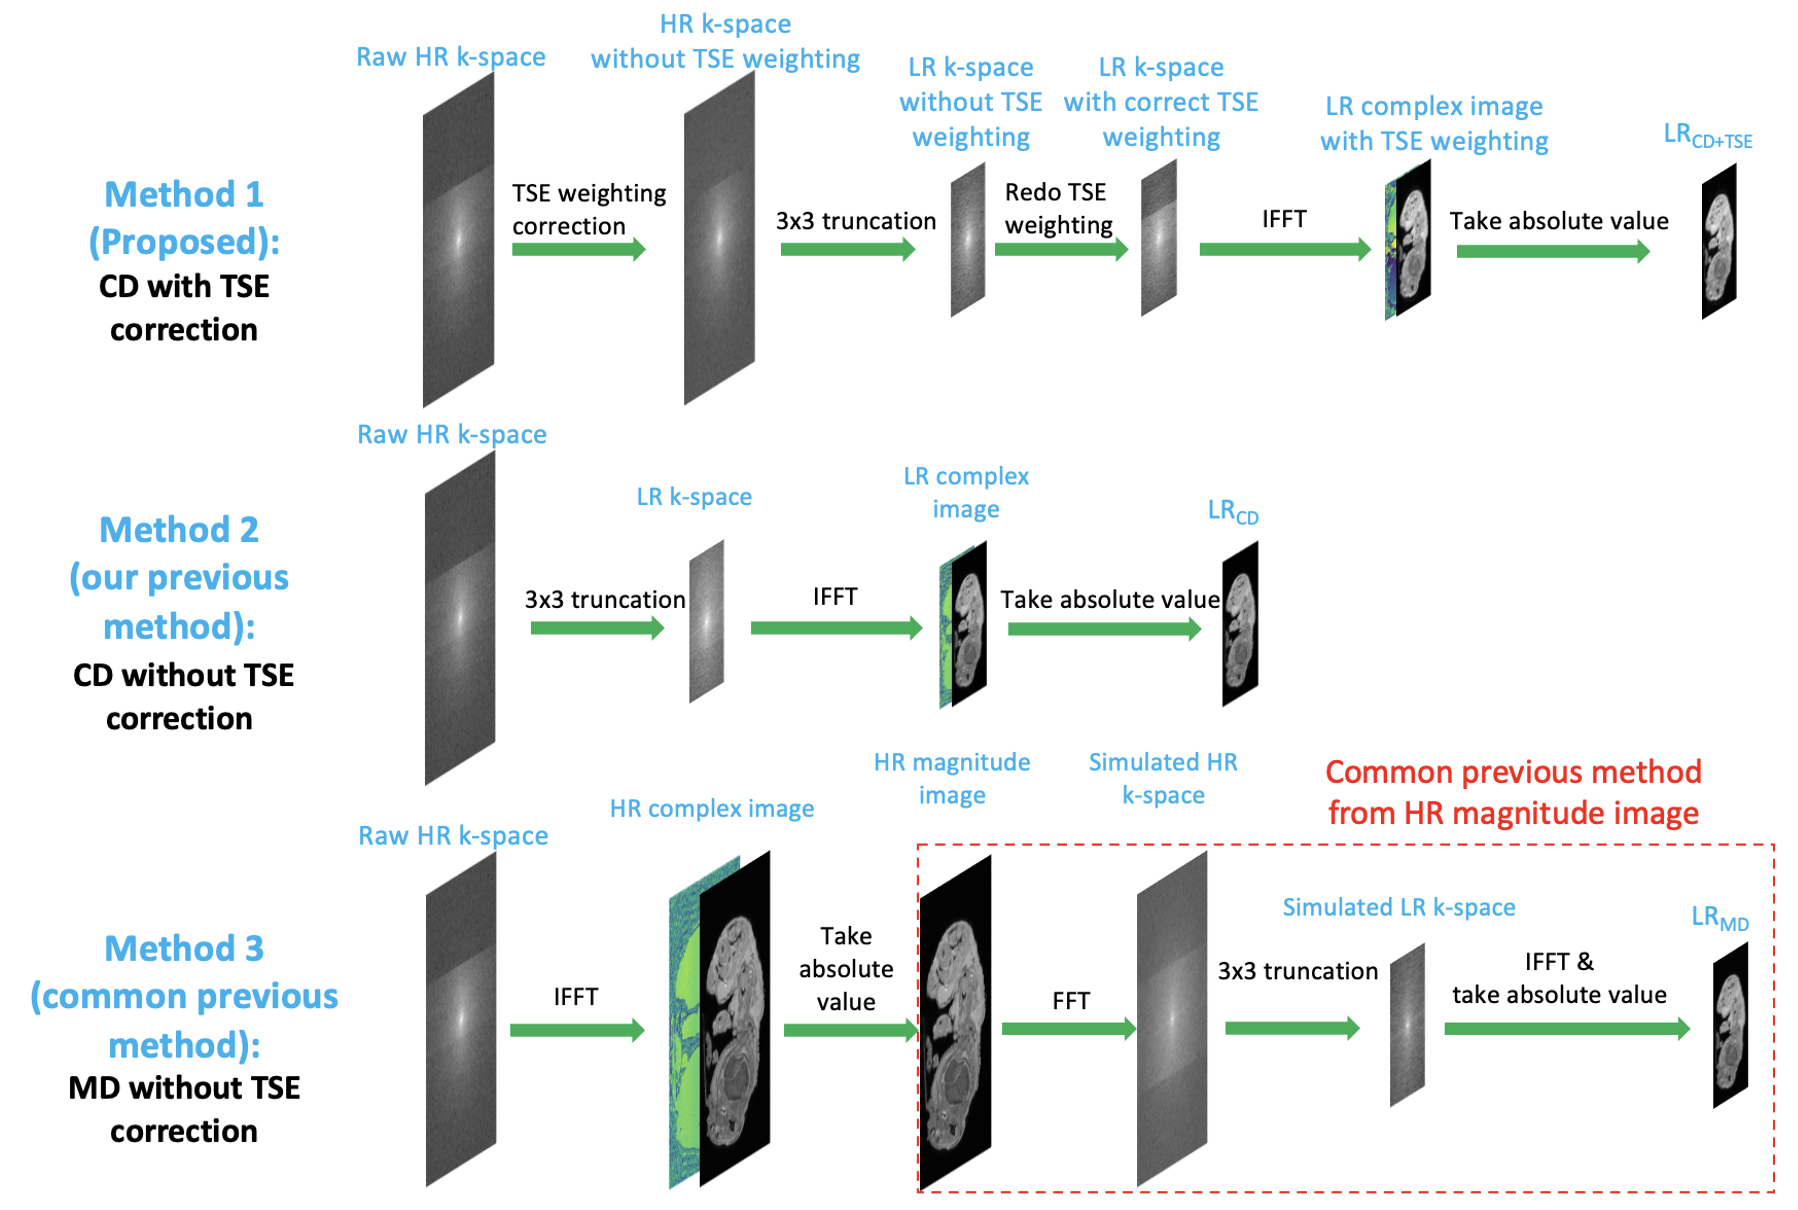
Resolution was degraded in the two phase-encoding directions. Our proposed T2-corrected model generated T2-blurred LR training images with complex resolution degradation (CD), as is shown in Figure 2 method 1. The HR TSE weighting was removed and the new LR TSE weighting was re-imposed using the estimated T2 (52 ms). Two additional models (Figure 2 method 2&3) that represent our previous T2-uncorrected CD-trained method4 and more-common magnitude degradation (MD)-trained methods1,5 were also trained and tested for comparison. For all three methods, the super-resolution factor is 3x3.
Network Architecture and Training
The network architecture is a super-resolution generative adversarial network (SRGAN)4. Among 60 scans, 48 cases were used for training, 6 for validation, and 6 for testing, corresponding to 24576, 3072 and 2960 slices. The loss functions were the mean absolute error (MAE) in the generator and GAN loss in the discriminator.
Retrospective Testing
Quantitative image analysis (PSNR, SSIM and NRMSE) between SR images and HR ground truth was performed among testing slices. The retrospective testing LR images were generated by Method 1 in Figure 2 to resemble the TSE T2 blurring expected in prospective LR images. Image quality scoring from 1 (poor) to 4 (excellent) for sharpness, structure, and diagnostic confidence was also performed by an experienced reader in mouse embryo imaging.
Prospective Testing
An additional litter of mouse embryos was acquired with both HR (15hr) and 3x3 LR (1.7hr) protocols. Prospective SR images of three SR models were generated from the acquired LR images.
Results and Discussion
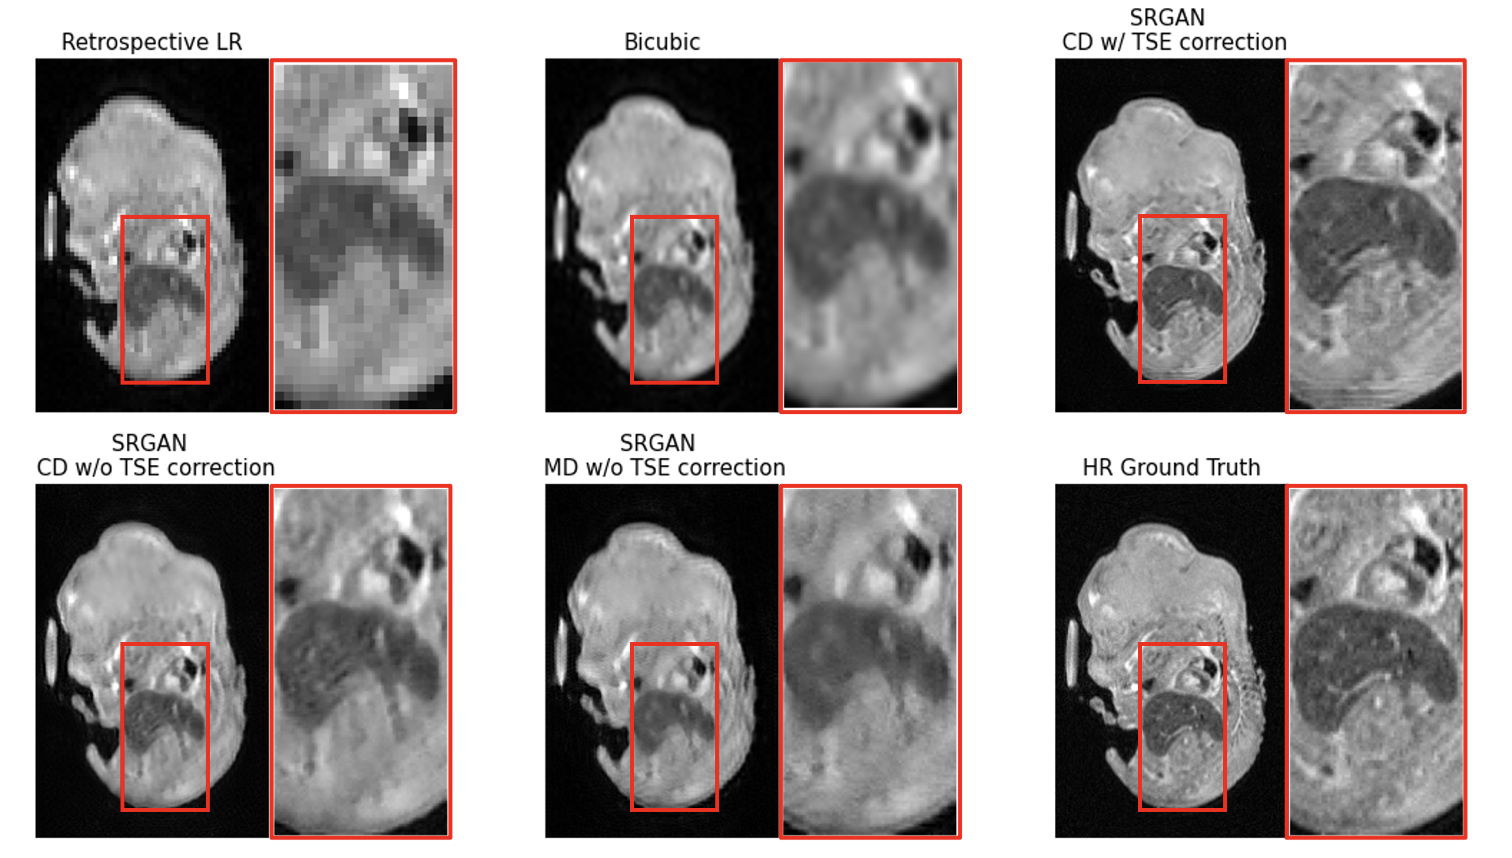
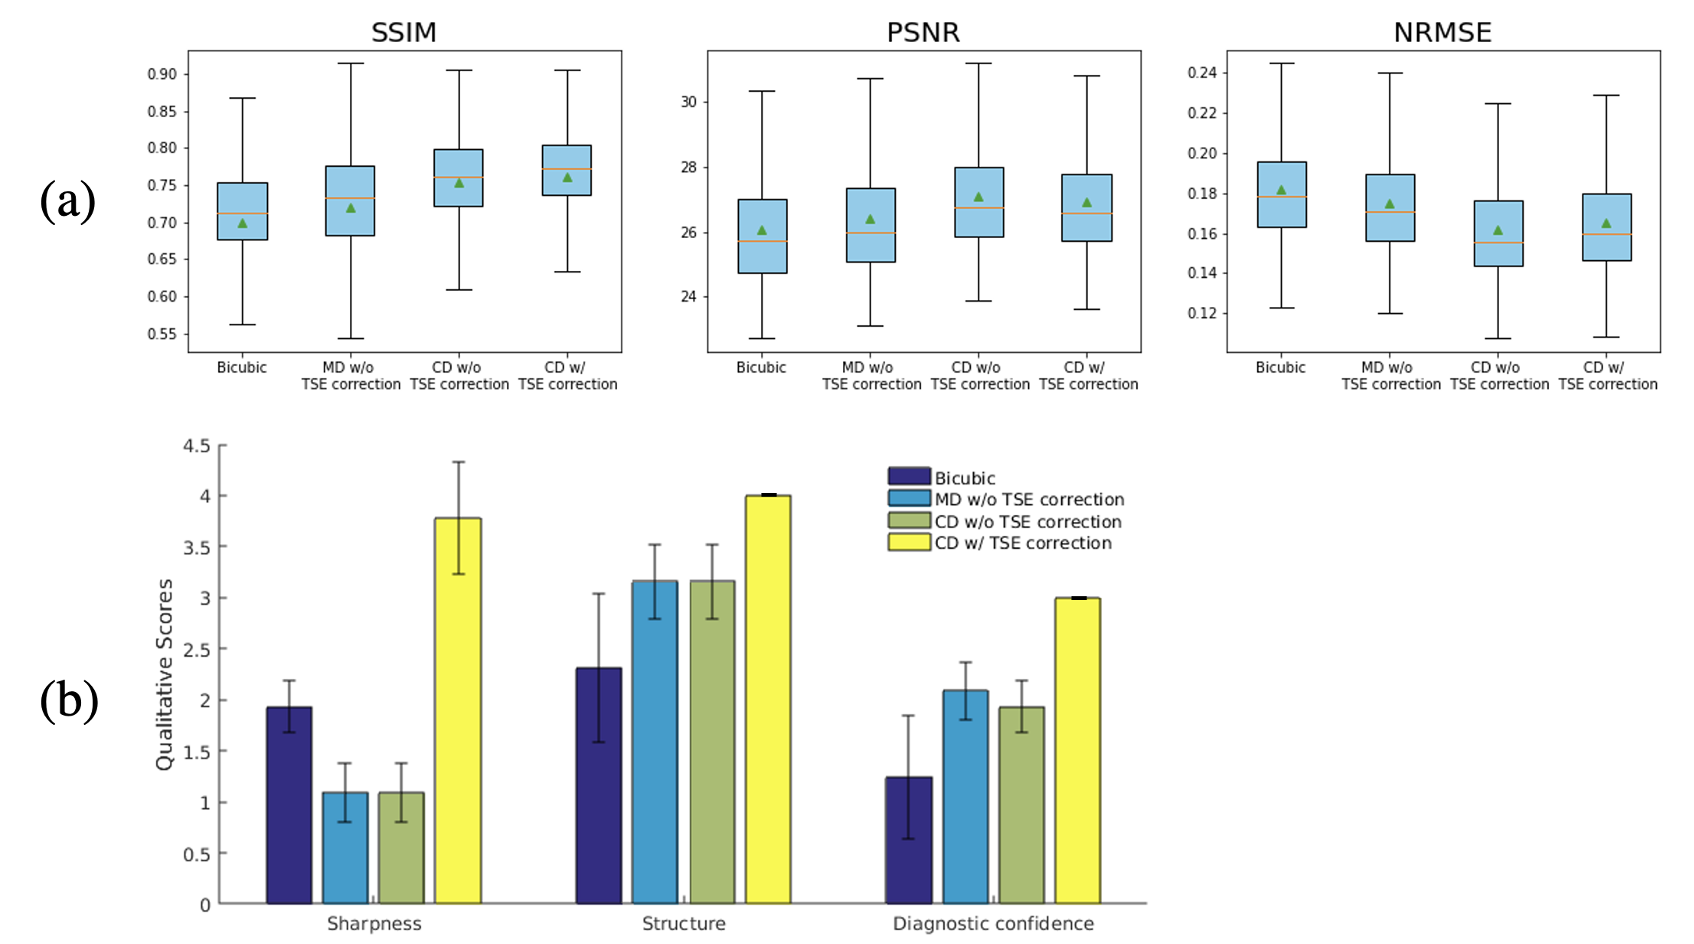
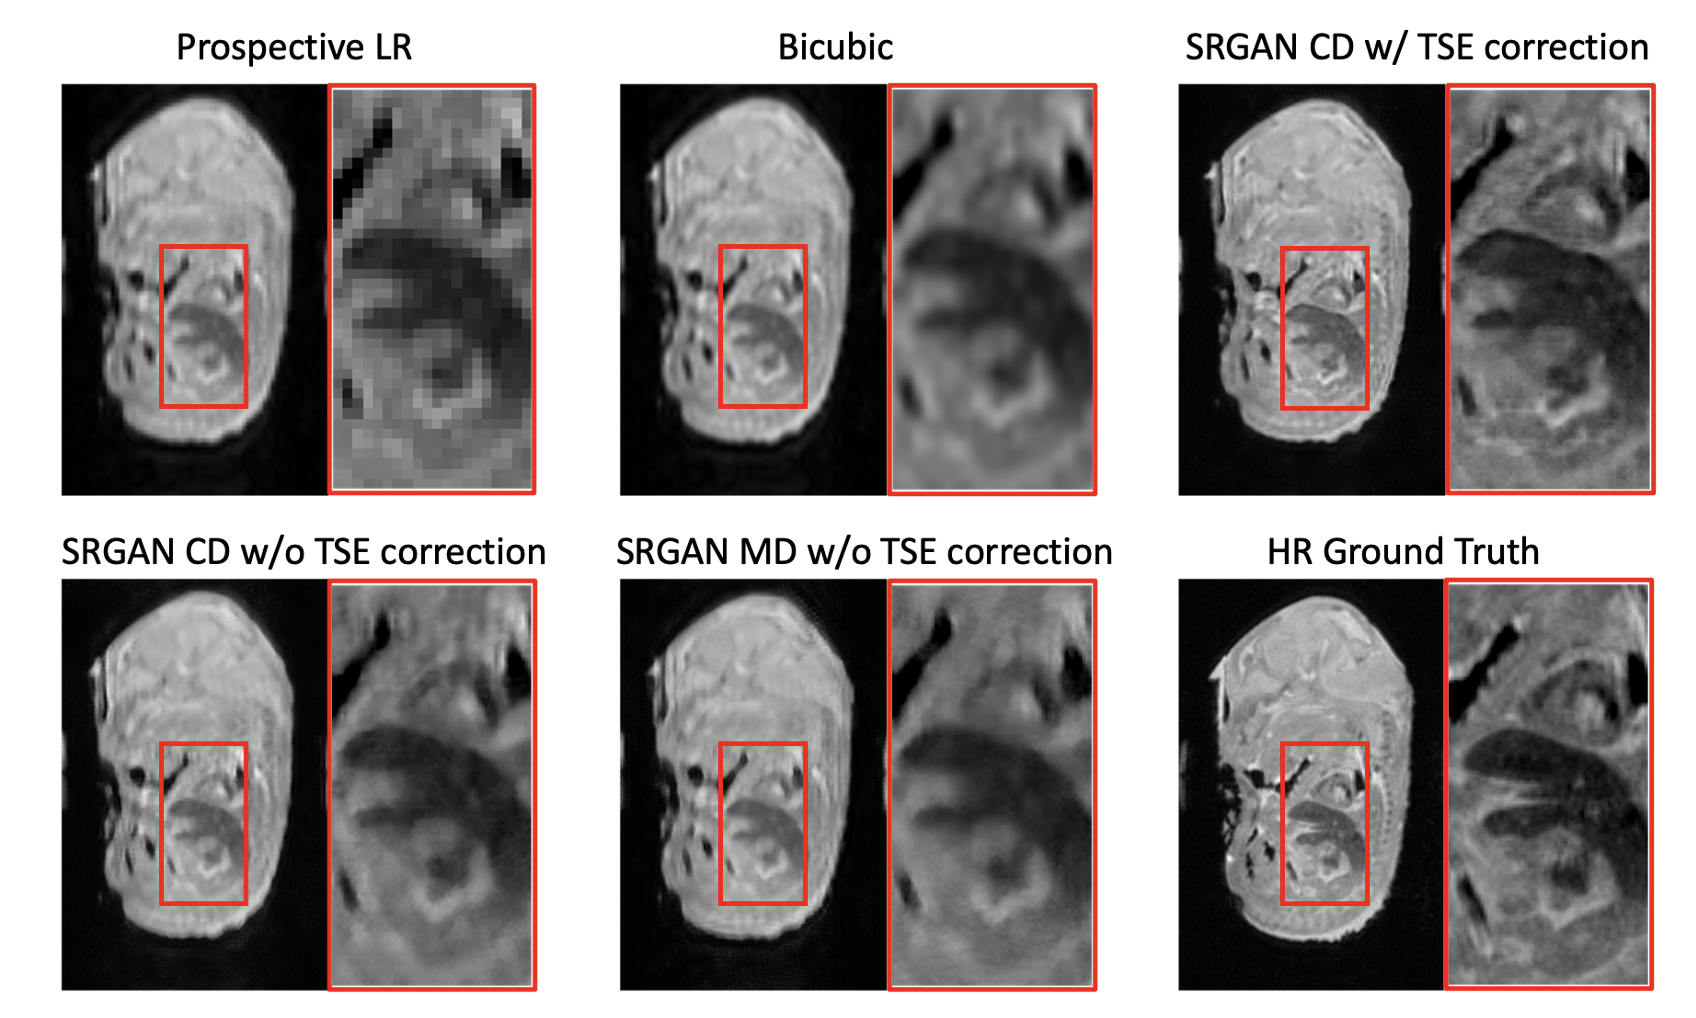
Figure 3 shows one example slice of retrospective testing. The proposed SR method (SRGANCD with TSE correction) generates the visually sharpest image compared to other methods. The boxplots of quantitative image metrics and bar graph of imaging quality scores are shown in Figure 4. The proposed method has the best SSIM (p<0.001), but was surpassed by SRGANCD without TSE correction in PSNR (p<0.001) and NRMSE (p<0.001). However, the proposed method surpassed all other methods in all imaging quality scores (p<0.001). The difference between evaluation methods (error metrics vs. image quality scoring) may be explained by the known discrepancies between quantitative image metrics and perceptual image quality6.Figure 5 shows one example slice of prospective testing. The proposed method still provided the sharpest image with finest details.
In our future work, instead of using a fixed T2 value, we may use a wide range of T2 to augment LR training images and improve the network’s generalizability.
Conclusion
We developed a T2-deblurred deep learning SR method for TSE MRI, which accelerated acquisition by 9x. The proposed method provided better image quality than previous SR methods. For prospectively acquired data, 3x3 super-resolution was feasible using our method.Acknowledgements
No acknowledgement found.References
1. Chen Y, Xie Y, Zhou Z, Shi F, Christodoulou AG, Li D. Brain MRI super resolution using 3D deep densely connected neural networks. 2018 IEEE 15th International Symposium on Biomedical Imaging (ISBI 2018). 2018:739-742.
2. Koktzoglou I, Huang R, Ankenbrandt WJ, Walker MT, Edelman RR. Super‐resolution head and neck MRA using deep machine learning. Magnetic Resonance in Medicine. 2021;86(1):335-345.
3. Wu YL, Lo CW. Diverse application of MRI for mouse phenotyping. Birth defects research. 2017;109(10):758-770.
4. Chen Z, Chen Y, Saini A, et al. Deep learning super-resolution for sub-50-micron MRI of genetically engineered mouse embryos. Proc Int Soc Magn Reson Med. 2021.
5. Lyu Q, Shan H, Wang G. MRI super-resolution with ensemble learning and complementary priors. IEEE Transactions on Computational Imaging. 2020;6:615-624.
6. Blau Y, Michaeli T. The Perception-Distortion Tradeoff. 2018 IEEE/CVF Conference on Computer Vision and Pattern Recognition. 18-23 June 2018 2018:6228-6237.
Figures