0296
31P multi-echo imaging with low B1+ dual-band refocusing pulses1Department of Radiology, University Medical Center Utrecht, Utrecht, Netherlands
Synopsis
We developed a multi-echo sequence to detect phosphomonoesters (PME) and phosphodiesters (PDE), aiming for high signal-to-noise and T2-contrast to noise ratio per unit of time, with the constraint of a maximum available B1 of ~15μT. In line with MRI, the candidates were multi-echo MRSI with 180° pulses (full refocusing) and fast spin echo (FSE) with modulated variable flip angles. Multi-echo MRSI resulted in higher SNR at the same SAR level compared to a FSE with modulated refocusing flip angles. Using 9 dual-band echo pulses improved the SNR for PDE and PME more than two-fold compared to the FID signal alone.
Purpose
31P MRS can spectrally resolve phospholipid metabolites involved in phospholipid metabolism which are altered in many cancers1. 7 Tesla facilitates the detection of PMEs (phosphocholine (PC), phosphoethanolamine (PE)) and PDEs (glycerophosphocholine (GPC), glycerophosphoethanolamine (GPE)) with increased SNR and spectral resolution. Multi-echo MRSI allows T2‐weighted SNR enhancement, for an increased metabolite sensitivity, or T2 information per metabolite2,3. In MR imaging, a widely incorporated method to increase SNR per unit of time is the use of three-dimensional FSE with modulated refocusing flip angles (FA)4,5. This employs a long echo train length (ETL; more than 100 in the brain) using variable, low FAs . We aimed to transfer this method to 31P MRS imaging. We simulated the use of variable FAs FSE in the 31P regime as a new approach for gaining SNR per unit of time within specific absorption rate (SAR) limits. The results were compared with a multi-echo technique with full refocusing pulses. However, the block pulses for this purpose require a high B1 (i.e. much higher than 15μT which is maximal available with our 31P body-coil) to excite the frequency range of interest. As a solution, we have designed a dual-band refocusing pulse to be used at a maximum available B1 of ~15μT6. This pulse selectively hits the two frequency ranges of interest (PDEs and PMEs) with the potential utilization for multi-echo sequences with more than 100 echo pulses. Finally, we implemented the dual-band pulse in a multi-echo MRSI sequence and validated the approach in a phantom and in vivo.Methods
SimulationsWe simulated the effect of extending the ETL on the PDE and PME signals by using refocusing FA modulated FSE technique5. T1 and T2 of the metabolites used in simulation are listed in Figure 1A. TR=5.5s, nominal FA=15, maximum FA=130, and echo spacing=15ms. Weighted average SNRwa was calculated as in Eq. 1.
$$$S_{wa}=S_{0}\frac{1+2\sum_1^nS_{i}w_{i}}{1+2\sum w_{i}}, SNR_{wa}=\frac{S_{wa}}{\sigma_{wa}}=SNR_{0}\frac{1+2\sum_1^nS_{i}w_{i}}{\sqrt{1+2\sum w_i^2}} $$$ Eq.1
Where S0, SNR0, wi, Swa and σwa represent free induction decay (FID) signal, FID SNR, signal weight, weighted average signal and noise, respectively. The signal itself was used as signal weight. To compare, SNRwa and SAR of a multi echo sequence with full refocusing 180s with the same echo spacing of 15ms and the same number of echo pulses (100) was calculated as previously described2. FA squared was calculated as an alternative to SAR.
Data Acquisition
MRS measurements were carried out on a 7Tesla MR system (Philips, Best, NL) equipped with a double tuned 1H/31P head coil. We acquired spectra from a phantom containing PME, PDE and inorganic phosphate (Pi) and from a healthy volunteer (female, 28yrs). The AMESING2 sequence (multi-echo) was modified such that the excitation was performed by a block 90° pulse, followed by 180° Shinnar-LeRoux dual-band refocusing pulses (7ms) at 14.8 μT, with two refocusing bandwidths of 166Hz to hit the PDE and PME at 3.0-3.5 ppm and 6.2-6.8 ppm, respectively. A single FID by means of a pulse-acquire and 5 and 9 full echoes in one k‐space step where acquired while k‐space data were sampled spherically. As a reference, we performed the same experiments on a phantom using the sequence with adiabatic pulses requiring high B1 of ~100μT, which could only be obtained on the phantom surface with a homebuilt dual-tuned surface coil set-up2,7. (B1,rms+)2 of the dual-band and adiabatic pulses were calculated as:
$$$SAR\propto(B_1,rms^+)^{2}=\frac{1}{T_{dur}}\int_{0}^{T_{dur}}B_1^+(t)^{2}dt$$$ Eq.2
All multi-echo MRSI experiments were performed with a matrix size of 8×8×8, isotropic resolution 20 mm, 1 average, 256 data points, spectral width 8200 Hz, ΔTE 45 ms (3-fold larger than simulated to minimize truncation artifacts in spectral domain), TR 5s (in vivo) and 4s (phantom).
Results
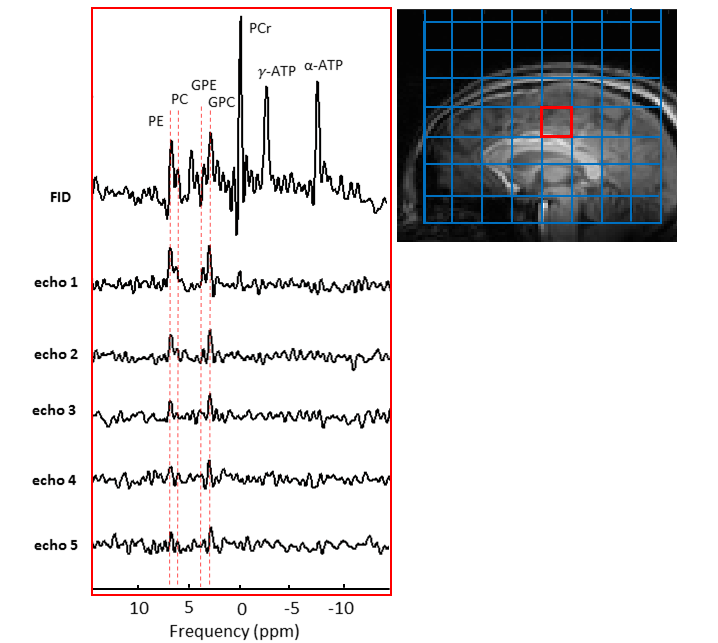
Figure 1 shows the simulated signals of PDE and PME by using modulated FA FSE approach. It produces a refocusing flip angle train that rapidly brings the signals into pseudo-steady-state (PSS) conditions. Figure 2 shows SNR comparison for GPC signal. Multi-echo method with a number of 20 full refocusing 180 pulses resulted in SNR weighted average of 2.13 (considering T1 relaxation effect). FSE with modulated FAs gave an SNR weighted average of 1.76 at the same FA squared of 673. The spectra acquired from the adiabatic and dual-band ME implementations are shown in Figure 3A and B. Using just 9 pulses increased SNR by more than a factor of 2 (Figure 3D). Figure 4 shows 31P spectra from the brain with PDE and PME signals being refocused by each echo pulse.Discussion and Conclusion
Simulations showed that we can achieve higher SNR with a full 180 multi-echo sequence than a modulated FAs FSE sequence. Compared to the imaging FSE implementation, the echo spacing in our 31P FSE is much longer (15ms vs 3ms) resulting in signal loss due to T2 relaxation. Using the very low power dual-band pulses, within a TR of 5s the number of echo pulses could be increased when compared to adiabatic pulses ((B1,rms+)2 of 0.246µT2 compared to 62.277µT2), which would result in higher SNR. In addition to increased SNR, T2 information of the metabolites can be estimated with this implementation. The in vivo results indicated the feasibility of using low power 31P dual-band pulses in multi-echo approaches instead of high power demanding adiabatic pulses.Acknowledgements
We acknowledge funding EU-Eurostars! 12921 VM-Biopsy.
References
[1] Glunde K, Bhujwalla ZM, et al., Choline metabolism in malignant transformation. Nat. Rev. Cancer, 2011; 11: 835–848.
[2] van der Kemp WJM, Boer VO, et al., Adiabatic Multi‐Echo P Spectroscopic ImagiNG (AMESING) at 7 tesla for measuring transverse relaxation times and regaining sensitivity in tissues with short T2* values. NMR Biomed. 2013; 26:1299–1307.
[3] van Houtum Q, Welting D, et al., Low SAR 31P (multi-echo) spectroscopic imaging using an integrated whole-body transmit coil at 7T. NMR in Biomed. 2019;
[4] Busse R, Hariharan H, et al., Fast Spin Echo Sequences With Very Long Echo Trains: Design of Variable Refocusing Flip Angle Schedules and Generation of Clinical T2 Contrast. MRM, 2006; 55:1030–1037.
[5] Busse R, Brau A, et al., Effects of Refocusing Flip Angle Modulation and View Ordering in 3D Fast Spin Echo. MRM, 2008; 60:640–649.
[6] Klomp DWJ, van de Bank BL, et al., 31P MRSI and 1H MRS at 7 T: initial results in human breast cancer. NMR Biomed, 2011; 24: 1337–1342.
[7] Shams Z, Wiegers EC, van der Kemp WJM, Klomp DWJ, Wijnen JP, 31P dual-band pulse for selective refocusing of phosphomonoesters and phosphodiesters at low B1 and low SAR. In Proceedings of the 31st Annual Meeting ISMRM, 2021; 4569.
Figures
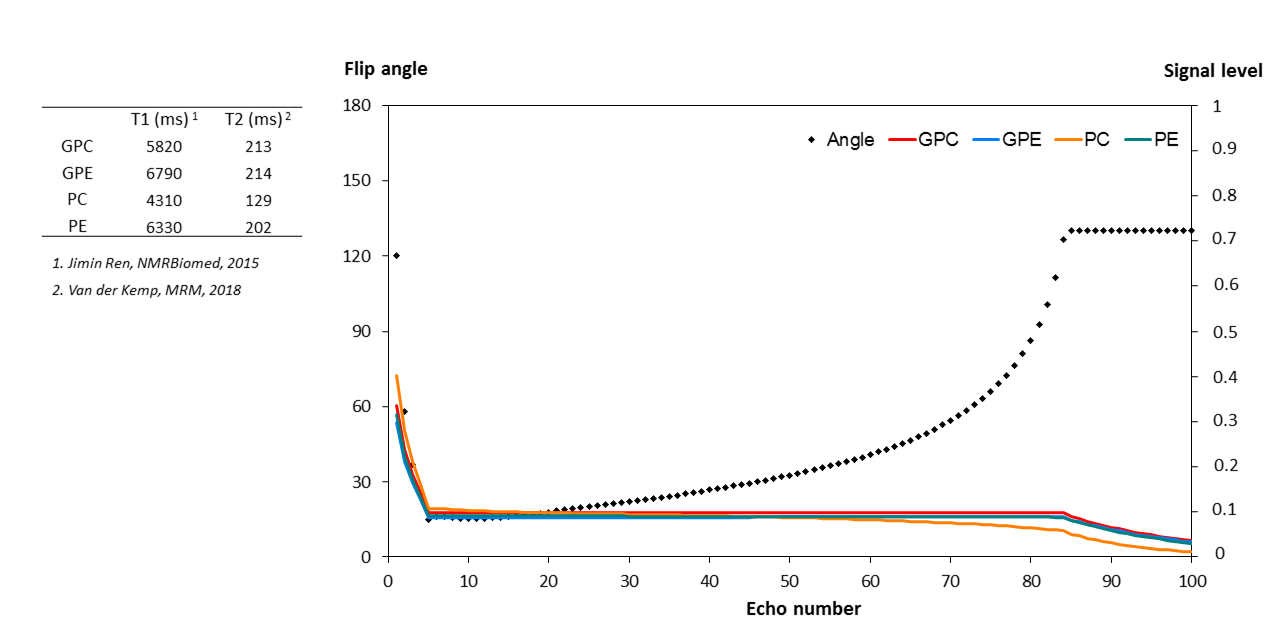
Figure 1. Simulated signals of GPC,GPE, PC and PE, and modulated FA series. The simulated variable echo train is depicted in black. GPC, GPE and PE signal is constant until 1260 ms (echo 84), the PC signal starts to decrease at ~900 ms. Echo-spacing= 15 ms, TR = 5500 and ETL = 100.
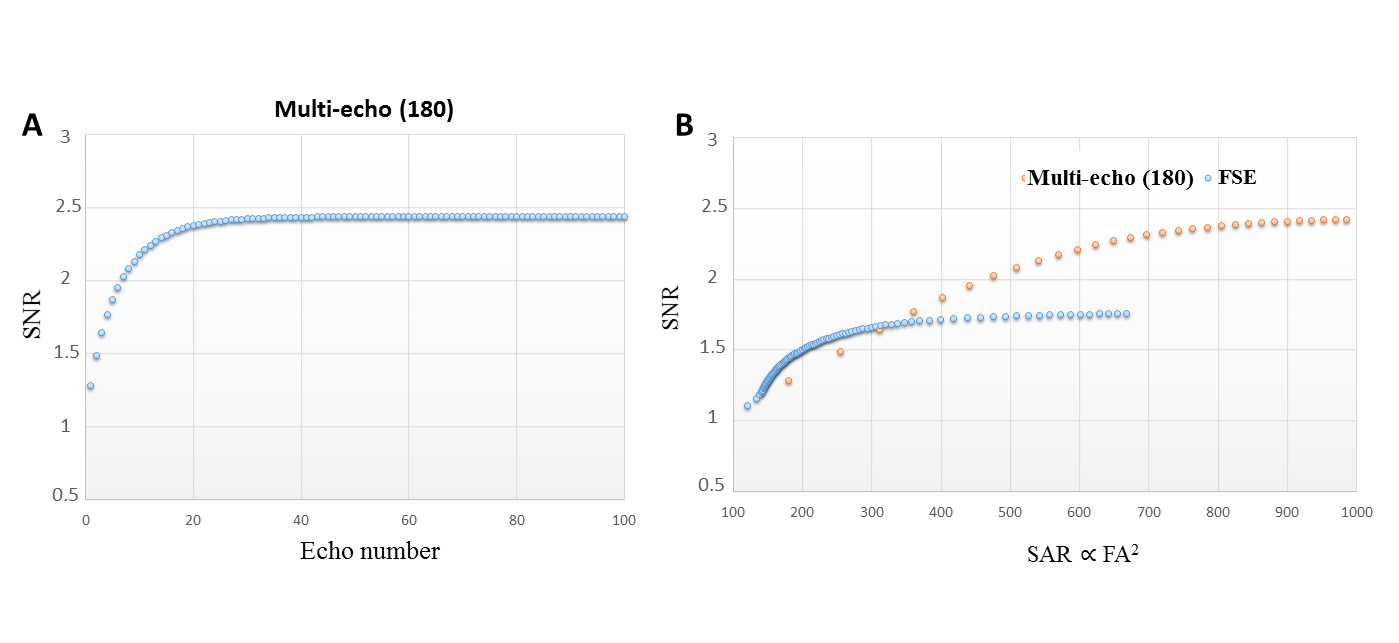
Figure 2. (A) SNR of GPC as a function of number of echo pulses in multi-echo MRSI with 180 pulses. The noise is taken into account with the same T2 decay weighting as the signal. (B) SNR as a function of SAR in multi-echo MRSI compared with FSE with low FAs. SAR is proportional to the square of the flip angle. The maximum SNR of 1.76 was achieved for FSE with maintaining the signal for relatively long time of 1260 ms. SNR values were calculated from Equations 1. For multi-echo MRSI, the maximum SNR Was 2.13 after taking T1 relaxation effect into account.
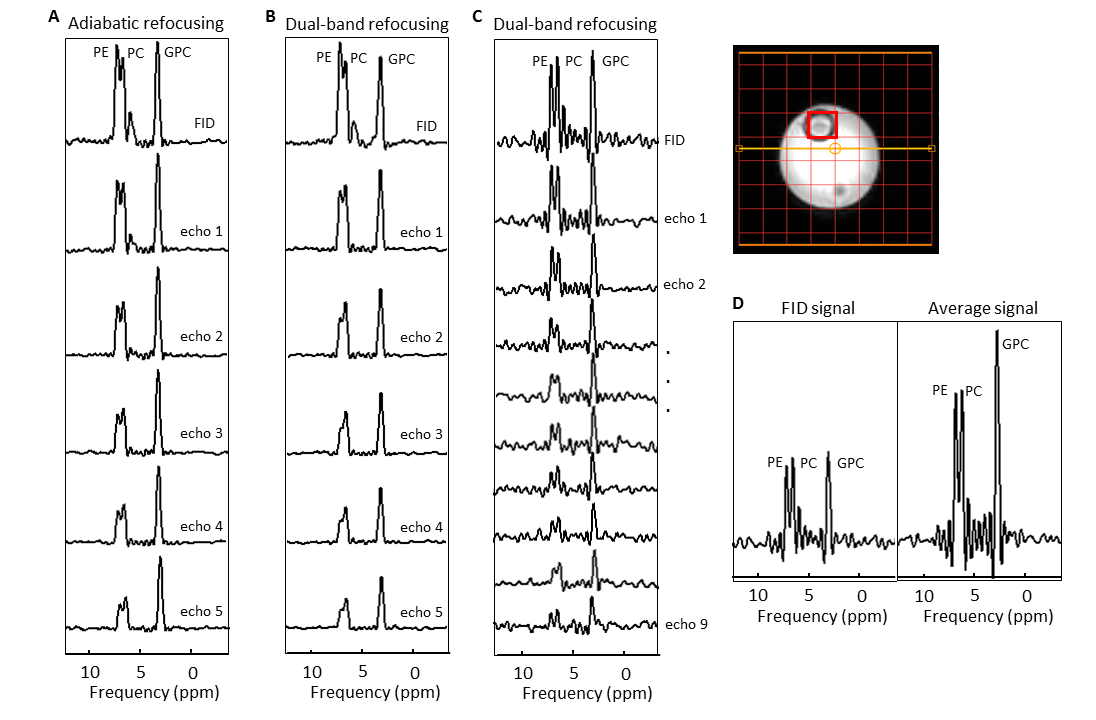
Figure 3. Spectra from a phantom containing PE, PC and GPC using adiabatic (A) and dual-band (B and C) pulses in the multi-echo spectral imaging for the voxel (contains GPC, PC and PE) shown in red. (D) SNR increased by more than 2 after implementing 9 echoes compared to the FID signal. Experiments corresponding to A and B were performed using a surface coil at B1 of ~100μT (adiabatic excitation and refocusing) and B1 of 15μT (block excitation and dual refocusing), respectively. Experiment C was done utilizing a quadrature head coil at B1=15μT.