0295
Clinically feasible B1 field correction for multi-organ sodium imaging at 3T
Michael Vaeggemose1,2, Rolf F. Schulte3, and Christoffer Laustsen2
1GE Healtcare, Broendby, Denmark, 2MR Research Centre, Department of Clinical Medicine, Aarhus University, Aarhus N, Denmark, 3GE Healtcare, Munich, Germany
1GE Healtcare, Broendby, Denmark, 2MR Research Centre, Department of Clinical Medicine, Aarhus University, Aarhus N, Denmark, 3GE Healtcare, Munich, Germany
Synopsis
Sodium (23Na) MRI allows non-invasive examinations of intra-organ sodium concentrations in vivo. B1 field corrections are important determinants of the sodium signal level. However, low signal-to-noise ratio (SNR) in sodium MRI makes accurate B1 mapping in reasonable scan times challenging. The aim of this study is to evaluate Bloch-Siegert off-resonance B1 field correction of sodium images in thigh muscle, heart, kidney, and brain with the use of MRI in healthy human subjects using a 3D FLORET readout trajectory.
Introduction
A challenge for quantitative sodium MRI is the varying transmit and receive B1 fields of the commonly used transmit-receive 23Na surface coils. Compensating for these varying signal levels requires knowledge of the sensitivity profiles, which are according to reciprocity principle [1] the same for transmit and receive at 33MHz. Transmit B1 can be mapped using the Bloch-Siegert off-resonance pulse approach [2], which is reported to be faster, more robust, and yields higher SNR as to the dual angle approach [3]. The aim of this study is to evaluate Bloch-Siegert off-resonance B1 field correction of sodium images in thigh muscle, heart, kidney, and brain with the use of MRI in healthy human subjects using a 3D FLORET readout trajectory.Methods
MRI examinations were performed on a 3T MRI scanner (750 MR, GE Healthcare), allowing proton (1H) MRI as well as sodium (23Na) imaging. A commercial Helmholtz coil pair (PulseTeq) was used for 23Na imaging. Scans were performed at the thigh muscle, heart, kidneys, and brain on 5 healthy subjects. The subjects were scanned twice for evaluation of repeatability with minimum two weeks apart. Sodium phantoms were placed in the field-of-view (32 and 80 mmolL-1, 4% agar) to determine total sodium concentration. The phantoms are placed in the centre of the anterior part of the coil in all scans. Proton anatomical images and B0 maps were acquired.The radio frequency pulses were calibrated (transmit gain and centre frequency) to optimize the sodium imaging acquisition. B1 transmit field map was acquired using a Bloch-Siegert off-resonance approach [2] (+/- 2000 Hz) based on the Fermat Looped, Orthogonally Encoded Trajectories (FLORET) technique [4]. Sodium images were acquired with a 3D-radial-density weighted MR spectroscopic imaging (MRSI) sequence following the trajectory, as described by Nagel et al [5]. Scan parameters of the imaging protocol is listed in Figure 1.The effect of B1 field correction was evaluated based on anatomical structure, repeatability, and signal homogeneity inside certain organs. Repeatability was estimated from signal-to-noise ratios of high concentration phantoms at initial and follow up scan. Accurate anatomical structure was determined from proton images and homogeneity from standard deviations of histogram probabilities. Multiple paired t-tests were performed on repeatability measures and the standard deviations of histogram probabilities form the original and corrected sodium images. The level of significance was adjusted for multiple comparisons with the Bonferroni-Dunn method.
Results
Visual inspection of the B1 field corrected images indicate an increase of sodium signal. Comparison of anatomy based on the sodium and proton images supports the suggestion towards significant benefits of B1 field correction. This is most pronounced in the brain images (Figure 2, A). However, all anatomies seem to show more truthful structures. This is expected as B1 field correction increases accordingly to distance between coil elements and the region-of-interest (ROI). Blood has a high natural abundance of sodium indicated in signal levels of the two cardiac chambers (Figure 2, B), the bone marrow in the ribs (Figure 2, B & D), and large vessels of the thigh muscle (Figure 2, C).Sodium phantom signal-to-noise ratio (SNR) were measured in each data set and compared between initial and follow up scan to determine repeatability (Figure 3). Results shows minor changes in SNR when compared to the original images on a group level (Figure 3, C). Furthermore, variation is measured on subject level in both original and corrected images (Figure 3, A+B). Evaluating the variation in multiple paired t-tests with the Bonferroni-Dunn correction showed no significant differences between initial and follow up scan (p < 0.0125).
Quantification of image homogeneity from B1 corrections is determined with a region-of-interest (ROI) at each anatomy (Figure 2). Figure 4 shows the analysis process and difference of applying a histogram (Figure 4, C) as to a cross-sectional line of total sodium concentration (TSC) (Figure 4, F).
The TSC values across matrix row indices shown by the cross-sectional line is challenged when objects with naturally accruing high TSC is crossed. The peak is most likely a blood vessel which has a higher TCS compared to brain tissue makes this approach challenging. Therefore, homogeneity of anatomies was determined from the standard deviations of histogram probabilities (Figure 4, C).
The results indicate a lower variation in the probability of all organs after Bonferroni-Dunn correction (p< 0.0125) this was significant in the brain, heart blood and muscle (Figure 5).
Conclusions
The results illustrate the great potential of the Bloch-Siegert off-resonance based B1 field correction. This is seen in thigh muscle, heart blood, kidney, and brain. The initial benefits were most pronounced in brain. The complete quantitative 23Na imaging protocol, including B1 field correction is acquired at 3T within 15min. This supports the use of the fast B1 field mapping (2:07min) in the clinical setting.Acknowledgements
The authors would like to thank radiographer Tau Vendelboe for contributing to scanning of the participating subjects.References
- D. I. Hoult and R. E. Richards, “The signal-to-noise ratio of the nuclear magnetic resonance experiment,” J. Magn. Reson., vol. 24, no. 1, pp. 71–85, 1976, doi: 10.1016/0022-2364(76)90233-X.
- L. I. Sacolick, F. Wiesinger, I. Hancu, and M. W. Vogel, “B1 mapping by Bloch-Siegert shift,” Magn. Reson. Med., vol. 63, no. 5, pp. 1315–1322, May 2010, doi: 10.1002/mrm.22357.
- S. P. Allen et al., “Phase-sensitive sodium B1 mapping,” Magn. Reson. Med., vol. 65, no. 4, pp. 1126–1131, 2011, doi: 10.1002/mrm.22700.
- J. G. Pipe, N. R. Zwart, E. A. Aboussouan, R. K. Robison, A. Devaraj, and K. O. Johnson, “A new design and rationale for 3D orthogonally oversampled k-space trajectories,” Magn. Reson. Med., vol. 66, no. 5, pp. 1303–1311, 2011, doi: 10.1002/mrm.22918.
- A. M. Nagel, F. B. Laun, M. A. Weber, C. Matthies, W. Semmler, and L. R. Schad, “Sodium MRI using a density-adapted 3D radial acquisition technique,” Magn. Reson. Med., vol. 62, no. 6, pp. 1565–1573, 2009, doi: 10.1002/mrm.22157.
Figures
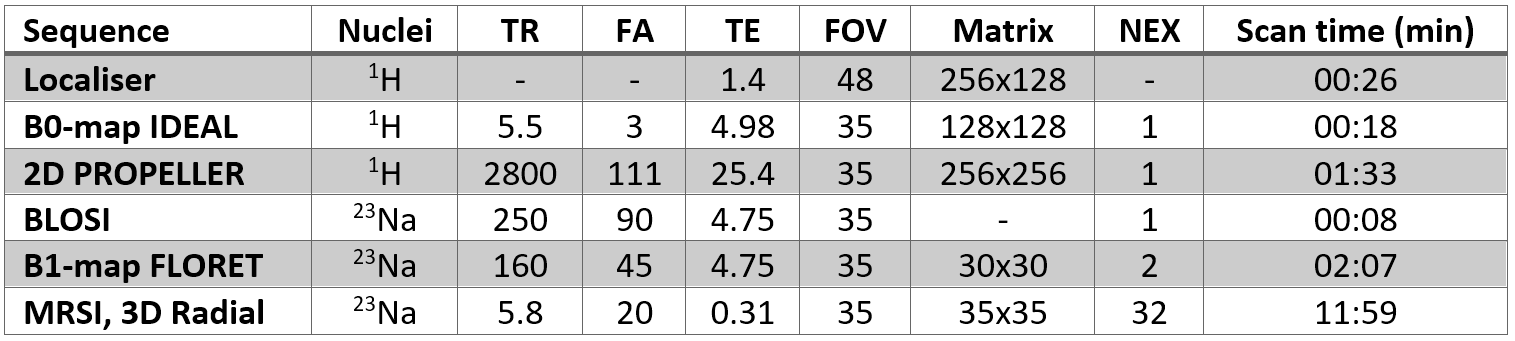
Figure 1 - Scan
protocol of proton and sodium imaging sequences. TR = Repetition time, FA =
Flip angle, TE = Echo time, FOV = Field of view, NEX = number of excitations.
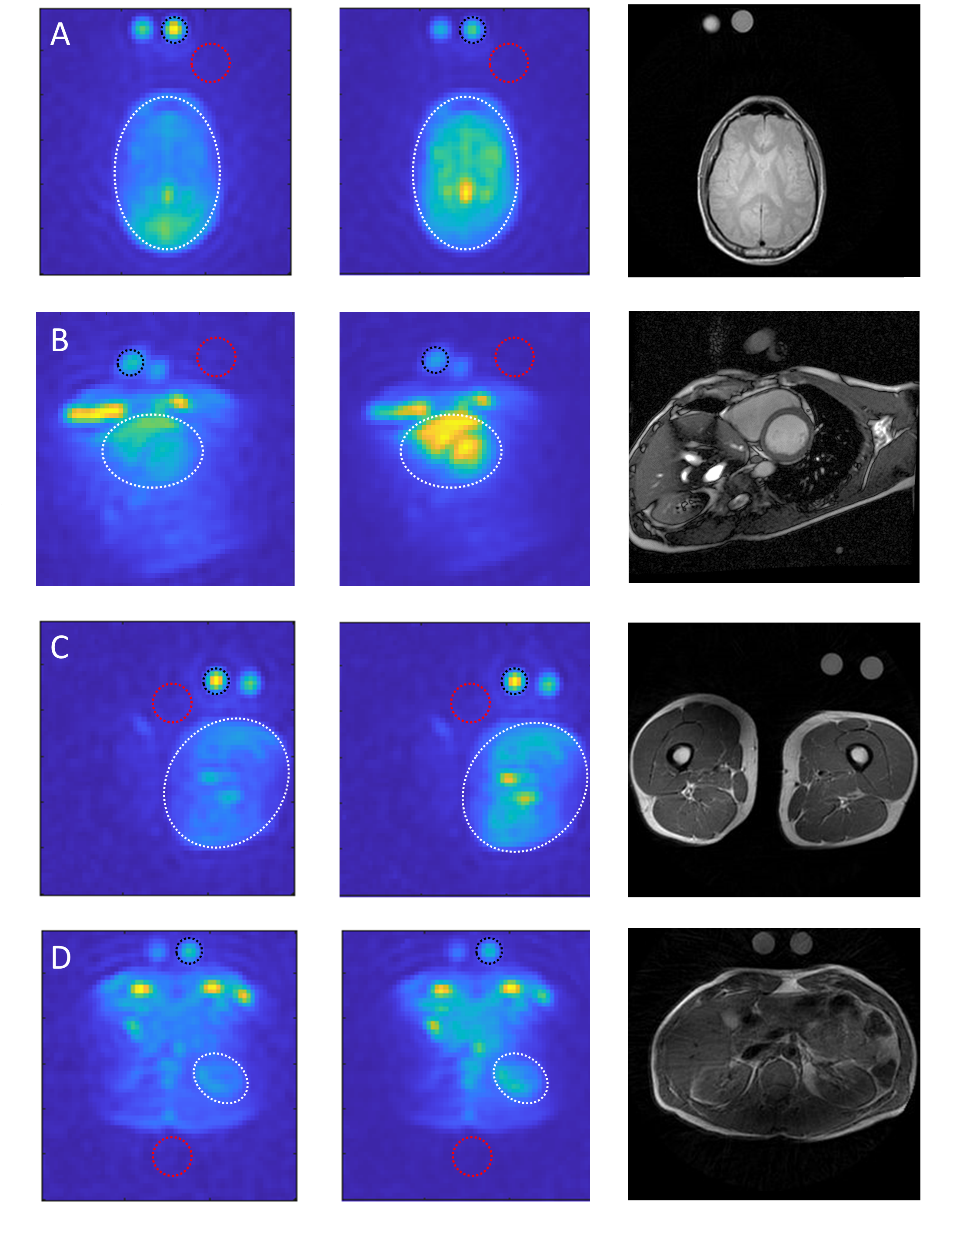
Figure 2 - B1 correction of sodium
images. Original (first column), corrected (middle column), and proton image
(last column). Anatomies: brain (A), heart blood (B), thigh muscle (C) and
kidney (D). Circles are organ region of interest (ROI) (white), phantom ROI (black)
and noise ROI (red).
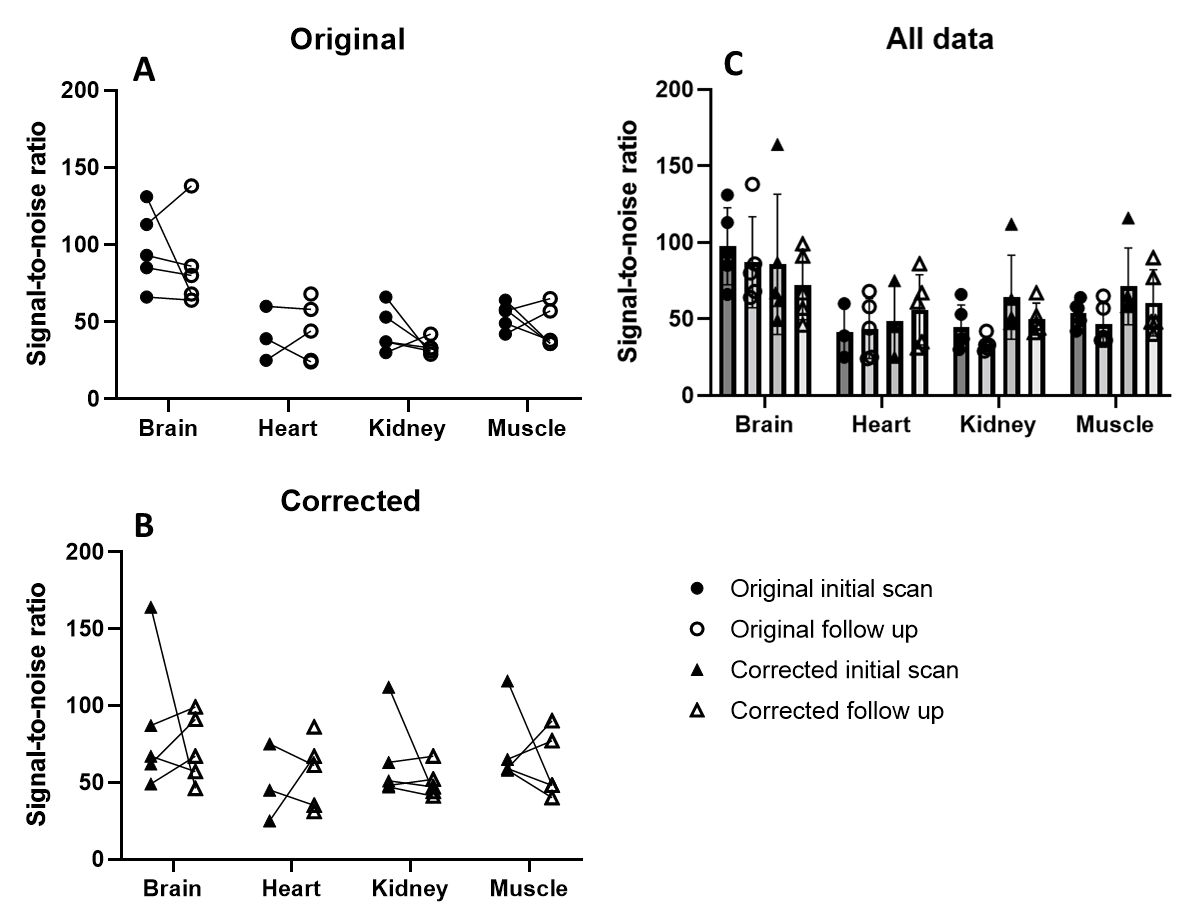
Figure
3 - Comparison
of sodium phantom SNR in original and corrected data at initial and follow up
scan at different anatomical locations (thigh muscle, kidney, heart blood, and
brain) (C). Individual subject variation before (A) and
after B1 field correction (B) is shown in separate plots. SNR =
signal-to-noise ratio.
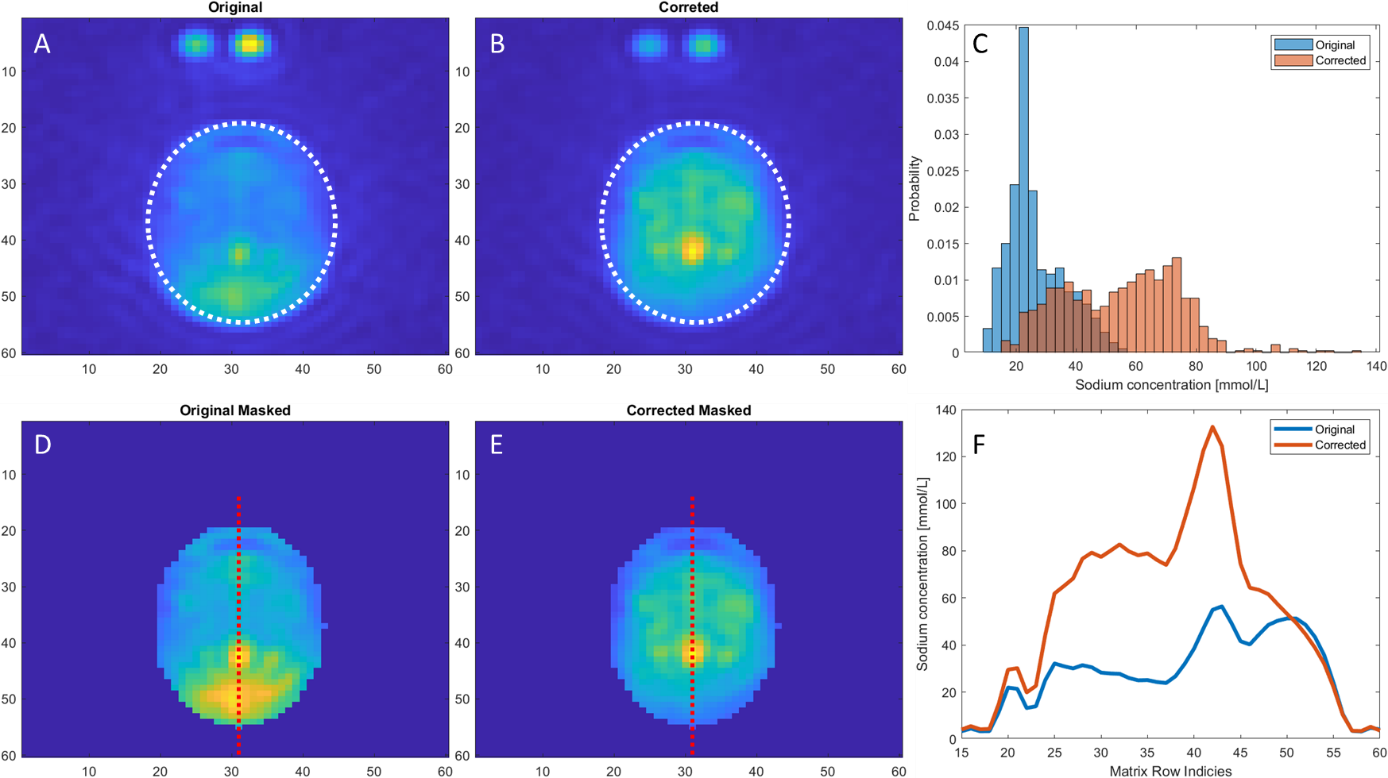
Figure 4 - Comparison of original
(first column) and B1 field corrected sodium images (second column) of the
brain. Region-of-interest (ROI) is indicated by the white ellipse in the
original image (A) and the corrected image (B). ROI histograms is shown as
sodium concentration probabilities (C) to indicate ROI homogeneity. Original
and corrected image masked accordingly to the ROI is show in figure D and E.
Plot of the sodium concentration across the red line from the original and
corrected image is shown in figure F.
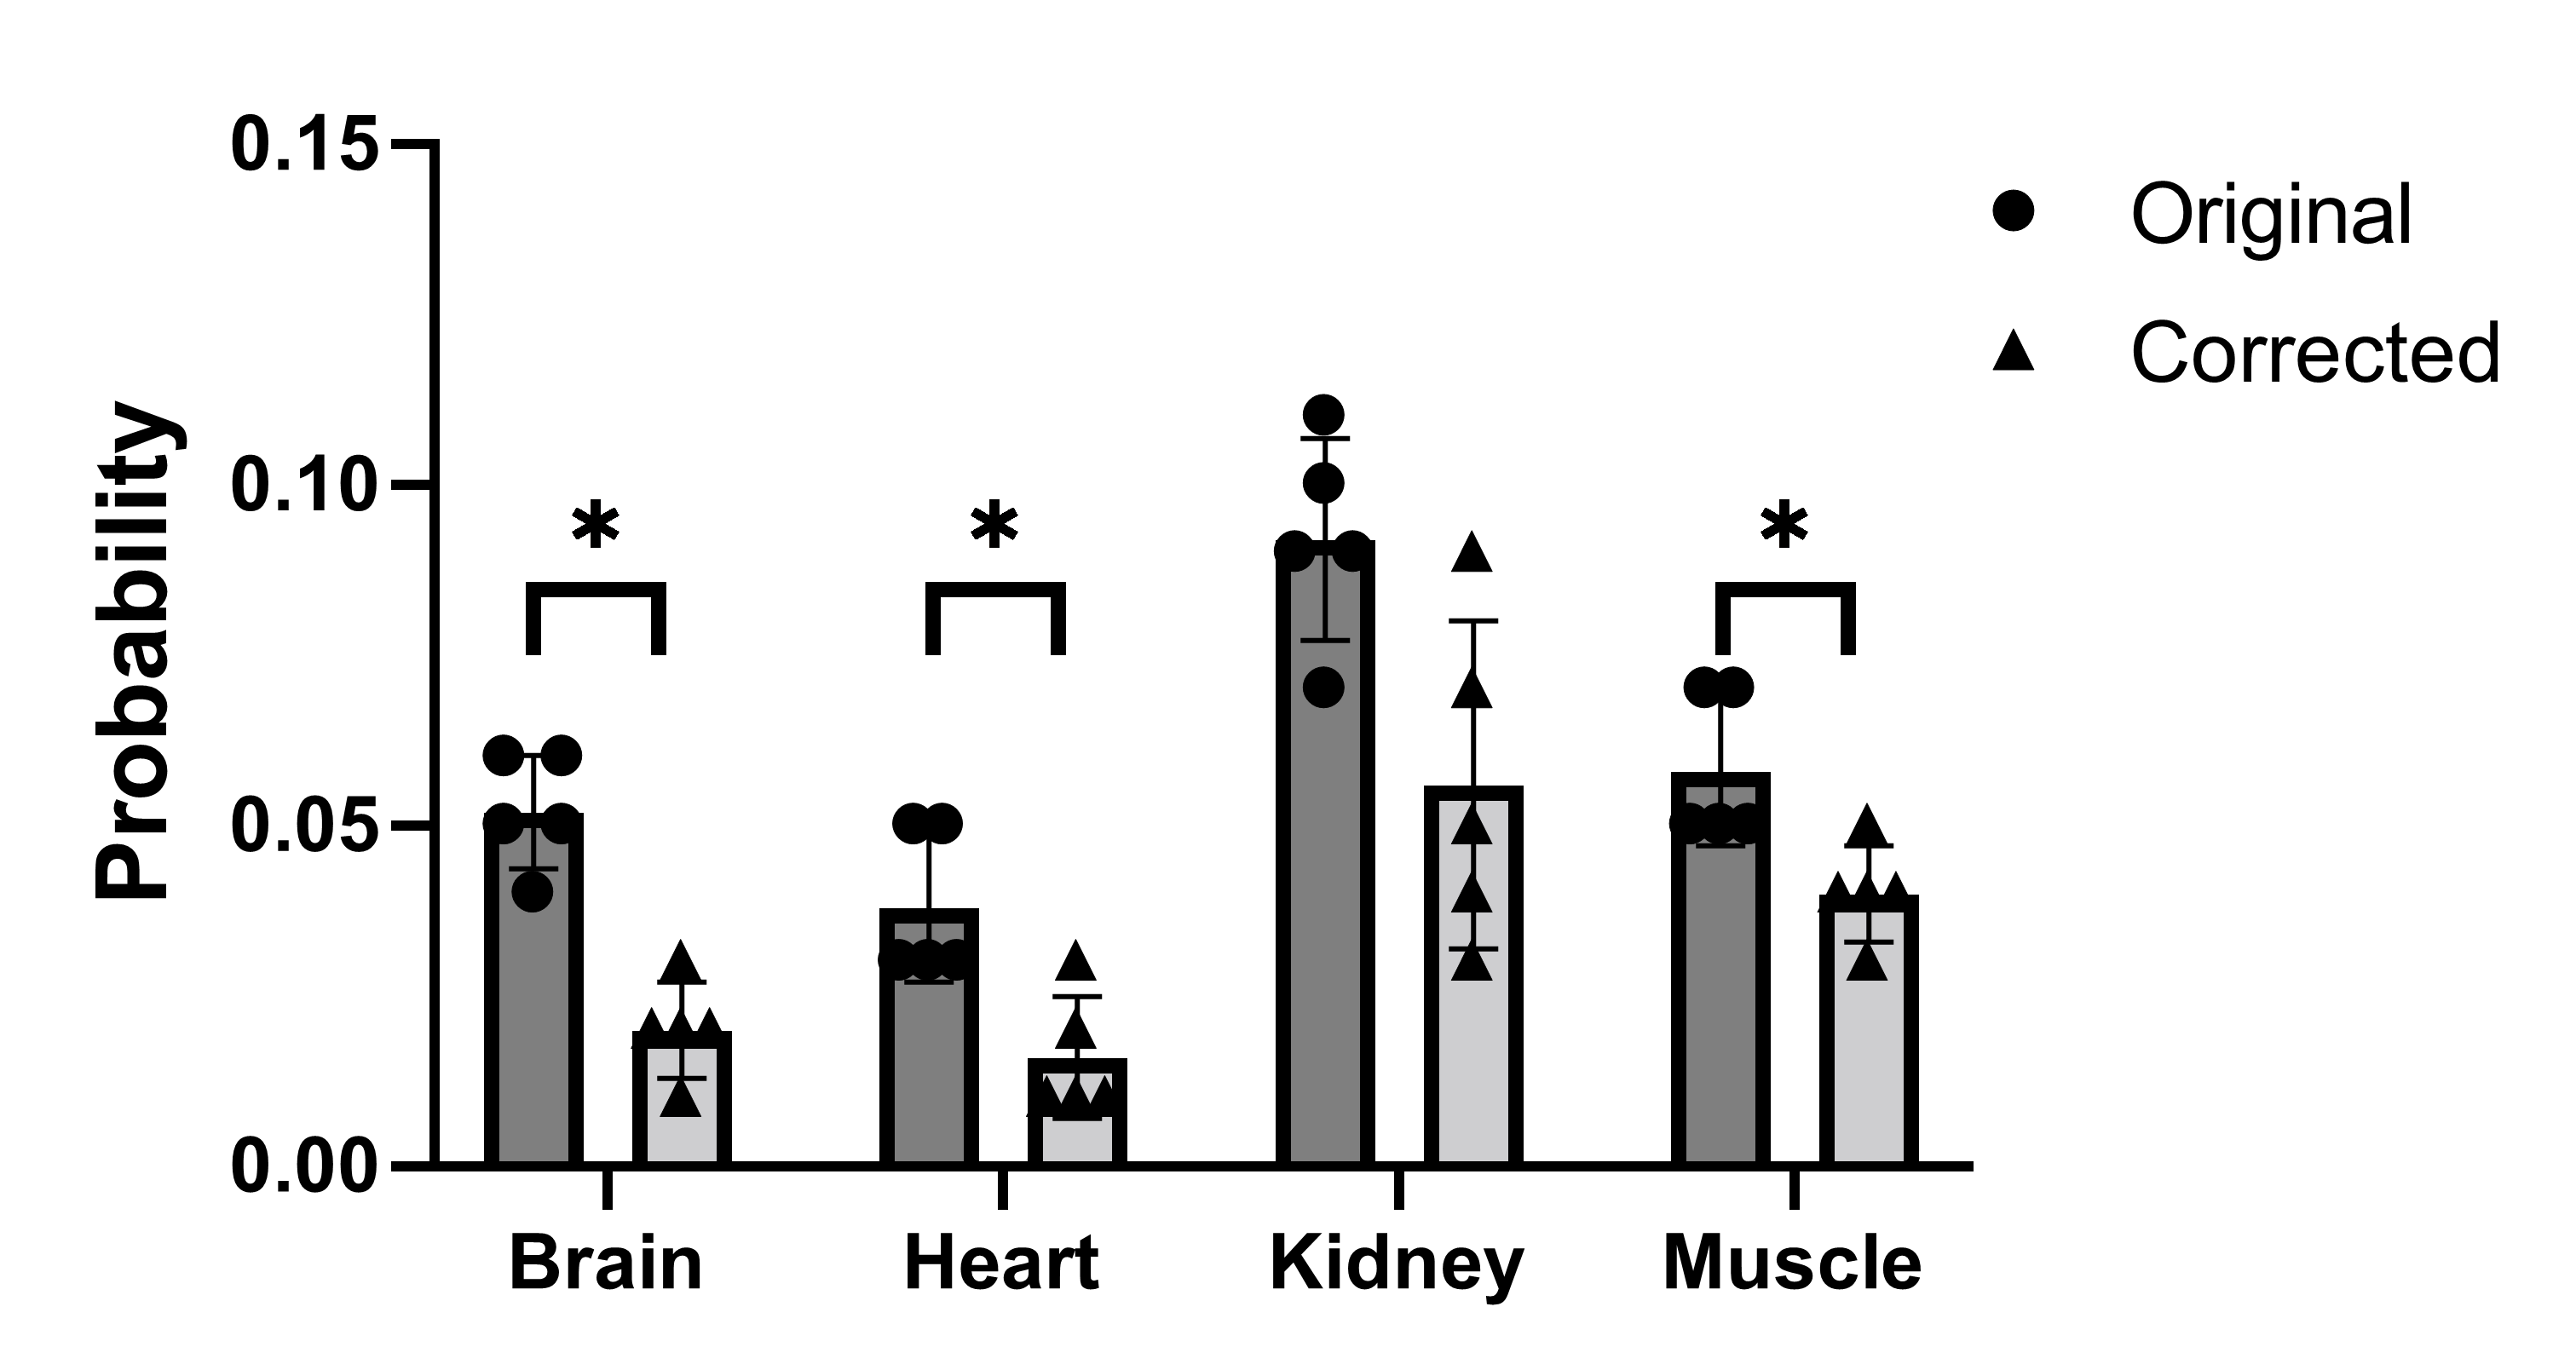
Figure
5 - Standard
deviation of histogram probabilities before and after B1 field correction at
different anatomical locations (thigh muscle, kidney, heart blood, and brain).
Asterix indicates level of significance after Bonferroni-Dunn correction.
DOI: https://doi.org/10.58530/2022/0295