0294
Fast high-resolution metabolite mapping on a preclinical 14.1T scanner using 1H-FID-MRSI
Dunja Simicic1,2,3, Brayan Alves1,2, Jessie Julie Mosso1,2,3, Thanh Phong Lê3,4, Ruud B. van Heeswijk5, Jana Starcukova6, Antoine Klauser1,7, Bernhard Strasser8, Wolfgang Bogner8, and Cristina Cudalbu1,2
1CIBM Center for Biomedical Imaging, Lausanne, Switzerland, 2Animal Imaging and Technology, EPFL, Lausanne, Switzerland, 3Laboratory of Functional and Metabolic Imaging, EPFL, Lausanne, Switzerland, 4HES-SO University of Applied Sciences and Arts Western Switzerland, Geneva School of Health Sciences, Geneva, Switzerland, 5Department of Diagnostic and Interventional Radiology, Lausanne University Hospital and University of Lausanne, Lausanne, Switzerland, 6Institute of Scientific Instruments, Czech Academy of Sciences, Brno, Czech Republic, 7Department of radiology and medical informatics, University of Geneva, Geneva, Switzerland, 8Department of Radiology, Medical University Vienna, MR Center of Excellence, Vienna, Austria
1CIBM Center for Biomedical Imaging, Lausanne, Switzerland, 2Animal Imaging and Technology, EPFL, Lausanne, Switzerland, 3Laboratory of Functional and Metabolic Imaging, EPFL, Lausanne, Switzerland, 4HES-SO University of Applied Sciences and Arts Western Switzerland, Geneva School of Health Sciences, Geneva, Switzerland, 5Department of Diagnostic and Interventional Radiology, Lausanne University Hospital and University of Lausanne, Lausanne, Switzerland, 6Institute of Scientific Instruments, Czech Academy of Sciences, Brno, Czech Republic, 7Department of radiology and medical informatics, University of Geneva, Geneva, Switzerland, 8Department of Radiology, Medical University Vienna, MR Center of Excellence, Vienna, Austria
Synopsis
1H-MRSI enables a simultaneous acquisition of MR-spectra from multiple spatial locations inside the brain. While 1H-MRSI is increasingly used in the human brain, its implementation in preclinical setting is limited because of the smaller size of rodent brain. At UHF for humans, 1H-FID-MRSI acquisitions are increasingly used (T2 and J-evolution minimization, increased SNR). We present the first implementation of fast 1H-FID-MRSI in the rat brain at 14.1T and exploit its potential for an increased brain coverage, reliable and accurate quantification results and metabolic maps. Our results set the grounds for a wider application of 1H-FID-MRSI in the preclinical setting.
Introduction
Magnetic resonance spectroscopic imaging (MRSI) enables a simultaneous non-invasive acquisition of MR spectra from multiple spatial locations inside the brain. Even though the ability of this technique to map the metabolic regional differences in vivo is very valuable for both clinical and biomedical research, its routine application remains challenging due to several issues (e.g. low signal-to-noise ratio (SNR), long acquisition times etc.). The availability of ultra-high magnetic fields (UHF), advanced pulse sequences and new encoding methods improved the quality and speed of MRSI1,2. At UHF in the clinical setting pulse-acquire free induction decay (1H-FID-MRSI) acquisitions are increasingly used2. FID-MRSI acquisition minimizes the T2 relaxation and J-evolution, therefore increasing the SNR. It also reduces the chemical shift displacement errors and sensitivity to B0 inhomogeneities2–5. Moreover, this simple sequence design permits a considerable acquisition time reduction by decreasing the repetition time (TR) while using optimal Ernst’s flip angle.While 1H-MRSI is increasingly used in the human brain, it is not yet widely applied in the preclinical setting mostly because of difficulties related to the small rodent brain6. The resulting low SNR arises from a very small nominal voxel size in rodents (e.g. 0.75x0.75x2mm3 in a 32x32 matrix)7 while in the human brain the nominal voxel size remains fairly big even at high spatial resolution (e.g. 1.7x1.7x10mm3, for 128x128 matrix)8. There are additional challenges in terms of shimming of large volumes with many tissue interfaces, long measurement times (e.g 120min)7,9,10, water suppression artifacts and lipid contamination6.
In this study, the advantages of pulse-acquire 1H-FID-MRSI acquisitions are combined with the UHF of 14.1T to obtain increased SNR and spatial resolution for the first time in the rodent brain.
Methods
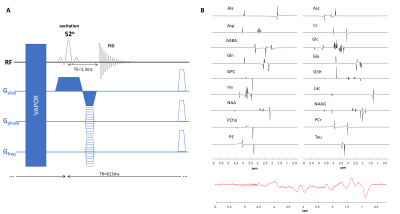
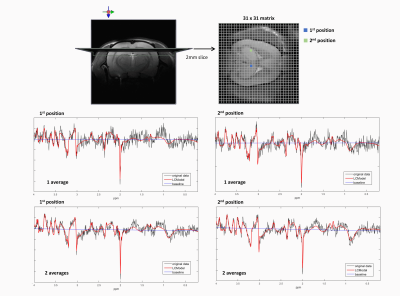
The data were acquired in the rat brain (n=4) at 14.1T (Bruker/Magnex Scientific) using a homemade transmit/receive quadrature surface coil. T2-weighted Turbo-RARE images were acquired in coronal and axial direction to position the MRSI slice for shimming, acquisition and for map overlays (20 slices, TR=3000ms, NA=2, RAREfactor=6).For the high-resolution two-dimensional fast 1H-MRSI a slice selective pulse acquire sequence was used in combination with VAPOR11 water suppression and 6 saturation slabs to minimize the lipid contamination (FID 1H-MRSI, Figure.1A). The MRSI slice was centered on the hippocampus, with 2mm slice thickness and FOV of 24x24mm2 (Figure.2up). The matrix size was 31x31 leading to a nominal voxel size of 0.77x0.77x2mm3. The following acquisition parameters were used: acquisition bandwidth of 7kHz, 1024 spectral data points, Cartesian k-space sampling, 8 dummy scans, TE=1.3ms, TR=813ms leading to total measurement time of 13min. The excitation pulse was adjusted to the Ernst angle of 52o (0.5ms). First and second order shims were adjusted using MAPSHIM, first in an ellipsoid covering the full brain then in a voxel of 10x10x2mm3 centered on the MRSI slice. Two datasets with one and two averages were acquired.
All spectra were quantified using LCModel. The metabolites were simulated using NMRScope-B (18 metabolites) from jMRUI12, using published values of J-coupling constants and chemical shifts13,14 and the pulse-acquire sequence with the same parameters as for the in vivo 1H-MRSI metabolite acquisitions (Figure.1B). The macromolecule (MM) spectrum was acquired using a double inversion recovery STEAM (TI1=2200ms, TI2=850ms) sequence in the voxel of 10x10x2mm3 centered on the MRSI slice. The metabolite residuals were removed with AMARES15. To match the acquisition delay (1st order phase evolution due to the acquisition delay of 1.3ms) to the one of the metabolites in the basis-set the first points of the FID were removed, and this final MM signal was added to the basis-set (Figure.1B). To improve the quantification robustness, the water signal was used for phase correction and the metabolite signals were decontaminated from skull lipids using the metabolite-lipid spectral orthogonality approach16.
Results
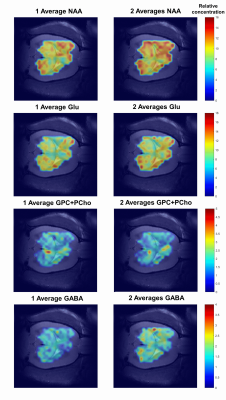
The LCModel quantifications, using the created basis-set, provided reliable quality fits for the data obtained with both one and two averages (Figure.2). The resulting Cramér-Rao lower bounds (CRB’s) were sufficiently low (<40%) for the metabolites of interest leading to accurate metabolic maps. The shim adjustments using MAPSHIM proved to be efficient when shimming in big areas, which translated into good quality spectra in a large number of nominal voxels in the matrix. Therefore, a good brain coverage was achieved extending also towards the edges of the brain and was not limited to a standard rectangular volume. Metabolic maps overlaid to the corresponding anatomical image for NAA, Glu, GPC+PCho and GABA are shown in Figure.3. Although the metabolic maps obtained from the acquisition with two averages provided a better contrast, the maps kept the same pattern when using one average proving that this very fast acquisition leads a satisfactory output.Discussion and conclusion
We presented the first implementation of fast 1H-FID-MRSI in the rat brain at 14.1T which provided an increased brain coverage, reliable and accurate quantification results and metabolic maps. Our results set the grounds for a wider application of 1H-FID-MRSI in the preclinical setting with a potential for further improvement and acceleration. Further improvements will be investigated regarding the efficiency of lipid suppression, improvements in the homogeneity and coverage of the surface coil. In parallel, further reducing TR and implementing a concentric rings encoding would allow a faster acquisition.Acknowledgements
We acknowledge access to the facilities and expertise of the CIBM Center for Biomedical Imaging founded and supported by Lausanne University Hospital (CHUV), University of Lausanne (UNIL), Ecole polytechnique fédérale de Lausanne (EPFL), University of Geneva (UNIGE) and Geneva University Hospitals (HUG). Financial support was provided by the Swiss National Science Foundation (Project No. 310030_173222; 310030_201218) and by the European Union's Horizon 2020 research and innovation program under the Marie Sklodowska-Curie grant agreement No 813120 (INSPiRE-MED).References
- de Graaf, R. A. In Vivo NMR Spectroscopy: Principles and Techniques: 2nd Edition. In Vivo NMR Spectroscopy: Principles and Techniques: 2nd Edition (2007). doi:10.1002/9780470512968.
- Maudsley, A. A. et al. Advanced magnetic resonance spectroscopic neuroimaging: Experts’ consensus recommendations. NMR Biomed. 34, 1–22 (2021).
- Bogner, W., Gruber, S., Trattnig, S. & Chmelik, M. High-resolution mapping of human brain metabolites by free induction decay 1H MRSI at 7T. NMR Biomed. 25, 873–882 (2012).
- Henning, A., Fuchs, A., Murdoch, J. B. & Boesiger, P. Slice-selective FID acquisition, localized by outer volume suppression (FIDLOVS) for 1H-MRSI of the human brain at 7 T with minimal signal loss. NMR Biomed. 22, 683–696 (2009).
- Nassirpour, S., Chang, P. & Henning, A. High and ultra-high resolution metabolite mapping of the human brain using 1H FID MRSI at 9.4T. Neuroimage 168, 211–221 (2018).
- Lanz, B. et al. Magnetic resonance spectroscopy in the rodent brain: Experts’ consensus recommendations. NMR Biomed. 34, 1–20 (2021).
- Mlynárik, V. et al. Quantitative proton spectroscopic imaging of the neurochemical profile in rat brain with microliter resolution at ultra-short echo times. Magn. Reson. Med. 59, 52–58 (2008).
- Hangel, G. et al. Ultra-high resolution brain metabolite mapping at 7 T by short-TR Hadamard-encoded FID-MRSI. Neuroimage 168, 199–210 (2018).
- Cudalbu, C. In vivo studies of brain metabolism in animal models of Hepatic Encephalopathy using 1H Magnetic Resonance Spectroscopy. Metab. Brain Dis. 28, 167–174 (2013).
- Delgado-Goñi, T. et al. MRSI-based molecular imaging of therapy response to temozolomide in preclinical glioblastoma using source analysis. NMR Biomed. 29, 732–743 (2016).
- Tkáč, I., Starčuk, Z., Choi, I. Y. & Gruetter, R. In vivo 1H NMR spectroscopy of rat brain at 1 ms echo time. Magn. Reson. Med. 41, 649–656 (1999).
- Starčuk, Z. & Starčuková, J. Quantum-mechanical simulations for in vivo MR spectroscopy: Principles and possibilities demonstrated with the program NMRScopeB. Anal. Biochem. 529, 79–97 (2017).
- Govindaraju, V., Young, K. & Maudsley, A. A. Proton NMR chemical shifts and coupling constants for brain metabolites. NMR Biomed. 13, 129–153 (2000).
- Govind, V., Young, K. & Maudsley, A. A. Corrigendum to Proton NMR chemical shifts and coupling constants for brain metabolites. [NMR Biomed. 13, (2000), 129-153]. NMR Biomed. 28, 923–924 (2015).
- Simicic, D. et al. In vivo macromolecule signals in rat brain 1H-MR spectra at 9.4T: Parametrization, spline baseline estimation, and T2 relaxation times. Magn. Reson. Med. 86, 2384–2401 (2021).
- Klauser, A. et al. Fast high-resolution brain metabolite mapping on a clinical 3T MRI by accelerated 1H-FID-MRSI and low-rank constrained reconstruction. Magn. Reson. Med. 81, 2841–2857 (2019).
Figures

Figure.1: (A) A schematic drawing of the 1H-FID-MRSI sequence used for data
acquisition. (B) The metabolites simulated using NMRScope-B (18 metabolites)
from jMRUI (up) and the MM included in the basis set. The MM spectrum was
acquired with double inversion recovery STEAM and the residual metabolites were
removed with AMARES from jMRUI.

Figure.2: The slice position and the spatial resolution are shown on the figure up. The
quality of LCModel quantification is shown for spectra from two different
positions in the matrix with one and two averages.

Figure.3: Metabolic maps obtained from the LCModel quantification results of the
data acquired with one average (on the left) and two averages (on the right). The
metabolic maps were superimposed to the corresponding anatomical image using an
in house written MATLAB script. The scales correspond to LCModel outputs when
referenced to tCr by setting its concentration to 8mmol/kgww.
DOI: https://doi.org/10.58530/2022/0294