0293
Clinical Applicability of SLOW-editing compared to MEGA-editing for the Evaluation of the IDH-mutation Status in Glioma Patients at 7T
Guodong Weng1,2, Johannes Slotboom1,2, and Piotr Radojewski1,2
1Institute for Diagnostic and Interventional Neuroradiology, Support Center for Advanced Neuroimaging (SCAN), University of Bern, Bern, Switzerland, 2Translational Imaging Center, sitem-insel AG, Bern, Switzerland
1Institute for Diagnostic and Interventional Neuroradiology, Support Center for Advanced Neuroimaging (SCAN), University of Bern, Bern, Switzerland, 2Translational Imaging Center, sitem-insel AG, Bern, Switzerland
Synopsis
Purpose: comparison of SLOW-editing and MEGA-editing for detection of 2HG in glioma-suspected patients at 7T.
Methods: EPSI-based B0/B0+ robust SLOW-editing and semiLASER-SVS/CSI-based MEGA-editing were applied in 10 patients. The edited 2HG signal at 4.01 ppm aimed to be detected with TE = 68 – 75 ms.
Results: 8 of 9 patients were identified successfully using SLOW-editing which has a higher spectral quality and success rate compared to MEGA-semiLASER. semiLASER-SVS/CSI-based MEGA-editing showed strong ghosting artifacts around 4.01ppm making 2HG-identification impossible.
Conclusions: in vivo 2HG-editing can be performed using SLOW-EPSI within 10 minutes measurement time and is the preferrable method at UHF.
INTRODUCTION
2HG is a biochemical compound which accumulates and can be detected in IDH-mutated gliomas 1. IDH-mutations lead to a distinct phenotype of gliomas and therefore can be used as a prognostic marker. The detection of 2HG has direct clinical consequences for further neurosurgical-treatment (e.g., maximal resection versus of tumour-debulking). Since 2HG is a J-coupled spin-system which has multiple resonances hidden by other stronger resonances, multiple MEGA-based J-difference spectral-editing techniques have been proposed (e.g. 1–3) for accurate measurement of 2HG. An alternative J-difference editing technique (named SLOW), which is especially suited for use at UHF, has been proposed recently4. SLOW-editing requires only 8% of the SAR when comparing to semiLASER-based MEGA-editing5,6,7. This is because SLOW-editing only requires two different pairs of narrow-band chemical selective adiabatic phase-compensated 2π-refocussing/editing pulses (2π-CSAP), instead of four broadband slice selective phase compensated 2π-refocussing pulses (2π-SSAP) in addition to two narrowband MEGA-editing pulses. The high SAR results in a long acquisition time. The low SAR advantage of SLOW allows for a short TR, and, when combined with an EPSI read-out, a large volume of the brain can be covered in less 10 minutes.In this abstract we investigated the 2HG editing-performance in vivo: MEGA-semiLASER was compared to SLOW-EPSI on our 7T clinical scanner.
METHODS
All MRI, MRS(I) measurements were performed on a Siemens MAGNETOM Terra 7T MR-scanner in clinical-mode using a Nova 1Tx32Rx head-coil. Up till now, 10 patients with suspected glioma have been prospectively examed. Currently, surgery and neuropathology to determine the IDH-status have been performed in 9 out of 10 patients.The SLOW-EPSI 4,8,9 (Figure 1A-B) was applied on (i.) the “Braino”-phantom (General-Electric, USA), (ii.) a spherical 2HG-phantom prepared in-house, (iii.) and 10 patients. The refocusing/editing chemical-selective adiabatic pulse (2π-CSAP) for SLOW-editing is 24 ms duration. The bandwidth (BW) of editing-full and editing-partial ranges from 1.6–4.2 ppm and 2.7–4.2 ppm, respectively (Figure 2A). The editing result was obtained by the subtraction of the editing-full (acquisition #1) by the editing-partial signal (acquisition #2).
MEGA-semiLASER-SVS and CSI 5,10 were additionally performed on all 10 patients during the same examination.
RESULTS
Figure 2A shows the pulse profiles of editing-full (1.6–4.2 ppm) and editing-partial (2.7–4.2 ppm). The corresponding in vitro measurement for 2HG was shown in Figure 2B. Figure 2C-E shows the simulation of Glx (glutamate/glutamine=2/1) at 3.76 ppm, GABA at 3.01 ppm and 2HG at 4.01 ppm using SLOW-editing.Figure 3 shows three typical in vivo measurements (spectral editing difference) in three IDH-mutated patients. The 2HG-signal at 4.01 ppm is clearly present in all three patients using SLOW-EPSI (indicated by red arrows). However, only one case (subject 3) shows two cases (subject 1 and 3) show unambiguous 2HG signal for MEGA-SVS at 7T (indicated by red arrows). The MEGA-based-CSI failed to detect 2HG at 7T, respectively. Subjects 1 and 2 were confirmed to have IDH-mutated glioma by histopathology, while subject 3 has not had surgery yet.
Figure 4 shows the corresponding MRI and together with VOI of MRSI/MRS.
Figure 5A shows raw metabolic maps of Glx, NAA, Cho, Cr which are non B1+ and B1- inhomogeneity corrected. Figure 5B shows the same maps but B1+ and B1- inhomogeneity corrected using the water reference map acquired simultaneously by the EPSI sequence8. Figure 5C shows the metabolic maps of Glx (edited), Cho, Cr, and NAA for 4 different semiLASER VOIs sizes/orientations. The effect of CSDE can clearly be seen when comparing NAA- and Cho-maps. In addition, all metabolite maps for larger VOI do not show fully refocussed signal amplitudes in the top right volume, indicated by arrows, which can be attributed to the lack of adiabatic condition, as rotation by 45-degrees leads to the same pattern.
DISCUSSION
Of the 9 of 10 prospectively examined patients we currently have histopathology findings. SLOW-editing was able to identify the correct IDH-status in 8 out of 9 patients correctly; in the failing case, the tumour was located right above the nasal-cavity, was poorly B0-shimmed. MEGA-semiLASER-CSI/SVS based 2HG-editing showed in nine cases often large ghosting artifacts in the 3.8–5.3 ppm range, often preventing unambiguous 2HG-detection (see three typical cases in Figure 3). The semiLASER 2π-SSAP pulse-times were chosen to be 8040 µs, therefore these pulses could reach their correct nominal 180-degree flip-angles. However, a sufficiently larger B1+-amplitude (>180 degrees) is required the guarantee robust adiabatic behaviour under inhomogeneous B1+-conditions. For the narrowband 2π-CSAP of SLOW, this condition can be easily met. Apparently, the broadband 2π-SSAP of semiLASER does not meet this criterium in our Nova 1Tx 32Rx head coil. Finally, the degradation of spectral quality observed in MEGA-semiLASER editing is not only due to the B1+-inhomogeneities, but also B0- inhomogeneities and insufficient water suppression, which can be overcome using SLOW-editing4,9.CONCLUSION
Due to its low B1+-peak power and SAR-requirements at UHF, SLOW-editing based MRSI can satisfy the adiabatic condition for 2HG editing in vivo, while this condition is poorly satisfied for the MEGA-semiLASER, resulting in large CSDE and strong ghosting-artifacts, which are also due to B0-inhomoginieties and poor water-suppression.Acknowledgements
The research is supported by the Swiss National Science Foundation (SNSF-182569).References
- Choi C, Ganji SK, DeBerardinis RJ, et al. 2-hydroxyglutarate detection by magnetic resonance spectroscopy in IDH-mutated patients with gliomas. Nature Medicine 2009 18:4. 2012;18(4):624-629.
- Andronesi OC, Kim GS, Gerstner E, et al. Detection of 2-hydroxyglutarate in IDH-mutated glioma patients by in vivo spectral-editing and 2D correlation magnetic resonance spectroscopy. Science translational medicine. 2012;4(116):116ra4.
- Moser P, Hingerl L, Strasser B, et al. Whole-slice mapping of GABA and GABA + at 7T via adiabatic MEGA-editing, real-time instability correction, and concentric circle readout. NeuroImage. 2019;184:475-489.
- Weng G, Kiefer C, Zubak I, Slotboom J. SLOW: Whole Brain Spectral Editing EPSI Based Technique using Chemical Selective Adiabatic 2π-Refocusing Pulses applied to 2HG and GABA Editing. In: ISMRM & SMRT Annual Meeting & Exhibition. ; 2021:1990-1990.
- Mescher M, Merkle H, Kirsch J, Garwood M, Gruetter R. Simultaneous in vivo spectral editing and water suppression. NMR in Biomedicine. 1998;11(6):266-272.
- Garwood M, Delabarre L. The Return of the Frequency Sweep: Designing Adiabatic Pulses for Contemporary NMR. Journal of Magnetic Resonance. 2001;153:155-177.
- Slotboom J, Mehlkopf AF, Bovee WMMJ. The Effects of Frequency-Selective RF Pulses on J-Coupled Spin-1/2 Systems. Journal of Magnetic Resonance, Series A. 1994;108(1):38-50.
- Ebel A, Maudsley AA. Improved spectral quality for 3D MR spectroscopic imaging using a high spatial resolution acquisition strategy. Magnetic Resonance Imaging. 2003;21(2):113-120.
- Weng G, Sheriff S, Kiefer C, Zubak I, Maudsley A, Slotboom J. Simultaneous Water and Lipid Suppression Using Chemical Selective Adiabatic Refocusing Pulses Echo Planar Spectroscopic Imaging (EPSI) at 7T. In: ISMRM & SMRT Annual Meeting & Exhibition. ; 2021:1985-1985.
- Marjańska M, Auerbach EJ, Valabrègue R, van de Moortele PF, Adriany G, Garwood M. Localized 1H NMR spectroscopy in different regions of human brain in vivo at 7T: T 2 relaxation times and concentrations of cerebral metabolites. NMR in Biomedicine. 2012;25(2):332-339.
- Slotboom J, Vogels BAPM, Dehaan JG, et al. Proton Resonance Spectroscopy Study of the Effects of L-Ornithine-L-Aspartate on the Development of Encephalopathy, Using Localization Pulses with Reduced Specific Absorption Rate. Journal of Magnetic Resonance, Series B. 1994;105(2).
- Slotboom J, Mehlkopf AF, Bovee WMMJ. The Bloch Equations for an AB System and the Design of Spin-State-Selective RF Pulses for Coupled Spin Systems. Journal of Magnetic Resonance, Series A. 1994;106(2):159-167.
Figures
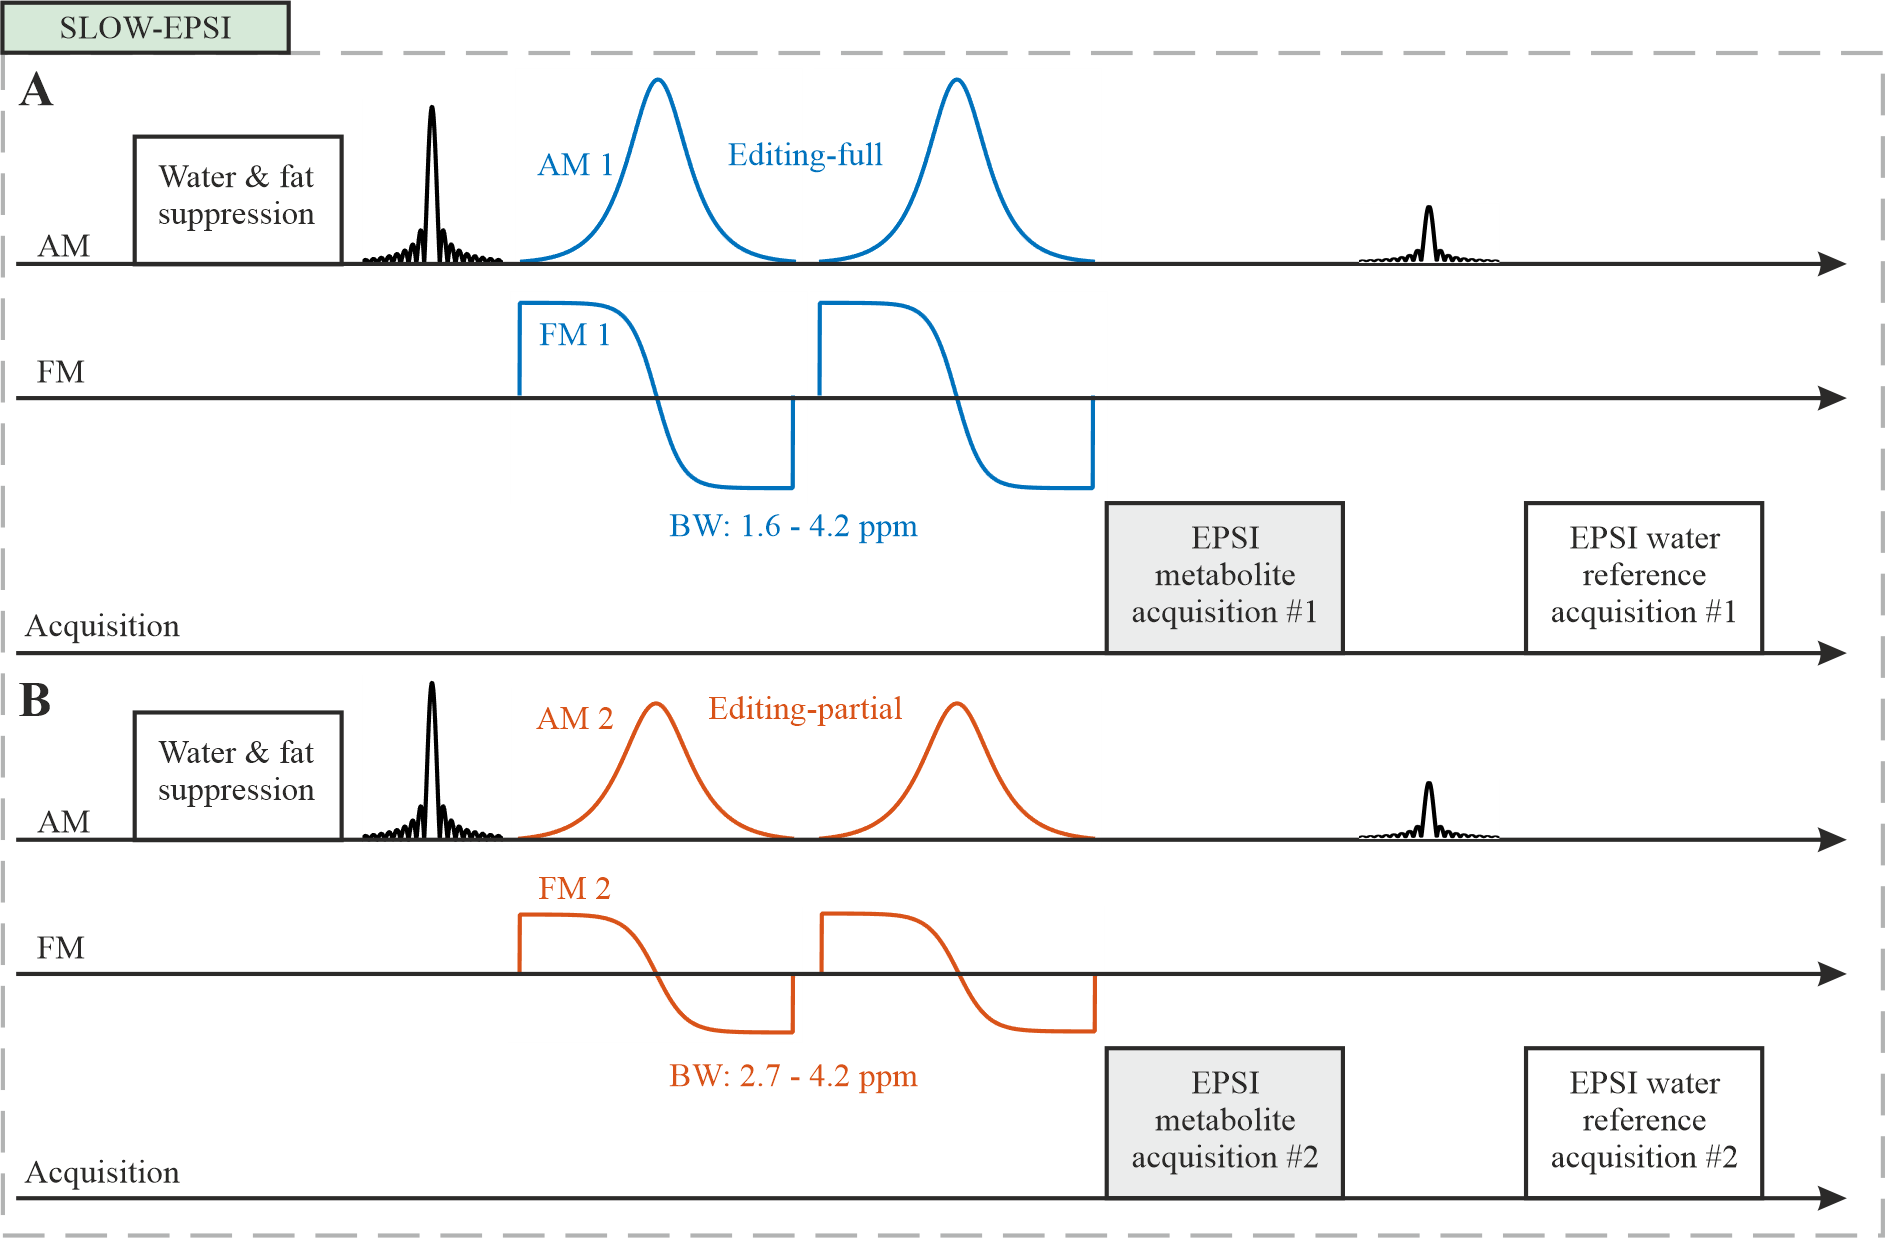
Figure
1: SLOW-EPSI
sequence which makes use of phase compensated adiabatic 2π-pulses with complex
secant hyperbolic modulation type (so called 2π-CSAP pulses)11. A) Editing-full: the
refocusing/editing pulse BW ranges from 1.6 – 4.2 ppm. B)
Editing-partial: the refocusing/editing pulse BW ranges from 2.7 – 4.2 ppm. The
pulse duration of the 2π-CSAP pulses was 24 msec, enabling a very flat
pass-band and very steep transition bands, which simultaneously suppress water
and lipid signals as well. The results presented in this contribution used an
EPSI read-out as described by8.

Figure
2: SLOW-editing
for PE. A) Pulse profiles of editing-full and -partial pulse if used as
inversion pulse. B) The phantom measurement results: editing-full
(blue), editing-partial (orange), and difference (purple). C-E) The
simulation of Glx (glutamate/glutamine = 2/1), GABA and 2HG under SLOW-editing,
respectively. Note the striking resemblance between simulation and phantom
measurement (B, E). Simulation of spin system were performed using in-house
MATLAB (R2019b) code, by solving relaxation-free Liouville-von Neumann Equation12.
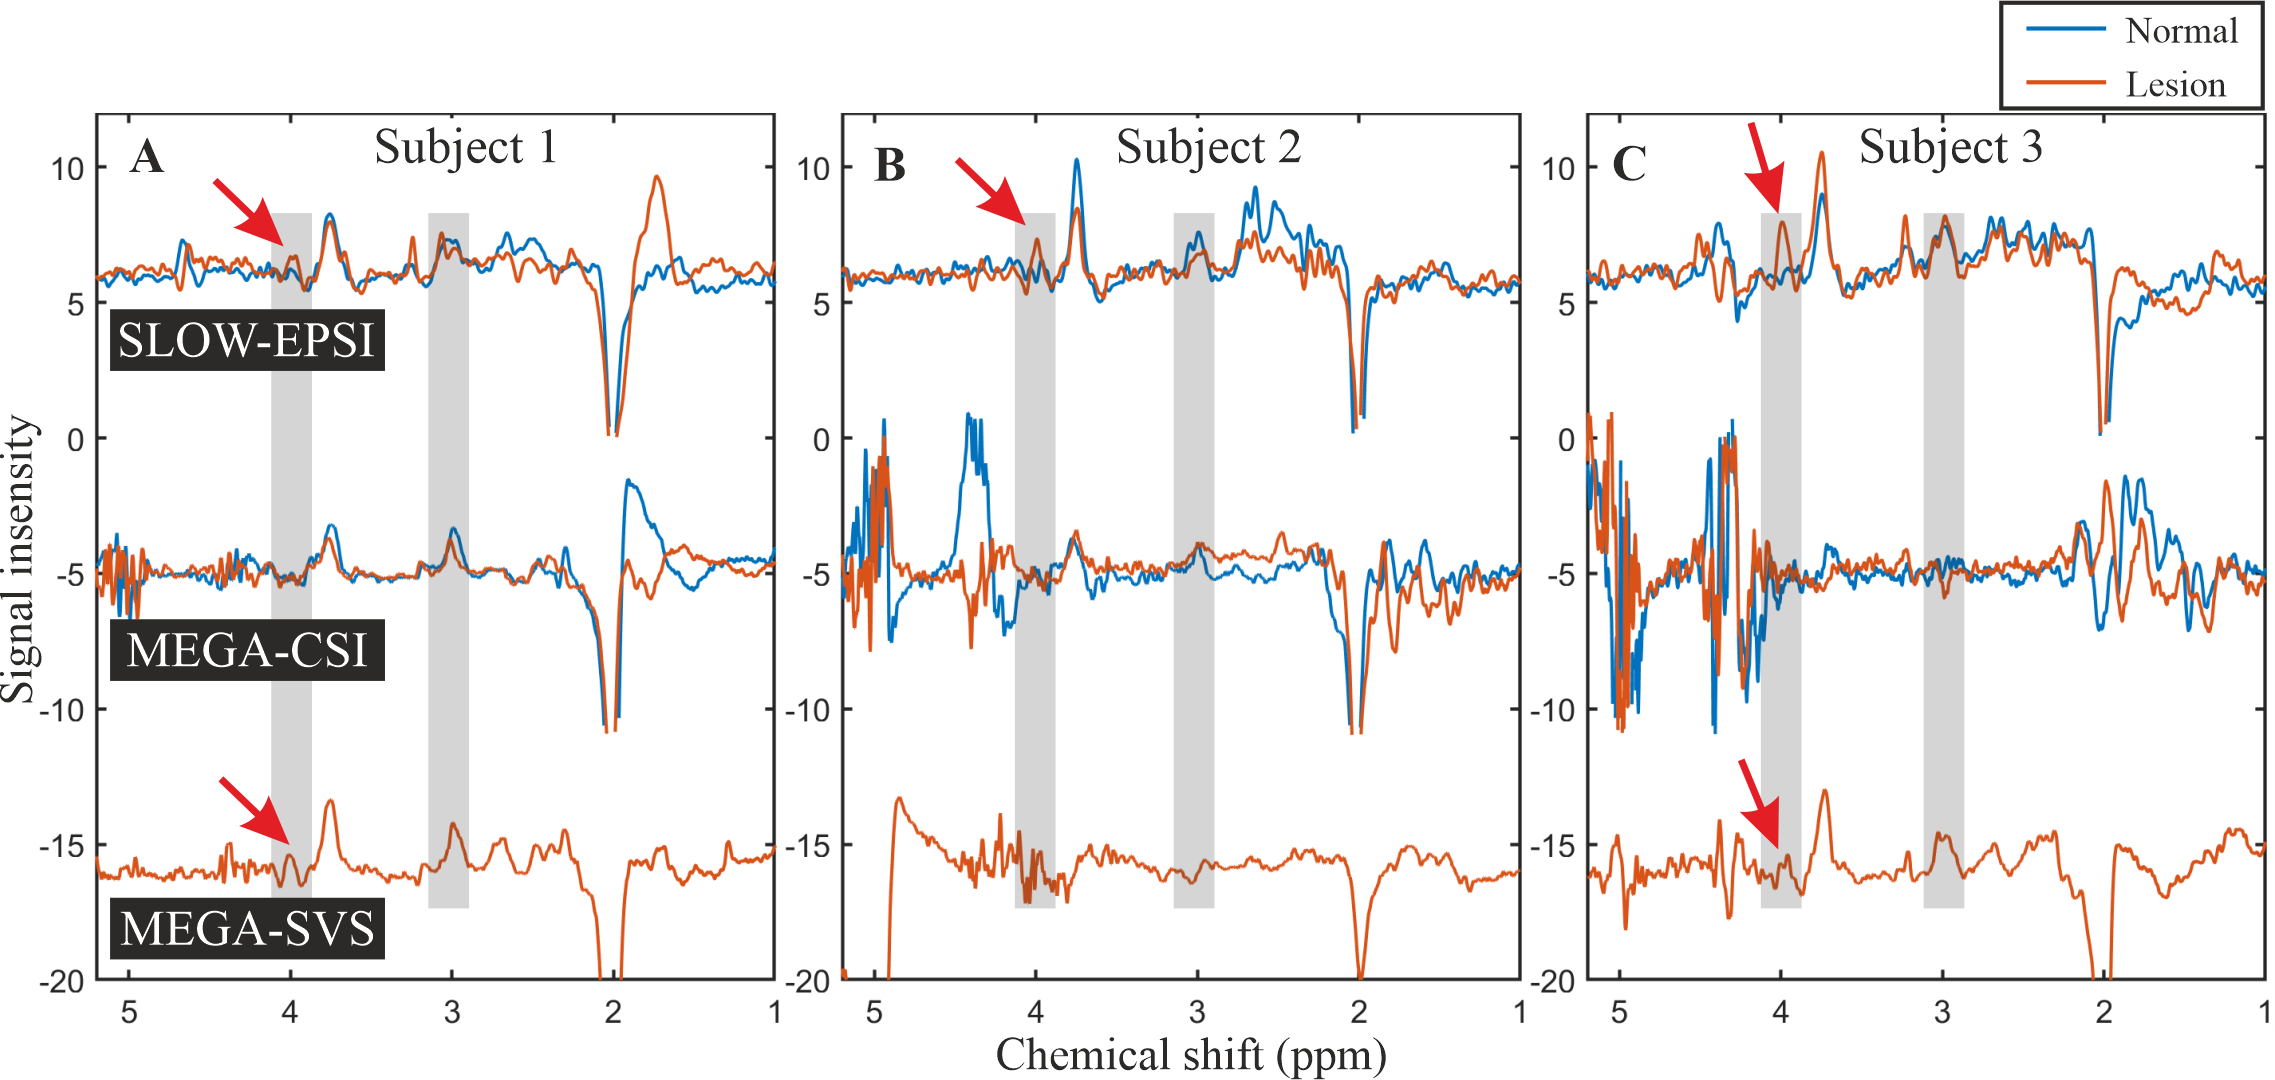
Figure
3: The in vivo
spectral editing difference (editing-partial minus editing-full for
SLOW-editing, editing-on minus editing-off for MEGA-editing) within
lesion/tumour (orange line) and mirror-symmetric normal tissue (blue line). The
red arrows indicate the 2HG-signals.
SLOW-EPSI:
TE = 68 ms, TR = 1500 ms, matrix = 65 x 23 x 9, FOV = 280 x 180 x 70 mm,
averages = 1, and TA = 9:04 min.
MEGA-SVS:
TE = 75 ms, TR = 2500 ms, VOI = 30 x 30 x 30 mm, averages = 64, and TA = 5:42
min.
MEGA-CSI:
TE = 75 ms, TR = 2900 ms, VOI = 70 x 70 x 20 mm, FOV = 200 x 200 x 20 mm (12 x
12 matrix), averages = 1, and TA = 8:43 min.

Figure
4: The MRI and
corresponding MRSI/MRS VOI of three patients. The displaced volumes are
indicated as orange (lesion) and blue (normal tissue) rectangular for SLOW-EPSI
and MEGA-CSI. The displaced volume sizes are listed as follows
Subject 1:
25 cm3 (SLOW-EPSI), 27 cm3 (MEGA-SVS), 175 cm3
(MEGA-CSI) at 7T, respectively.
Subject 2:
14 cm3 (SLOW-EPSI), 27 cm3 (MEGA-SVS), 175 cm3
(MEGA-CSI) at 7T, respectively.
Subject 3:
3.5 cm3 (SLOW-EPSI), 27 cm3 (MEGA-SVS), 63 cm3
(MEGA-CSI) at 7T, respectively.

Figure
5: A)
Metabolic maps of Cr, NAA and Glx using SLOW-EPSI; the inhomogeneities visible
in the images are caused by inhomogeneities in B1+
and B1-.
B) B1+
and B1- corrected images using EPSI water
reference acquisition 8.
C) Metabolic maps of Glx, Cho, Cr,
and NAA using MEGA-semiLASER (editing-off acquisition) with different VOIs and
rotations. The significant signal cancelation in the top right corner of the
VOI is indicated by white arrows. In addition, the large CSDE for large VOIs
(column 2-4) clearly present.
D) High resolution water MRI of the
same cross section as A-C.
DOI: https://doi.org/10.58530/2022/0293