0292
An Alternative to WEX: T1-Independent Exchange Rate Quantification using Phase Sensitive Water Exchange Spectroscopy1Experimental Physics 5, University of Würzburg, Würzburg, Germany, 2Leibniz Institute of Plant Genetics and Crop Plant Research (IPK), Gatersleben, Germany
Synopsis
Water Exchange Spectroscopy (WEX) is one of the most widely used approaches to assess the exchange rate of labile protons from a solute to water. In this work, we propose as an versatile alternative “Phase Sensitive WEX” (PS-WEX), which uses an additional RF-pulse and a fixed mixing-time delay. By exploiting the phase sensitivity of the PS-WEX pathway the dynamic range can be increased and the T1-dependence of the signal is completely reduced. This is demonstrated in simulations and phantom measurements. The fixed mixing-time reduces the influence of the T1-decay on the signal curve leading to improved fit quality.
Introduction
In recent years, several applications using chemical exchange contrast have been developed1. The exchange rate has a strong influence on these techniques. Hence, methods for exchange rate quantifications are essential for sequence optimization2. Further applications for exchange rate quantification are differentiation of contributing exchange sites or pH-measurements3,4.Since Mori et al. published Water Exchange Spectroscopy5 (WEX), it has been applied by default to quantify the exchange rates of macro-molecules in solution1,5,6,7 , in perfused cancer cells8 as well as in-vivo in rat brains9. In WEX a bi-exponential fit model is used for the exchange rate quantification of the WEX signal curve, which can be sometimes challenging to fit.10
In this work, we propose an alternative WEX approach by replacing the variable mixing time by 1) a fixed delay and with 2) an additional 180° radio frequency (RF) pulse, called phase sensitive WEX (PS-WEX). With this approach, a more easy to fit mono-exponential signal behavior is achieved. Furthermore, in PS-WEX the dynamic range is improved using the phase information, resulting in high quality of exchange rate quantification.
Sequence design
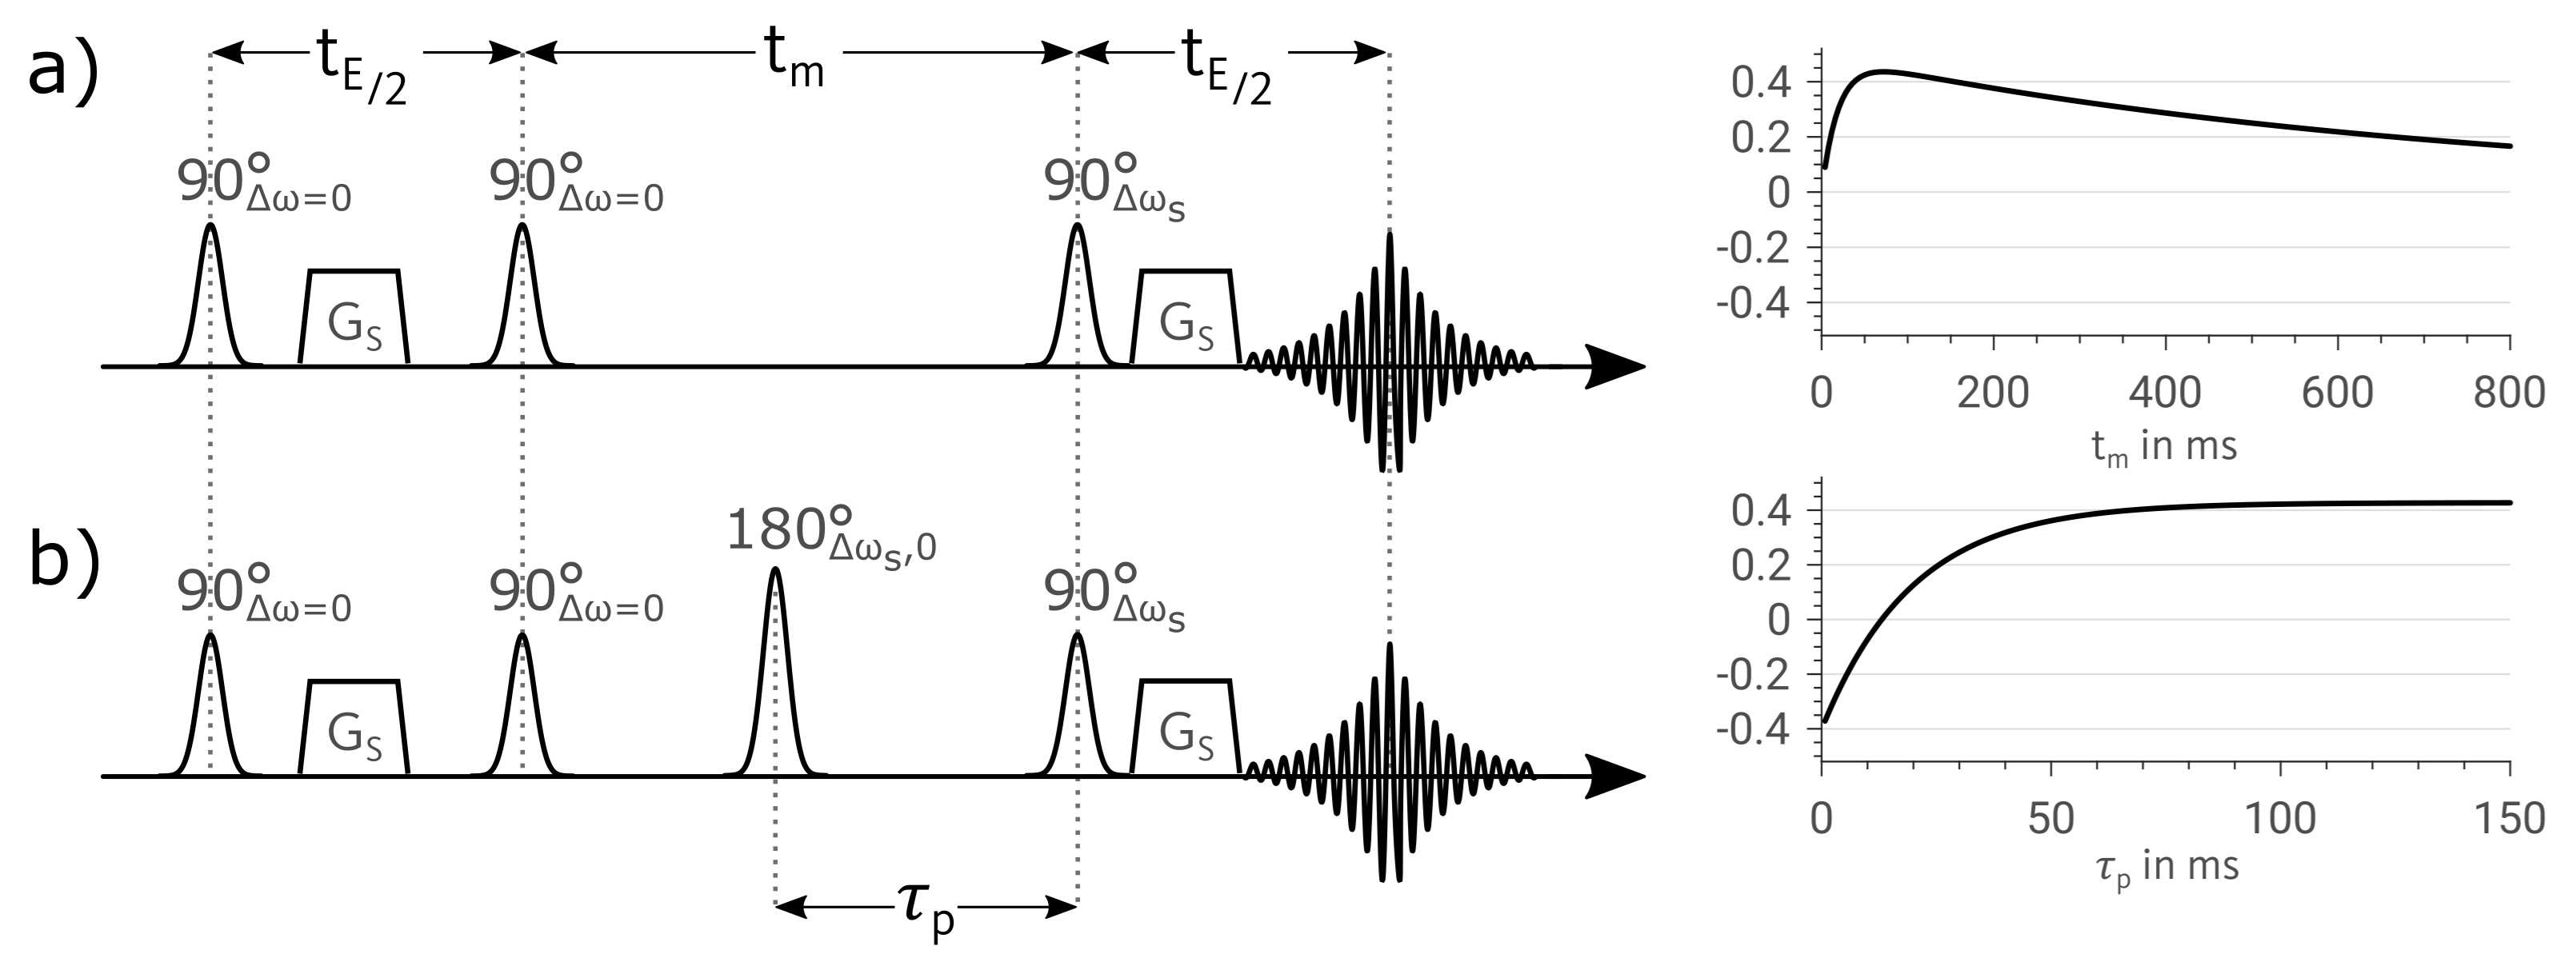
In Figure 1a) the sequence diagram of a WEX experiment is shown together with a typical signal curve following the equation $$S(t_m) = \frac{k_{sw}\,S_{s0}}{2\,(\tilde{k}_{\text{WEX}}-R_{1,w})}\,(e^{-R_{1,w}\,t_m}-e^{-\tilde{k}_{WEX}\,t_m}) \; , $$ with $$$\tilde{k}_{\text{WEX}}=k_{sw}+R_{1,s}$$$, exchange rate $$$k_{sw}$$$ between the solute pool and water , mixing-time $$$t_m$$$ , longitudinal relaxation rate of water, $$$R_{1,w}$$$, and solute, $$$R_{1,s}$$$, and a proportionality constant between the signal and the size of the solute pool ($$$S_{s0}$$$)10.During the variable mixing-time magnetization transfer can occur. The stimulated echo is read out on exchanging pools. By choosing a read out pulse whose bandwidth includes the frequencies of multiple solute pools without the water frequency, the acquired signal delivers the spectroscopic information about all pools, contributing to the chemical exchange. Since during the variable mixing-time the magnetization is stored in longitudinal direction it is subject to an additional T1-decay resulting in the final bi-exponential signal curve (equation (1)). In contrary, in PS-WEX an additional 180° RF-pulse is introduced during a fixed mixing-time $$$t_m$$$ at the position $$$\tau_p \in \{0,t_m\}$$$, which leads to the effect that exchange rate can now be sampled without varying T1-influence.
Figure 1b) shows the sequence of a PS-WEX experiment. Using a water selective inversion pulse, the prepared water pool is inverted. Unlike in the WEX experiment now a fixed mixing-time is used, leading to a fixed T1-attenuation. The exchange curve is then sampled by only stepping the position $$$\tau_p$$$ of the inversion. This results in a mono-exponential $$$k_{sw}$$$-dependence $$S(\tau_p)=\frac{k_{sw}\,S_{s0}}{2\,\tilde{k}_{\text{PS}}}\,e^{-R_{1,w}\,t_m}\,(1+e^{-\tilde{k}_{\text{PS}}\,t_m}-2\,e^{-\tilde{k}_{\text{PS}}\,\tau_p}) \; ,$$ with $$$\tilde{k}_{\text{PS}}=k_{sw}+R_{1,s}-R_{1,w}$$$. Using the proposed approach, the dynamic range is now approximately doubled, as both magnetization of the exchanging pool prior to and after the inversion pulse, contribute to the final signal (see Figure 1b)).
Experimental
Creatine monohydrates were dissolved in fully demineralized water to yield samples with 50mMol/l. The pH-value was adjusted at 23°C using hydrogen chloride or sodium hydroxide. Samples with pH-values of 4.50, 5.00, 5.75, 6.22, 6.45 and 6.84 were filled in 5mm NMR-tubes. All experiments were carried out on an 11.75T MRI System (Bruker Biospin Ettlingen, Germany). NMR parameter were as follows: 50kHz acquisition bandwidth, 256 readout points, Gaussian pulses with a bandwidth of 1000kHz. The WEX signal was acquired for 60 equally spaced $$$t_m$$$ in a range of 6 to 478ms. For PS-WEX the mixing-time was set to $$$t_m=$$$211ms and 60 equally spaced $$$\tau_p$$$ in a range of 5 to 211ms were used.Simulations
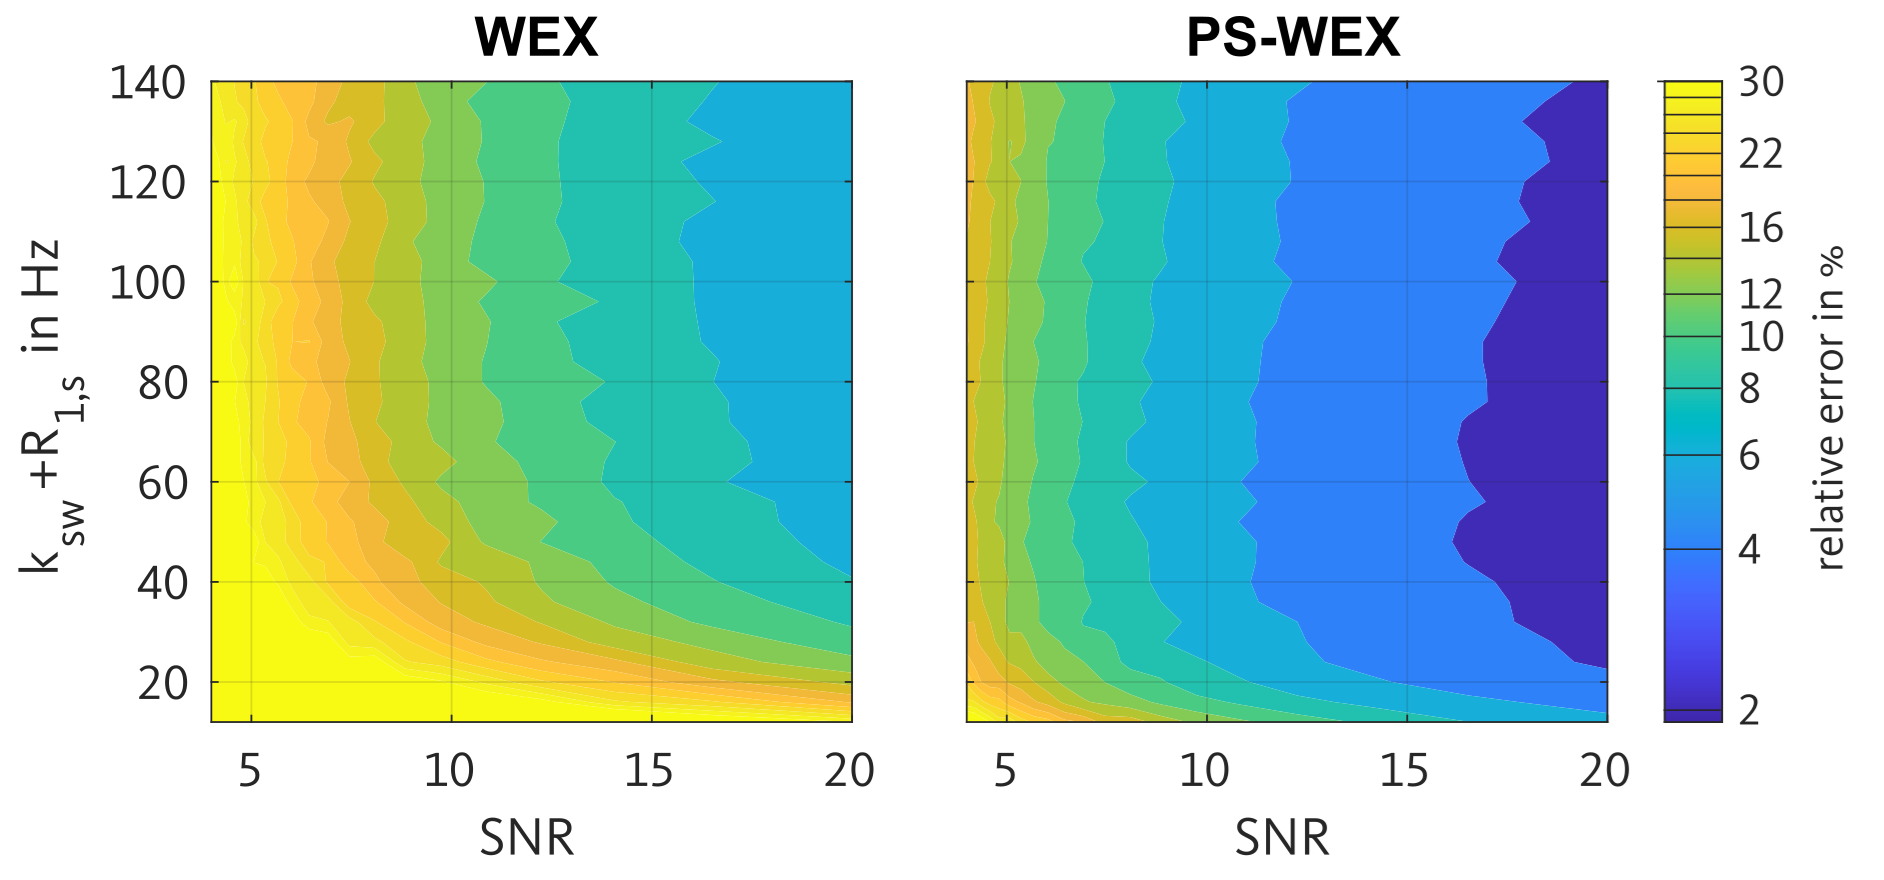
To verify equation (2), extended phase graph (EPG) simulations11 were used in combination with the extension for chemical exchange recently presented by Malik12. The simulations were implemented in Matlab (R2019a, The MathWorks, Natick Ca USA) based on the code provided by Hargreaves13. The $$$t_m$$$ and $$$\tau_p$$$ sampling were chosen analogously to the experiment. The exchange rate was sampled from 12 to 140Hz in 4Hz steps.Results
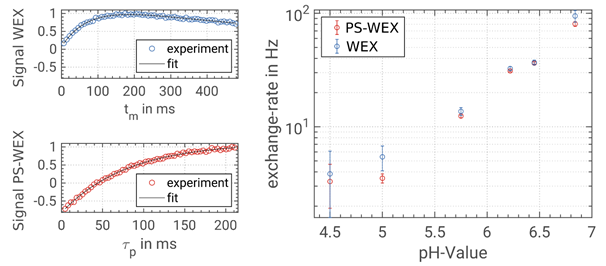
In Figure 2, EPG simulations of the PS-WEX sequence exhibit a factor 2 increased sensitivity compared to the WEX sequence. This is due to the factor 2 increased dynamic range of the PS-WEX signal curve supported by its mono-exponential behavior. In total, a SNR boost of about 2 is observable.Figure 3 depicts the experimentally determined exchange rates in dependence of the pH-value by WEX and PS-WEX. In theory, an exponential dependence between exchange rates and pH-value is expected, which is used as an objective criterion. Both methods are in good agreement with the expected exponential course. The correlation coefficients are 0.96 for WEX and 0.97 for PS-WEX.
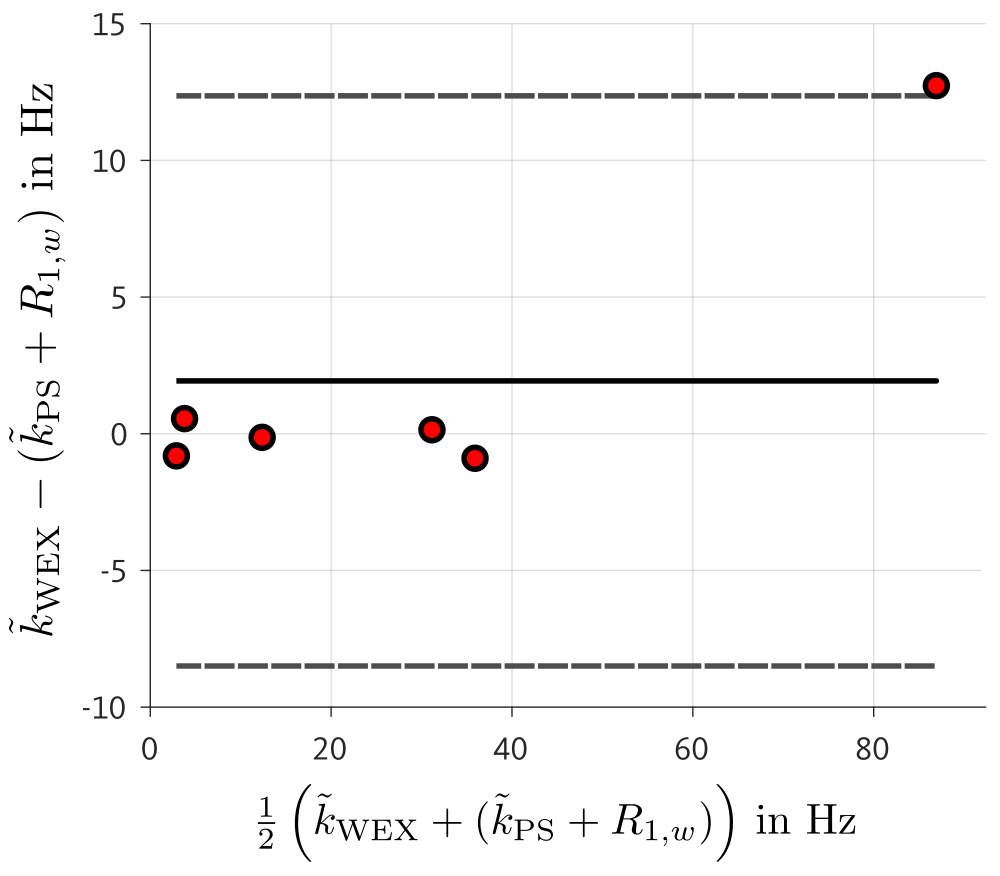
Figure 4 shows a direct comparison of the experimentally determined exchange rates via a Bland-Altman plot of both methods. No systematic deviation is visible between both methods.
Discussion
With PS-WEX a new approach for spectroscopic exchange rate quantification is presented. Experimental results confirm the ability of the PS-WEX approach to measure exchange rates with high reliability. By introducing the inversion pulse in the fixed mixing-time, a higher dynamic range and a mono-exponential signal curve is obtained. These properties lead to a more accurate fit of the effective exchange parameters. This could be shown in both simulations and experimental data.Acknowledgements
No acknowledgement found.References
[1] Van Zijl PCM, Yadav NN. Chemical exchange saturation transfer (CEST): What is in a name and what isn’t? Magnetic Resonance in Medicine 2011;65(4):927–948.
[2] Goerke S, Zaiss M, Bachert P. Characterization of creatine guanidinium proton exchange by water-exchange (WEX) spectroscopy for absolute-pH CEST imaging in vitro. NMR in Biomedicine 2014;27(5):507–518.
[3] McMahon MT, Gilad AA, Zhou J, Sun PZ, Bulte JWM, Van Zijl PCM. Quantifying exchange rates in chemical exchange saturation transfer agents using the saturation time and saturation power dependencies of the magnetization transfer effect on the magnetic resonance imaging signal (QUEST and QUESP): pH calibration for poly. Magnetic Resonance in Medicine 2006;55(4):836–847.
[4] Sun PZ, Longo DL, Hu W, Xiao G, Wu R. Quantification of iopamidol multi-site chemical exchange properties for ratiometric chemical exchange saturation transfer (CEST) imaging of pH. Physics in Medicine and Biology 2014;59(16):4493– 4504.
[5] Mori S, van Zijl PC, Johnson MO, Berg JM. Water Exchange Filter (WEX Filter) for Nuclear Magnetic Resonance Studies of Macromolecules. Journal of the American Chemical Society 1994;116(26):11982–11984.
[6] Hwang TL, Van Zijl PC, Mori S. Accurate quantitation of water-amide proton exchange rates using the Phase-Modulated CLEAN chemical EXchange (CLEANEX-PM) approach with a Fast-HSQC (FHSQC) detection scheme. Journal of Biomolecular NMR 1998;11(2):221–226.
[7] Mori S, Abeygunawardana C, Van Zul PC, Berg JM. Water exchange filter with improved sensitivity (WEX II) to study solvent-exchangeable protons. Application to the consensus zinc finger peptide CP-1. Journal of Magnetic Resonance - Series B 1996;110(1):96–101.
[8] Mori S, Eleff SM, Pilatus U, Mori N, Van Zijl PC. Proton NMR spectroscopy of solvent-saturable resonances: A new approach to study pH effects in situ. Magnetic Resonance in Medicine 1998;40(1):36–42.
[9] Van Zijl PC, Zhou J, Mori N, Payen JF, Wilson D, Mori S. Mechanism of magnetization transfer during on-resonance water saturation. A new approach to detect mobile proteins, peptides, and lipids. Magnetic Resonance in Medicine 2003; 49(3):440–449.
[10] Zhou J, Wilson DA, Sun PZ, Klaus JA, Van Zijl PCM, Zijl PCMV. Quantitative Description of Proton Exchange Processes between Water and Endogenous and Exogenous Agents for WEX, CEST, and APT Experiments. Magnetic Resonance in Medicine 2004;51(5):945–952
[11] Weigel M. Extended phase graphs: Dephasing, RF pulses, and echoes - Pure and simple. Journal of Magnetic Resonance Imaging 2015;41(2):266–295.
[12] Malik SJ, Teixeira RPA, Hajnal JV. Extended phase graph formalism for systems with magnetization transfer and exchange. Magnetic Resonance in Medicine 2018; 80(2):767–779.
[13] Hargreaves Ba, Miller K. Using Extended Phase Graphs: Review and Examples. ISMRM 21st Annual Meeting 2013;21:3718.
Figures