0291
Cortical layer-specific neurochemical profiles in the in-vivo mouse brain1Core Facility Small Animal Imaging (CF-SANI), University of Ulm, Ulm, Germany, 2Center for Magnetic Resonance Research, University of Minnesota, Minneapolis, MN, United States, 3German Center for Neurodegenerative Diseases (DZNE), Ulm, Germany
Synopsis
The goal of this study was to demonstrate the feasibility to detect neurochemical differences in sub-cortical domains of the murine brain, namely upper (I-IIII) and deep (V-VI) layers. To achieve sub-microliter voxel prescription in these layers, an ultra-high field of 11.7T was used along with the single-voxel LASER sequence. Results show significantly higher taurine (13%) and phosphatidylethanolamine (36%) concentrations in the superficial cortex region compared to the deep layer, in good agreement with cellular composition of these two regions.
Purpose:
Current spectroscopy investigation of brain cortex severely underestimates the intrinsic heterogeneity of this structure: different cortical layers are characterized by unique cellular composition, transcriptomic profile, fiber and white matter arrangements (1-4); furthermore, neuronal subpopulations in different layers display selective vulnerability to disease. However, so far it has been impossible to resolve sub-domains within the cortex, with the whole cortical considered, erroneously, as a homogeneous volume in MRS studies. Sub-microliter MRS using the LASER sequence together using cryogenically cooled RF coil (5) has been here employed to achieve for the first time an in-vivo spatial resolution sufficient to resolve cortical layer-specific small-molecules fingerprints and intracortical differences in metabolites.Methods:
Experiments were performed on an 11.7T small animal system (117/16 USR BioSpec, AVANCE III, ParaVision 6.01, Bruker BioSpin, Ettlingen, Germany). Cryogenically cooled 2-element phased-array transmit/receive coil was employed for excitation and signal reception. A home-built head restrainer was used to properly immobilize the animal's head during measurements, ensuring stability and reproducibility of the experimental setup. Volume-of-interests (VOIs) were planned based on T1-weighted multi-slice FLASH (TR/TE=193/5ms, FA=17.5°) images. Field homogeneity was adjusted using MAPSHIM. LASER (6) (TR/TE=5000/16.75ms, averages=386) combined with VAPOR water suppression was used (7). In-vivo 1H MR spectra were acquired from 0.837 mm3 (1.5x0.427x1.3 mm3) volume located in the upper motor cortex region (layer I-IV) below the pia mater and a deeper motor cortex region (layer V-VI) bordering with the corpus callosum of eight adult female C57BL/6. Single-shot data were frequency and phase corrected prior to summation (8). Unsuppressed water signal was used as an internal reference as well as for eddy current, zero-order and first-order phase correction. Absolute metabolite concentrations were obtained with LCModel (spectrum fitted from 0.5–4.2 ppm) (9) using simulated basis sets with measured macromolecule spectrum. Metabolite concentrations with a Cramér–Rao lower bound (CRLB) ≤ 50% in at least half of the spectra in each cortical region were used for statistical analysis. Sum of metabolites was reported (e.g. tCr, tCho) when a high correlation existed between two metabolites (r<-0.5).Results:
Representative water-suppressed in vivo proton MR summed spectra of the investigated mouse motor cortex layers clearly show the well-resolved resonances of numerous cerebral metabolites signals (Fig. 1), obtained with sufficiently consistent spectral quality. The average FWHM found by LCModel was 0.02 ± 0.00 ppm (10.0 ± 0.0 Hz) in both superficial (layer I-IV) and deeper (layers V-VI) motor cortex layers. Corresponding SNRs were 14.13 ± 1.64 for (layer I-IV) and 14.36 ± 1.16 for (layers V-VI). Average CRLB for Glx, tNAA, tCr and NAA was ≤ 3% and for many other major metabolites were ≤ 10% in both regions. The high spectral quality achieved over the entire chemical shift range ensured reliable and reproducible quantification of the brain metabolites. The first detailed comparison of motor cortex layers neurochemical profiles of C57BL/6 mice is shown in Fig. 2. In a two-way ANOVA, neurochemical composition of the superficial and deep cortical layers was contrasted, demonstrating a significant effect of the cortical layer positioning (F1,256=9.45, p=0.0023). Post-hoc analysis (with Sidak´s multiple-comparisons correction) revealed a substantial difference in taurine concentration, which was significantly more abundant in upper layers (10.44±1.30 µmol/g in upper layers vs 9.27±0.92 µmol/g in deeper layers, p=0.038). A trend toward higher levels of PE in upper layers was also detected (3.91±0.54µmol/g in upper layers vs 2.87±0.92µmol/g in deeper layers p=0.10). If a two-stage linear step-up procedure (Benjamini, Krieger and Yekutieli) was applied to account for False Discovery Rate (q=0.05), significant differences were identified in Taurine between upper and lower layers (p=0.0020) as well as for PE (p=0.0057). Thus, despite the small VOI size, sub-microlitre MRS could detect comparatively small (Cohen´s effect size d=0.84 for taurine) differences in the metabolite composition of upper and lower cortical layers.Discussion:
To the best of our knowledge, this is the first demonstration that MR spectra can be obtained for sub-cortical domains. This constitutes a major advance in MRS spatial resolution, in particular when compared to previous determinations in which whole cortex, and often large VOI encompassing several cortical areas, were employed. This approach promises to be highly relevant in the study of murine models of neurodegenerative diseases, such as motoneuron disease, in which only a subset of cortical neurons undergoes degeneration; as of today, the investigation of the earliest changes in disease has been prevented by the dilutional effect forced by the use of very large VOIs to obtain reliable MR spectra. Notably, the metabolic profiles of different layers (in terms of higher Taurine and PE levels in upper cortical layers) are fully compatible with differences identified by histological methods (10), providing independent confirmation of the MRS findings. Furthermore, PE levels measured by MRS (corresponding to an estimate of cellularity, and/or mitochondrial content) is coherent with the higher neuronal density measured in layers I-IV (11) and the larger content of mitochondria of upper layers (12). In summary, the sub-microlitre MRS paradigm we describe opens a new window to the definition of subpopulation-specific metabolic changes in brain cortex in vivo and to the investigation of metabolic modifications characteristic of cortical lamination.Acknowledgements
DKD acknowledges support from the following National Institutes of Health grants: P41 EB027061, P30 NS076408; DFG grant no. 251293561 to FRReferences
1. Amunts K, Zilles K. Architectonic Mapping of the Human Brain beyond Brodmann. Neuron . 2015 Dec 16;88(6):1086-1107
2. Nieuwenhuys R. The myeloarchitectonic studies on the human cerebral cortex of the Vogt-Vogt school, and their significance for the interpretation of functional neuroimaging data. Brain Struct Funct. 2013;218(2):303-352.
3. Trampel R, Bazin PL, Pine K, Weiskopf N. In-vivo magnetic resonance imaging (MRI) of laminae in the human cortex. Neuroimage. 2019;197:707-715.
4. Palomero-Gallagher N, Zilles K. Cortical layers: Cyto-, myelo-, receptor- and synaptic architecture in human cortical areas. Neuroimage. 2019;197:716-741.
5. Abaei A, Deelchand D, Roselli F, Rasche V. Towards sub-microlitre MRS in the mouse brain in vivo at ultra-high field. In: Proc 28th Scientific Meeting ISMRM; 2020:0372.
6. Garwood, M. & DelaBarre, L. The return of the frequency sweep: designing adiabatic pulses for contemporary NMR. J Magn Reson 153, 155-177, (2001).
7. Tkac I, Starcuk Z, Choi IY, Gruetter R. In vivo 1H NMR spectroscopy of rat brain at 1 ms echo time. Magn Reson Med (1999) 41:649.
8. http://www.cmrr.umn.edu/downloads/mrspa
9. Provencher, Automatic quantitation of localized in vivo 1H spectra with LCModel. NMR Biomed (2001) 14:260.
10. Kritzer MF, Cowey A, Ottersen OP, Streit P, Somogyi P. Immunoreactivity for Taurine Characterizes Subsets of Glia, GABAergic and non-GABAergic Neurons in the Neo- and Archicortex of the Rat, Cat and Rhesus Monkey: Comparison with Immunoreactivity for Homocysteic Acid. Eur J Neurosci. 1992;4(3):251-270.
11. Keller D, Erö C, Markram H. Cell Densities in the Mouse Brain: A Systematic Review. Front Neuroanat. 2018;12:83. Santuy A, Turégano-López M, Rodríguez JR, Alonso-Nanclares L, DeFelipe J, Merchán-Pérez A.
12. A Quantitative Study on the Distribution of Mitochondria in the Neuropil of the Juvenile Rat Somatosensory Cortex. Cereb Cortex. 2018;28(10):3673-3684.
Figures
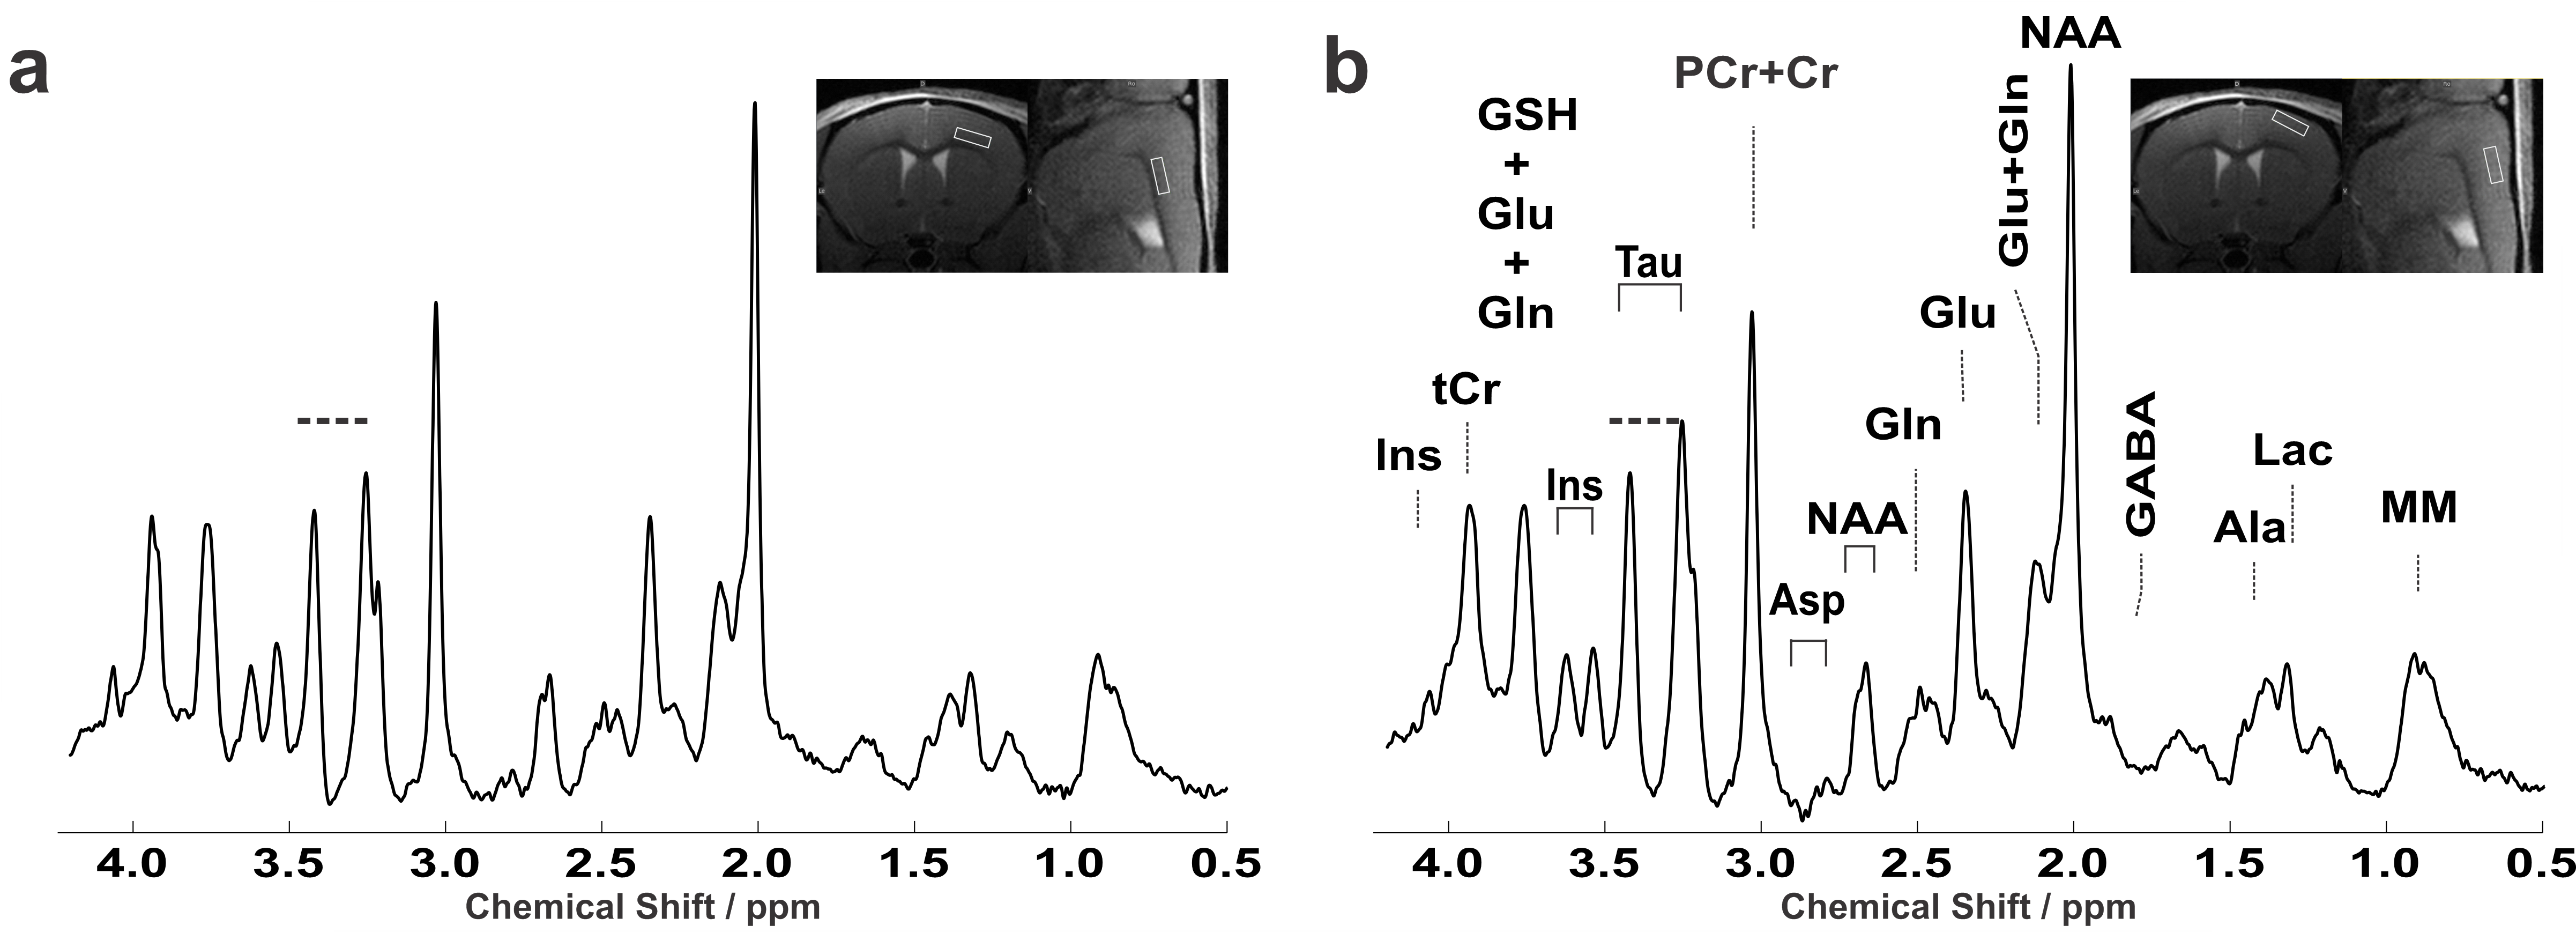
Figure 1: Representative in vivo 1H spectra from all animals measured from 0.837 µl volume, located in the deeper (layers V-VI) (a) and superficial (layer I-IV) (b) motor cortex layers of the adult female C57BL/6 mouse. LASER sequence, TR/TE: 5000/16.75 ms: 10 kHz spectral width, 4096 data points and 386 averages. For display purposes, a Gaussian multiplication (gf = 0.12 s) was applied. Insets show FLASH images with the selected VOI locations.
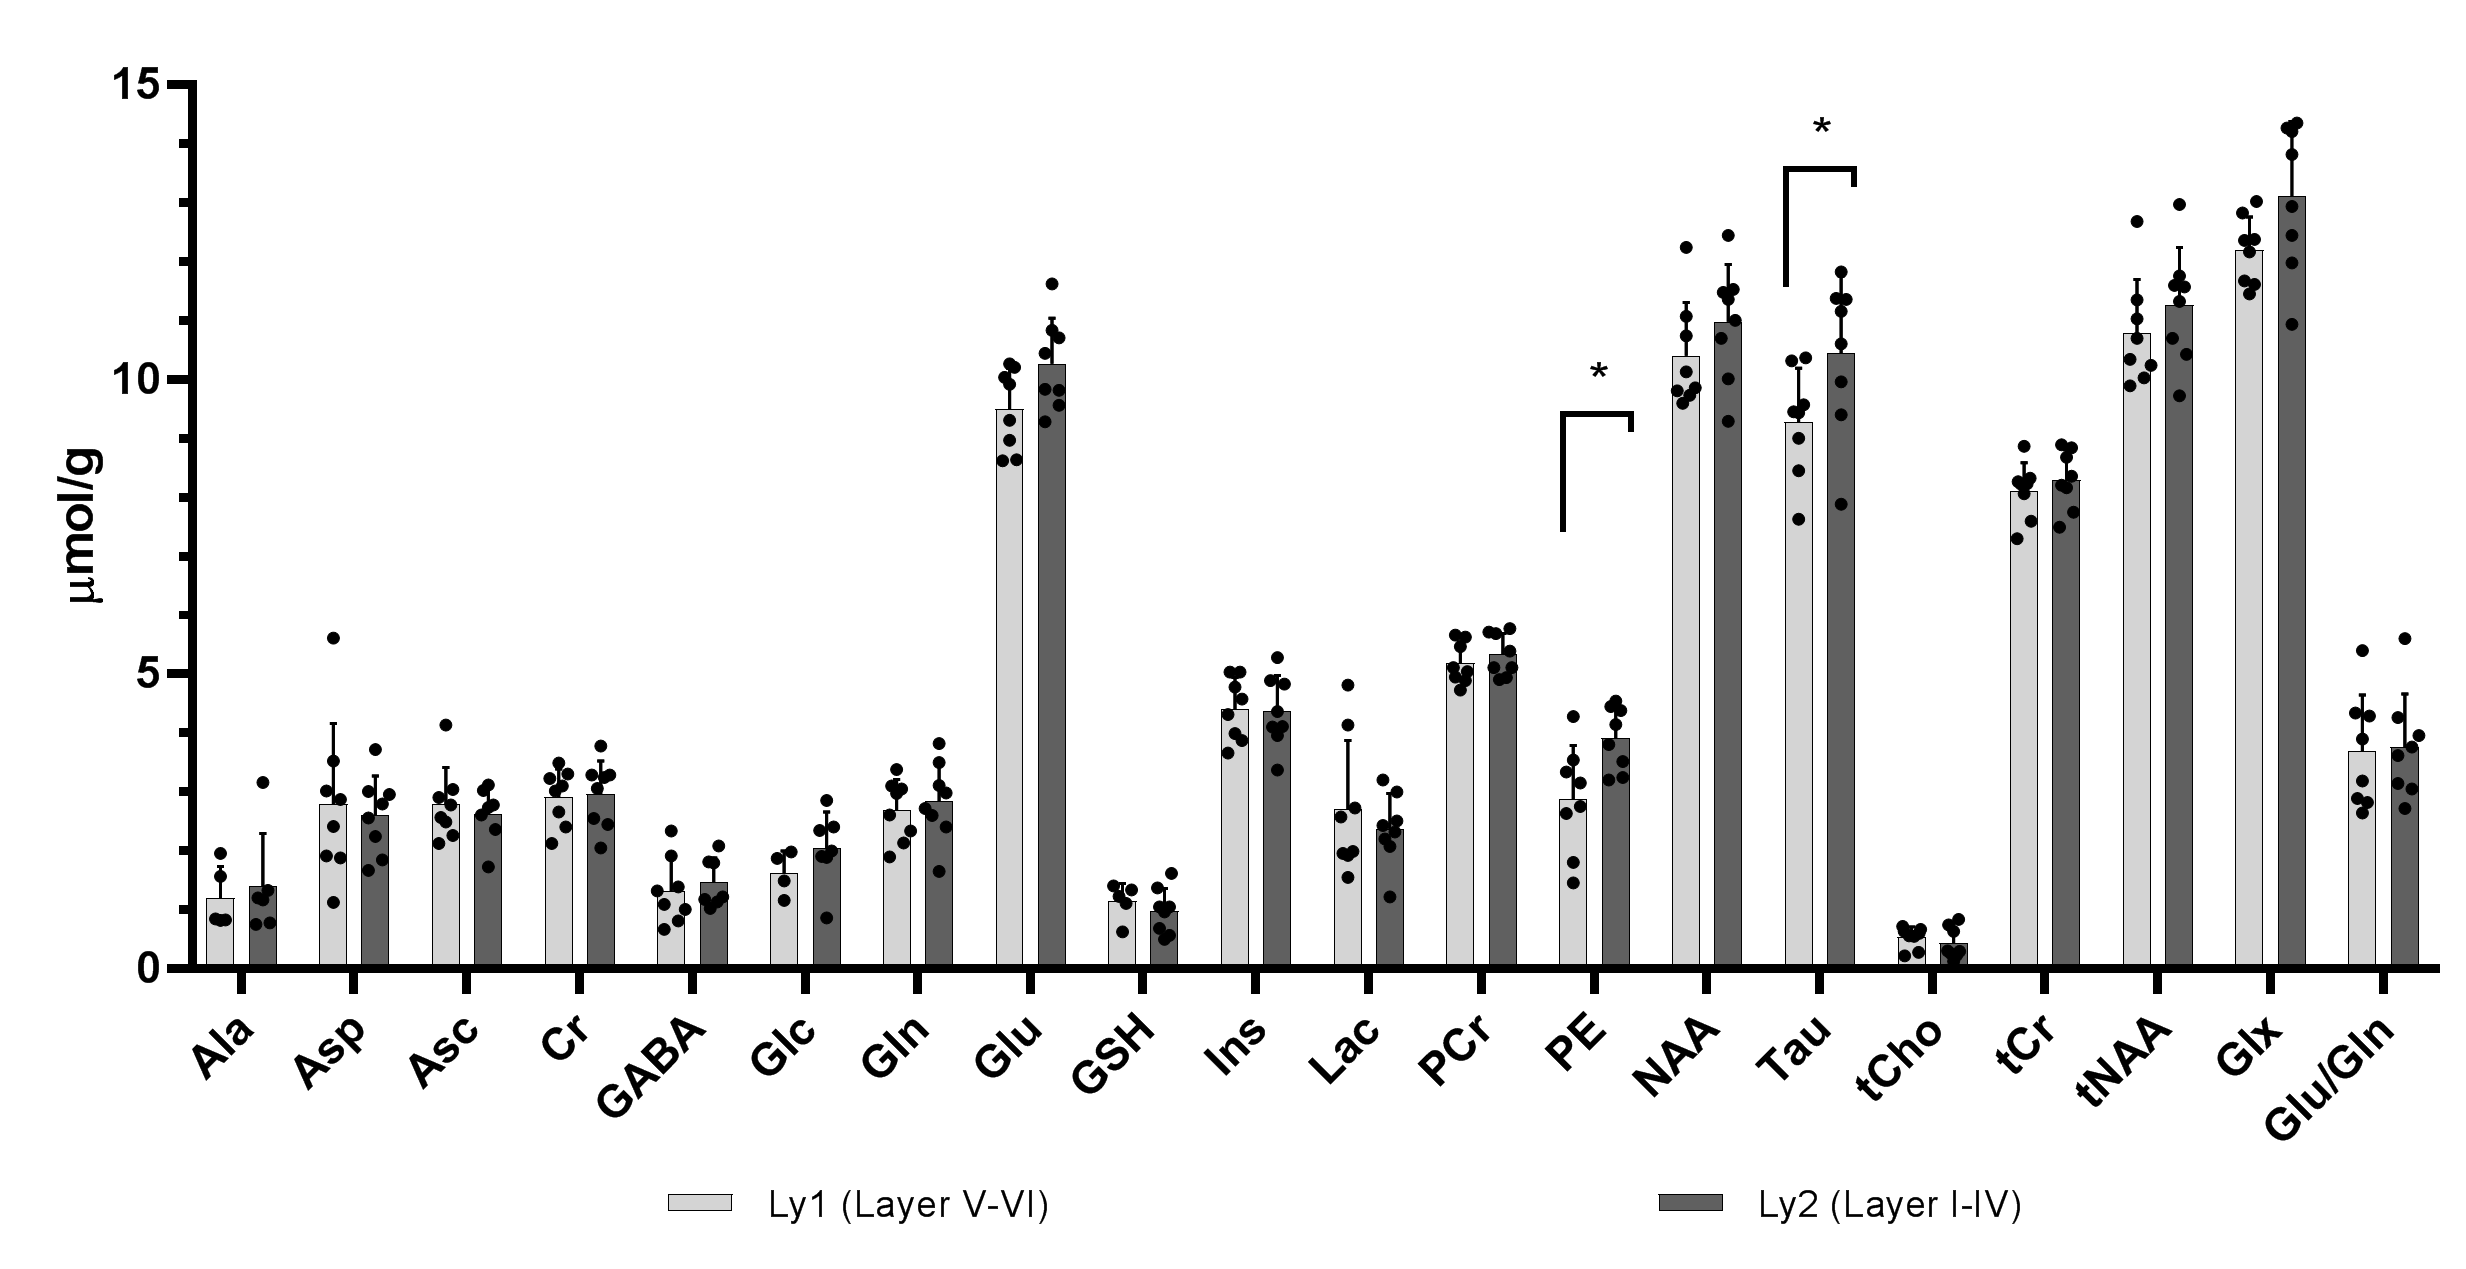
Figure 2: Region-specific neurochemical profile differences in cortical areas of C57BL/6 mouse. Mean measured metabolite concentrations in the deeper (layers V-VI) (a) and superficial (layer I-IV) (b) motor cortex layers (n = 8) of mature mice (>3 months). NAAG and scyllo-Ins were not detected with CRLB ≤ 50% in at least half of the spectra in each motor cortex layer.