0290
First in-human technique translation of OE-MRI for hypoxia imaging onto an MR Linac system in patients with head and neck cancer
Michael J Dubec1,2, Anubhav Datta1,3, Ross A Little1, Abigael Clough4, David L Buckley2,5, Christina Hague6, Damien McHugh1,2, Michael Berks1, Susan Cheung1, Amal Salah7, David Higgins8, Cynthia L Eccles1,4, Robert Bristow1,6, Josephine H Naish9,10, Julian C Matthews11, Peter Hoskin1,6,12, Marcel van Herk1, Geoff JM Parker10,13, Ananya Choudhury1,6, Andrew McPartlin6, and James PB O'Connor1,3,14
1Division of Cancer Sciences, University of Manchester, Manchester, United Kingdom, 2Christie Medical Physics and Engineering, The Christie NHS Foundation Trust, Manchester, United Kingdom, 3Radiology, The Christie NHS Foundation Trust, Manchester, United Kingdom, 4Radiotherapy, The Christie NHS Foundation Trust, Manchester, United Kingdom, 5Biomedical Imaging, University of Leeds, Leeds, United Kingdom, 6Clinical Oncology, The Christie NHS Foundation Trust, Manchester, United Kingdom, 7Proton Beam Therapy, The Christie NHS Foundation Trust, Manchester, United Kingdom, 8Philips, Manchester, United Kingdom, 9MCMR, University of Manchester NHS Foundation Trust, Manchester, United Kingdom, 10Bioxydyn Ltd, Manchester, United Kingdom, 11Neuroscience and Experimental Psychology, University of Manchester, Manchester, United Kingdom, 12Radiotherapy, Mount Vernon, London, United Kingdom, 13Centre for Medical Image Computing, Unversity College London, London, United Kingdom, 14Radiotherapy and Imaging, Institute of Cancer Research, London, United Kingdom
1Division of Cancer Sciences, University of Manchester, Manchester, United Kingdom, 2Christie Medical Physics and Engineering, The Christie NHS Foundation Trust, Manchester, United Kingdom, 3Radiology, The Christie NHS Foundation Trust, Manchester, United Kingdom, 4Radiotherapy, The Christie NHS Foundation Trust, Manchester, United Kingdom, 5Biomedical Imaging, University of Leeds, Leeds, United Kingdom, 6Clinical Oncology, The Christie NHS Foundation Trust, Manchester, United Kingdom, 7Proton Beam Therapy, The Christie NHS Foundation Trust, Manchester, United Kingdom, 8Philips, Manchester, United Kingdom, 9MCMR, University of Manchester NHS Foundation Trust, Manchester, United Kingdom, 10Bioxydyn Ltd, Manchester, United Kingdom, 11Neuroscience and Experimental Psychology, University of Manchester, Manchester, United Kingdom, 12Radiotherapy, Mount Vernon, London, United Kingdom, 13Centre for Medical Image Computing, Unversity College London, London, United Kingdom, 14Radiotherapy and Imaging, Institute of Cancer Research, London, United Kingdom
Synopsis
Tumour hypoxia is associated with poor treatment outcome, tumour progression and treatment resistance. Oxygen-enhanced (OE)-MRI has shown promise as a non-invasive method for mapping and quantifying hypoxia. We demonstrate, for the first time, the application of the OE-MRI technique in patients with head and neck carcinoma to monitor changes in hypoxia due to treatment, and translate the technique onto an MR Linac system, demonstrating feasibility in a first-in-human study.
Introduction
Hypoxia is associated with tumour progression and treatment resistance. Oxygen-enhanced (OE)-MRI is a non-invasive method for mapping and quantifying the extent of regional hypoxia1. Current analysis methods either measure oxygen-induced change in longitudinal relaxation rate (ΔR1) or identify tumour regions that are perfused but insensitive to oxygen change (oxygen refractory (pOxy-R)), by combining OE-MRI with a perfusion measurement such as dynamic contrast enhanced (DCE)-MRI2. Both analyses have previously detected therapy induced changes in tumour hypoxia in patients with non-small cell lung cancer3. The advent of MR-guided radiotherapy equipment has raised the potential of applying the technique on an MR Linac (MRL) system. We sought to develop OE-MRI in head and neck (H&N) squamous cell carcinoma and then perform a first-in-human translation of OE-MRI onto the MRL, with a longer term aim of using the technique for biologically adaptive radiotherapy4.Methods
Participants were recruited after ethics approval and written informed consent. Imaging was performed on a 1.5 T Philips Ingenia MR-RT (MRSim) and a 1.5 T Elekta-Philips Marlin MRLinac (MRL) system. Analysis was performed in MATLAB (Mathworks).MRSim: Optimised sequence parameters for T1 mapping and OE-MRI are provided in table 1. OE-MRI gas delivery was administered during dynamic series: scans 1-25 (medical air; 21% O2), 26-70 (100% O2) and 71-91 (medical air; 21% O2). A low-flow air-oxygen gas blender (Inspiration Healthcare) ensured 15 l/min flow via a high concentration mask (EcoliteTM, Intersurgical Ltd). The protocol was run in 6 healthy volunteers, each imaged twice (8 ± 3 days apart), and in 4 patients with H&N carcinoma, imaged 1-2 times pre-treatment and then once during chemoradiotherapy (CTRT) at weeks 2-4. In patients, DCE-MRI was acquired after OE-MRI, with sequence parameters provided in table 1 during injection of gadoterate meglumine (Dotarem, Guerbet) at the 8th image, 0.2 ml/kg at 3 ml/s.
T1 maps enabled conversion of OE signal change to ΔR1 (= R1,O2 – R1,air). In volunteers, regions of interest (ROIs) were positioned in the nasal concha (NC), tongue and brain. Mean ΔR1 values and within-subject coefficient of variation (wCV) were obtained for each region. Patient tumour volumes were delineated on T1 weighted post gadolinium (Gd) contrast images. ΔR1 was measured for each tumour and NC (for quality assurance; QA). Perfused tumour voxels (DCE signal increase p < 0.05) were classified as oxygen enhancing (Oxy-E) (suggesting normoxia) or oxygen refractory (Oxy-R) (suggesting hypoxia), based on t-test analysis of air and 100% O2 phases.
MRLinac: Hardware fitting steps included retrofitting of gas delivery in the MRL bunker; installation of gas ports, use of an MR conditional blender (Inspiration Healthcare); and installation of a contrast agent power injector (Bayer-Medrad). MRL sequences were modified slightly due to hardware differences with the intention of matching sequence parameters where possible as shown in table 1. Identical protocols for gas and contrast agent delivery were used on both systems. 4 healthy volunteers and one patient with H&N carcinoma were scanned.
NC ΔR1 was measured in 4 volunteers and compared with those acquired in the averaged MRSim volunteer data (=12 datasets, i.e. 6 volunteers x 2 visits). The patient tumour volume was delineated on a T1 post contrast image and ΔR1 and pOxy-R measurements obtained. Tumour ΔR1 curves were compared between the MRSim pre-treatment patient scan data (i.e. the average of 5 pre-treatment datasets from patients 2, 3 and 4) and the MRL patient.
Results
MRSim: Volunteer ΔR1 curves for the two visits for the NC, tongue and brain regions are shown in Figure 1. Mean ΔR1,NC = 0.059 ± 0.027 s-1 (p < 0.001); ΔR1,Tongue = 0.001 ± 0.012 s-1 (p = 0.86); ΔR1,Brain = 0.005 ± 0.005 s-1 (p = 0.04) (Figure 1A-C). wCV for NC was 21.0% (Figure 1D). Patient ΔR1,NC = 0.056 ± 0.026 s-1 (p < 0.001). ΔR1 increased in the primary tumour in all four patients from pre-treatment values to those measured after commencing CTRT (p = 0.04; Figure 2 A). pOxy-R was found to decrease in 3 of the 4 patients (Figure 2 B).MRLinac: Volunteer ΔR1,NC = 0.065 ± 0.030 (p < 0.001) had a similar trend to that measured on the MRSim (Figure 3A-B), no significant difference in ΔR1,NC was observed (p = 0.6, unpaired t-test). Figure 3C-D shows tumour ΔR1 curves from both systems. MRSim tumour mean ΔR1 = 0.031 ± 0.035 (p < 0.001) (=5 visits from 3 patients). MRL tumour ΔR1 = 0.035 ± 0.011 (p < 0.001) (n=1 patient). First-in-human MRL hypoxia maps are presented in Figure 4 and show distinct ‘hypoxic’ and ‘normoxic’ tumour sub-regions.
Discussion and Conclusion
We investigated OE-MRI for mapping of hypoxia in the context of head and neck carcinoma patients treated with chemoradiotherapy. Healthy volunteer data identified the NC as a useful QA reference to confirm successful gas delivery. We then implemented OE-MRI in 4 patients with H&N cancer all of whom had an increase in ΔR1 in the primary tumour during CTRT, consistent with hypoxia-reduction. Finally, we translated the technique onto the MRL, a system designed to allow anatomical assessment of tumours prior to daily delivery of RT. Collectively, our work is the first to demonstrate the potential feasibility of using OE-MRI for adaptive radiotherapy.Acknowledgements
This work was supported by funding from Cancer Research UK and the Medical Research Council.References
- Dewhirst et al. Oxygen-Enhanced MRI Is a Major Advance in Tumor Hypoxia Imaging. Cancer Res. 2016 Feb;76(4):769-72.
- O’Connor et al. Oxygen-Enhanced MRI Accurately Identifies, Quantifies, and Maps Tumor Hypoxia in Preclinical Cancer Models. Cancer Res. 2016;76(4):787-95.
- Salem A et al. Oxygen-enhanced MRI Is Feasible, Repeatable, and Detects Radiotherapy-induced Change in Hypoxia in Xenograft Models and in Patients with Non-small Cell Lung Cancer. Clin Cancer Res. 2019;25(13):3818-29.
- Datta A, et al. Delivering Functional Imaging on the MRI-Linac: Current Challenges and Potential Solutions. Clin Oncol (R Coll Radiol). 2018;30(11):702-10.
Figures
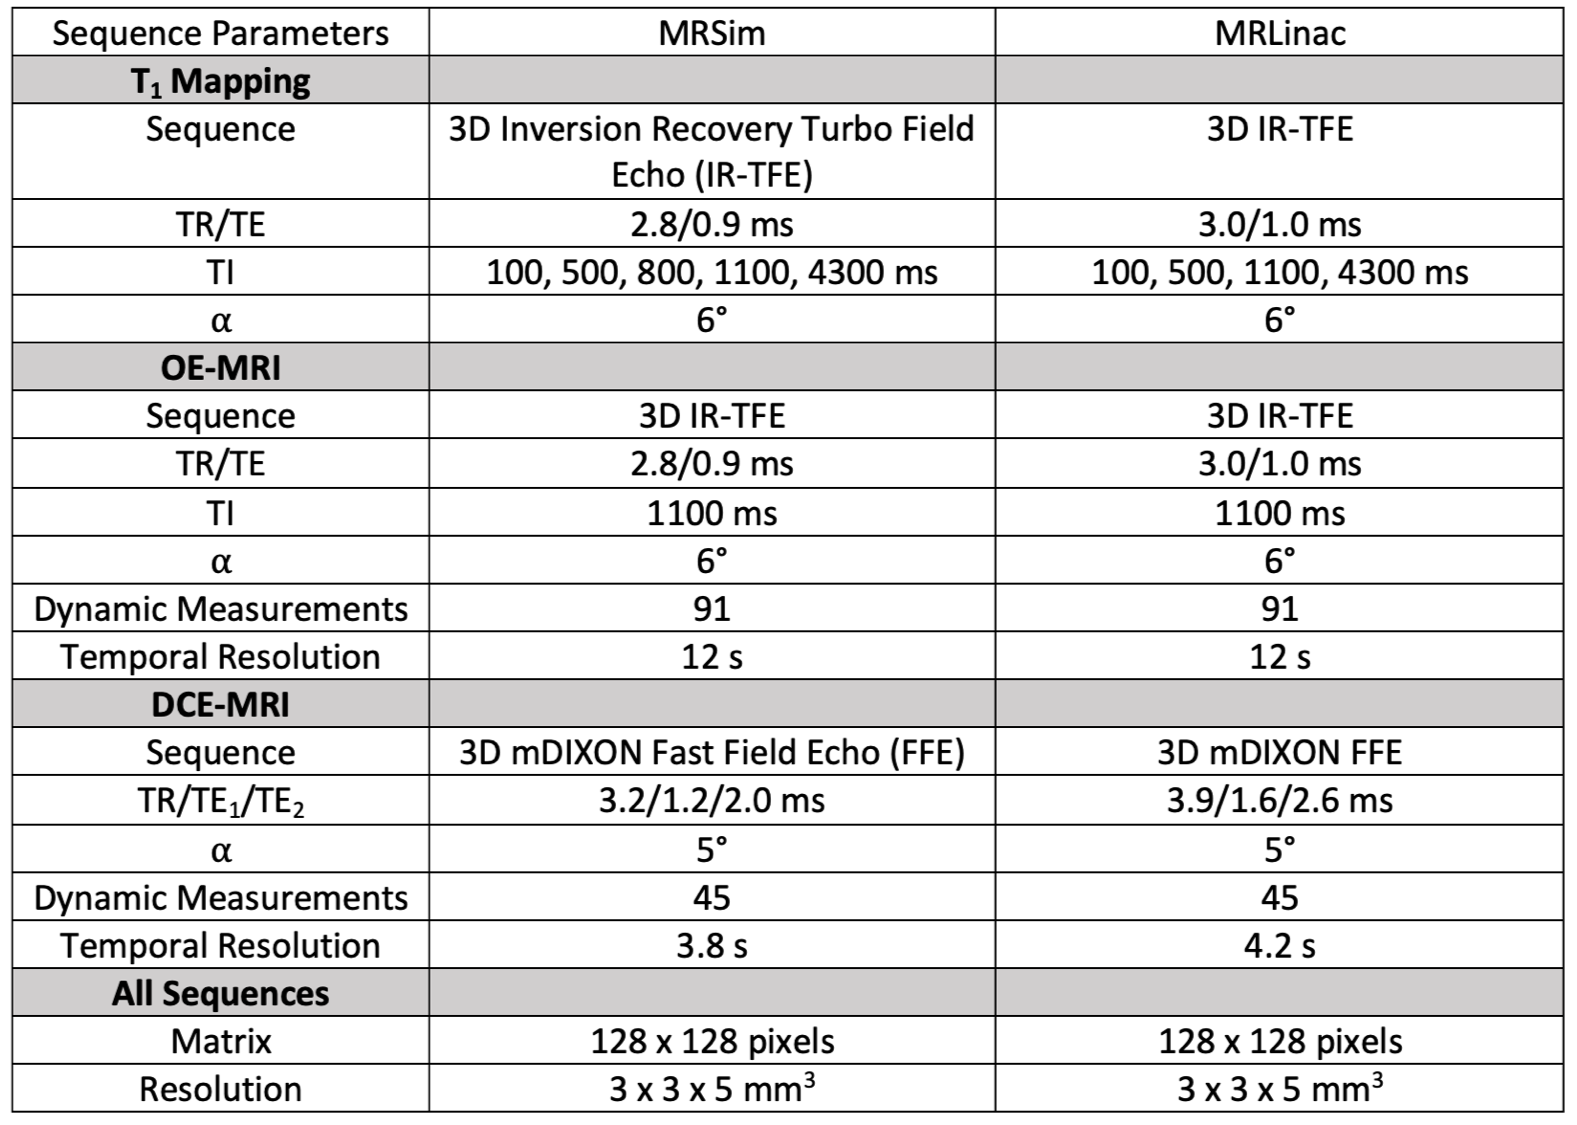
Table 1. Sequence parameters used on the MRSim and MR Linac systems.
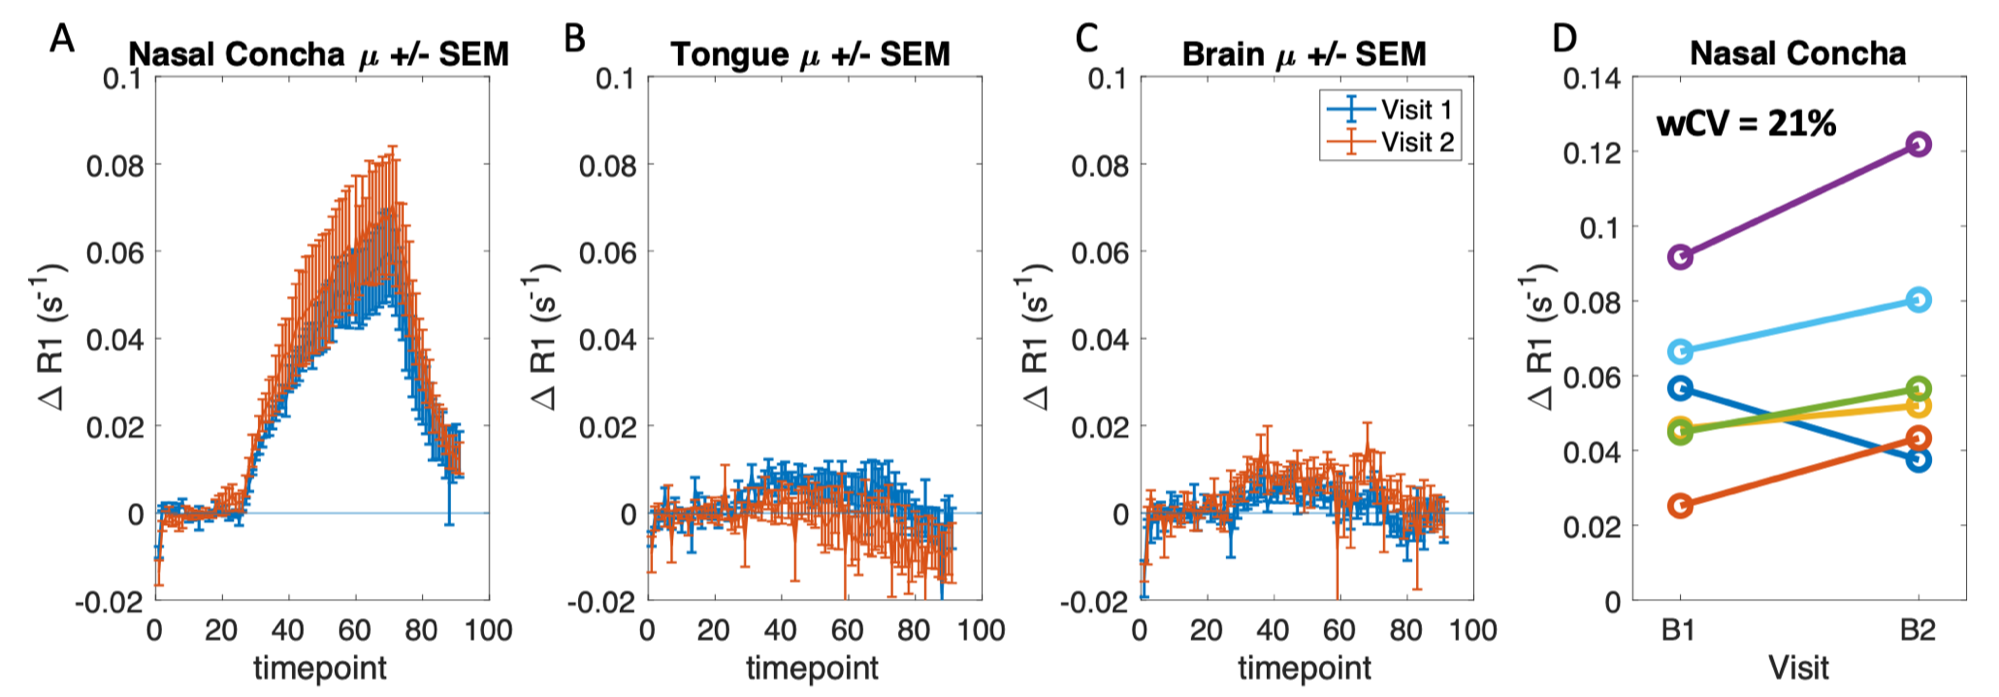
Figure 1: MRSim healthy volunteer mean ± standard error ΔR1 curves plotted for the two baseline visits for (A) nasal concha (B) tongue and (C) brain tissue regions. (D) Mean ΔR1 at each visit for the nasal concha.
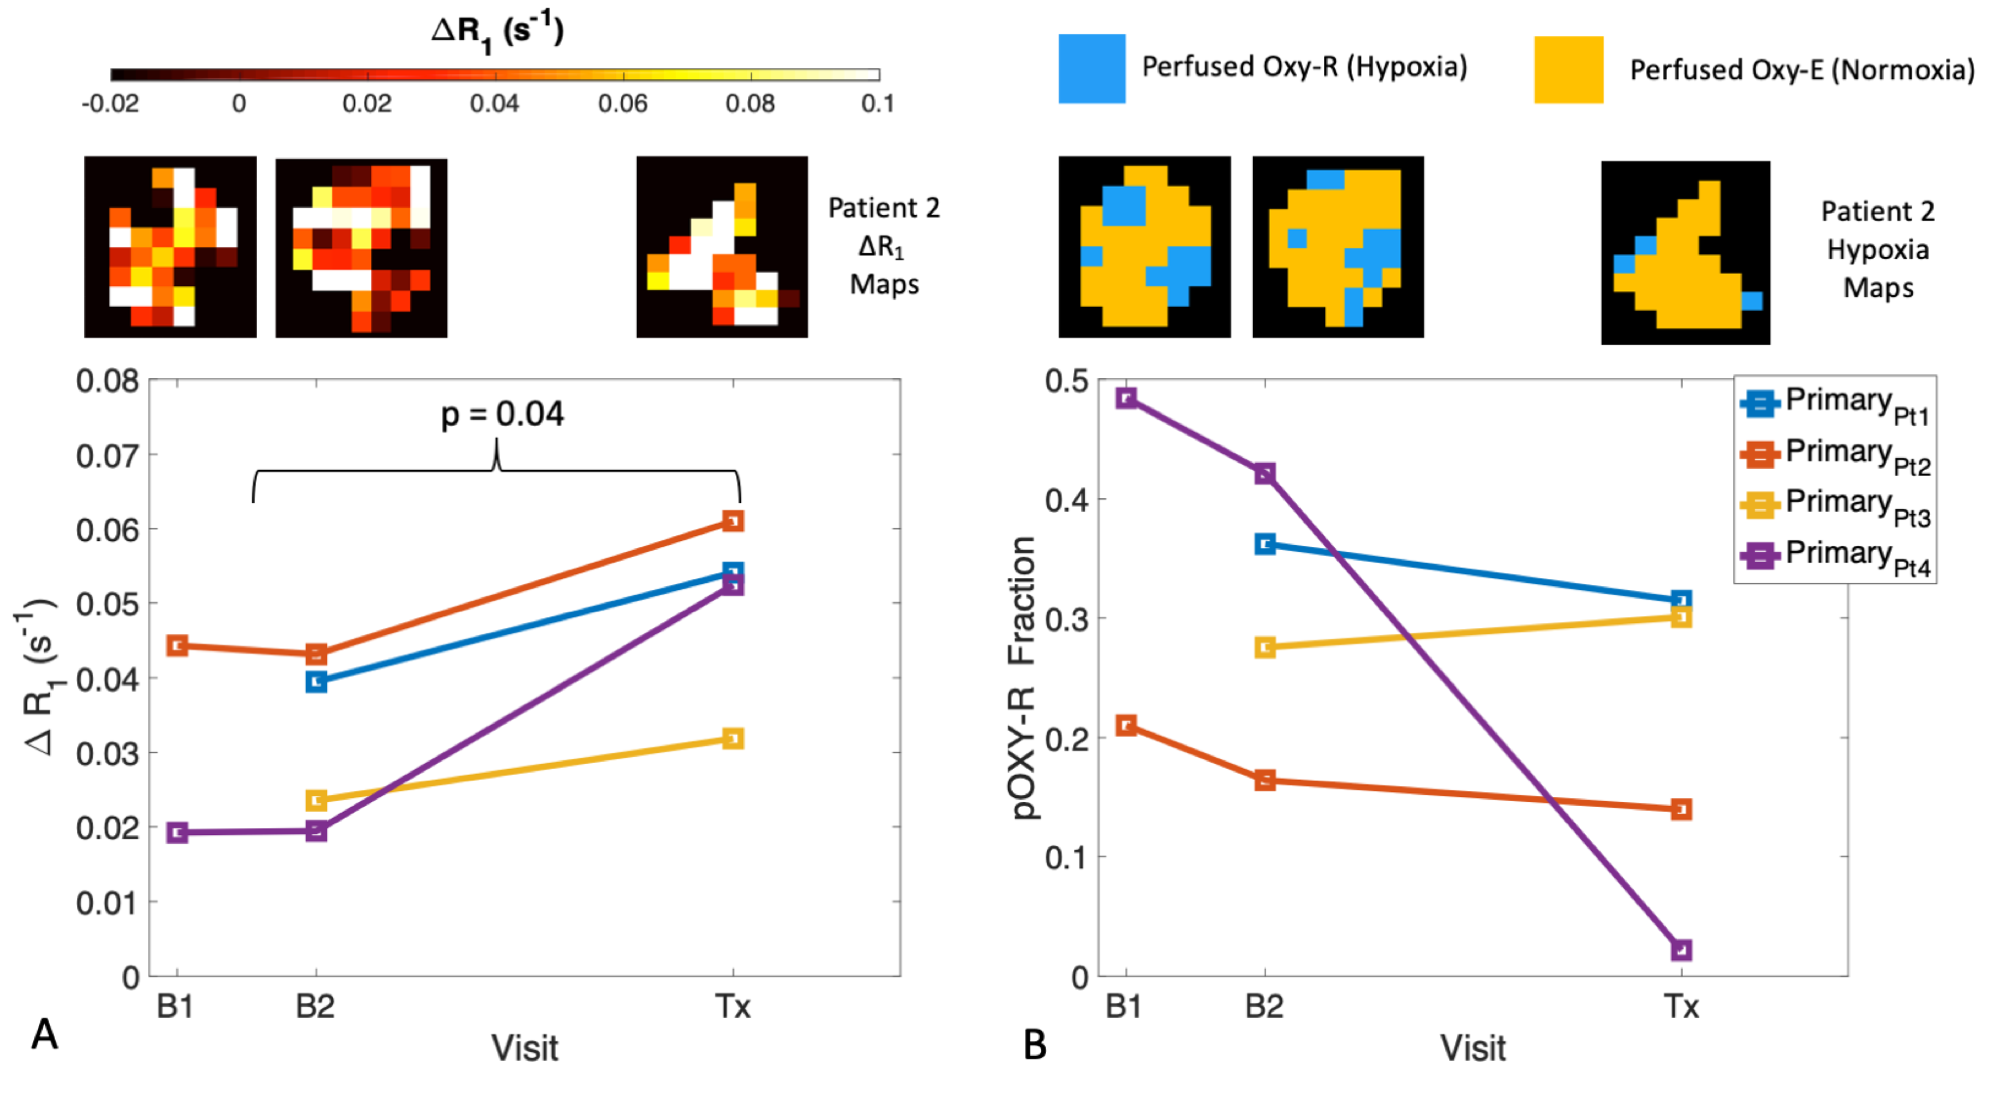
Figure 2. (A) MRSim ΔR1 and (B) pOxy-R measurements in primary tumour are shown for each visit in four patients (either one or two baselines, and one post treatment visit). Corresponding example ΔR1 and pOxy-R maps are shown for patient 2 for the 3 visits.
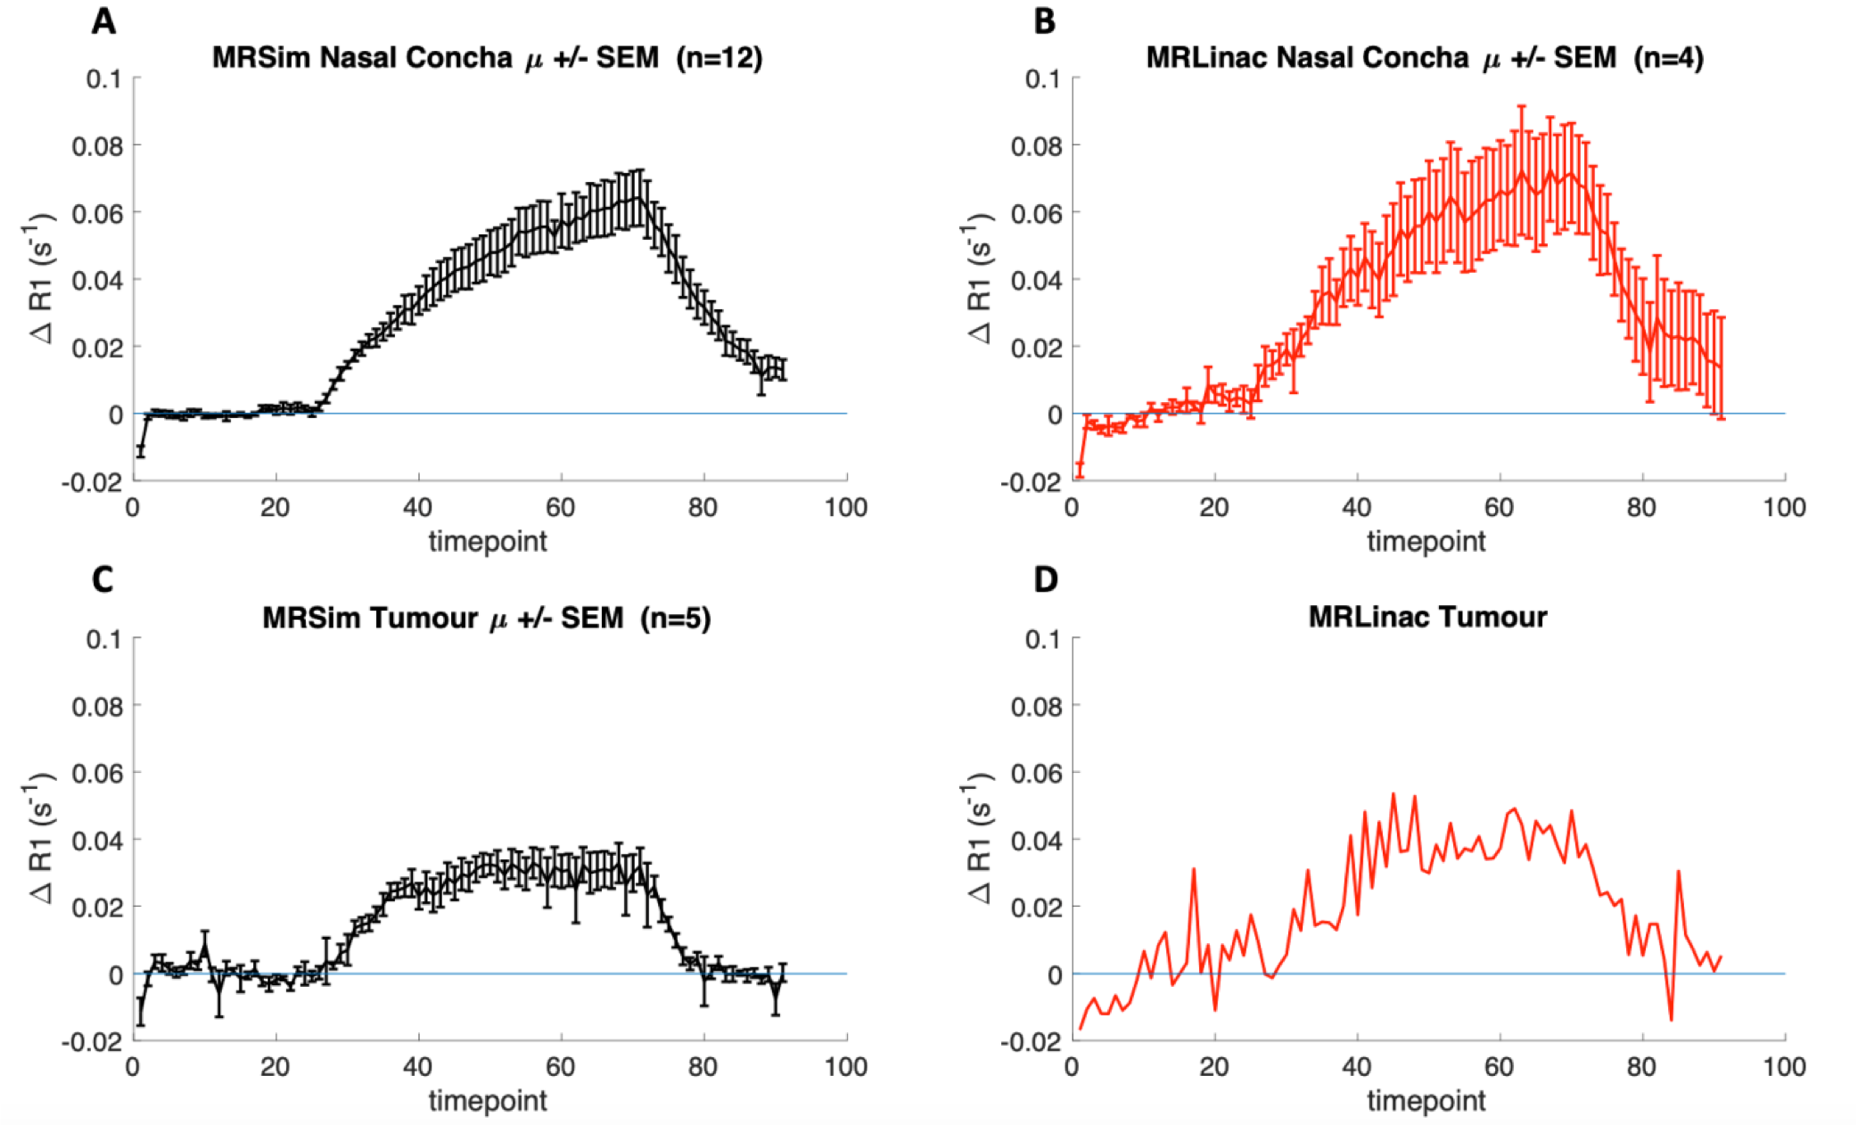
Figure 3. ΔR1 curves for: (A) nasal concha obtained from the average of 12 scan sessions acquired in 6 healthy volunteers on the MRSim, (B) nasal concha obtained from 4 healthy volunteers on MRL, (C) tumour obtained from 5 of the pre-treatment scans (i.e. from patients 2, 3 and 4) and (D) tumour obtained from the first H&N cancer patient imaged with the OE-MRI technique on an MRL.
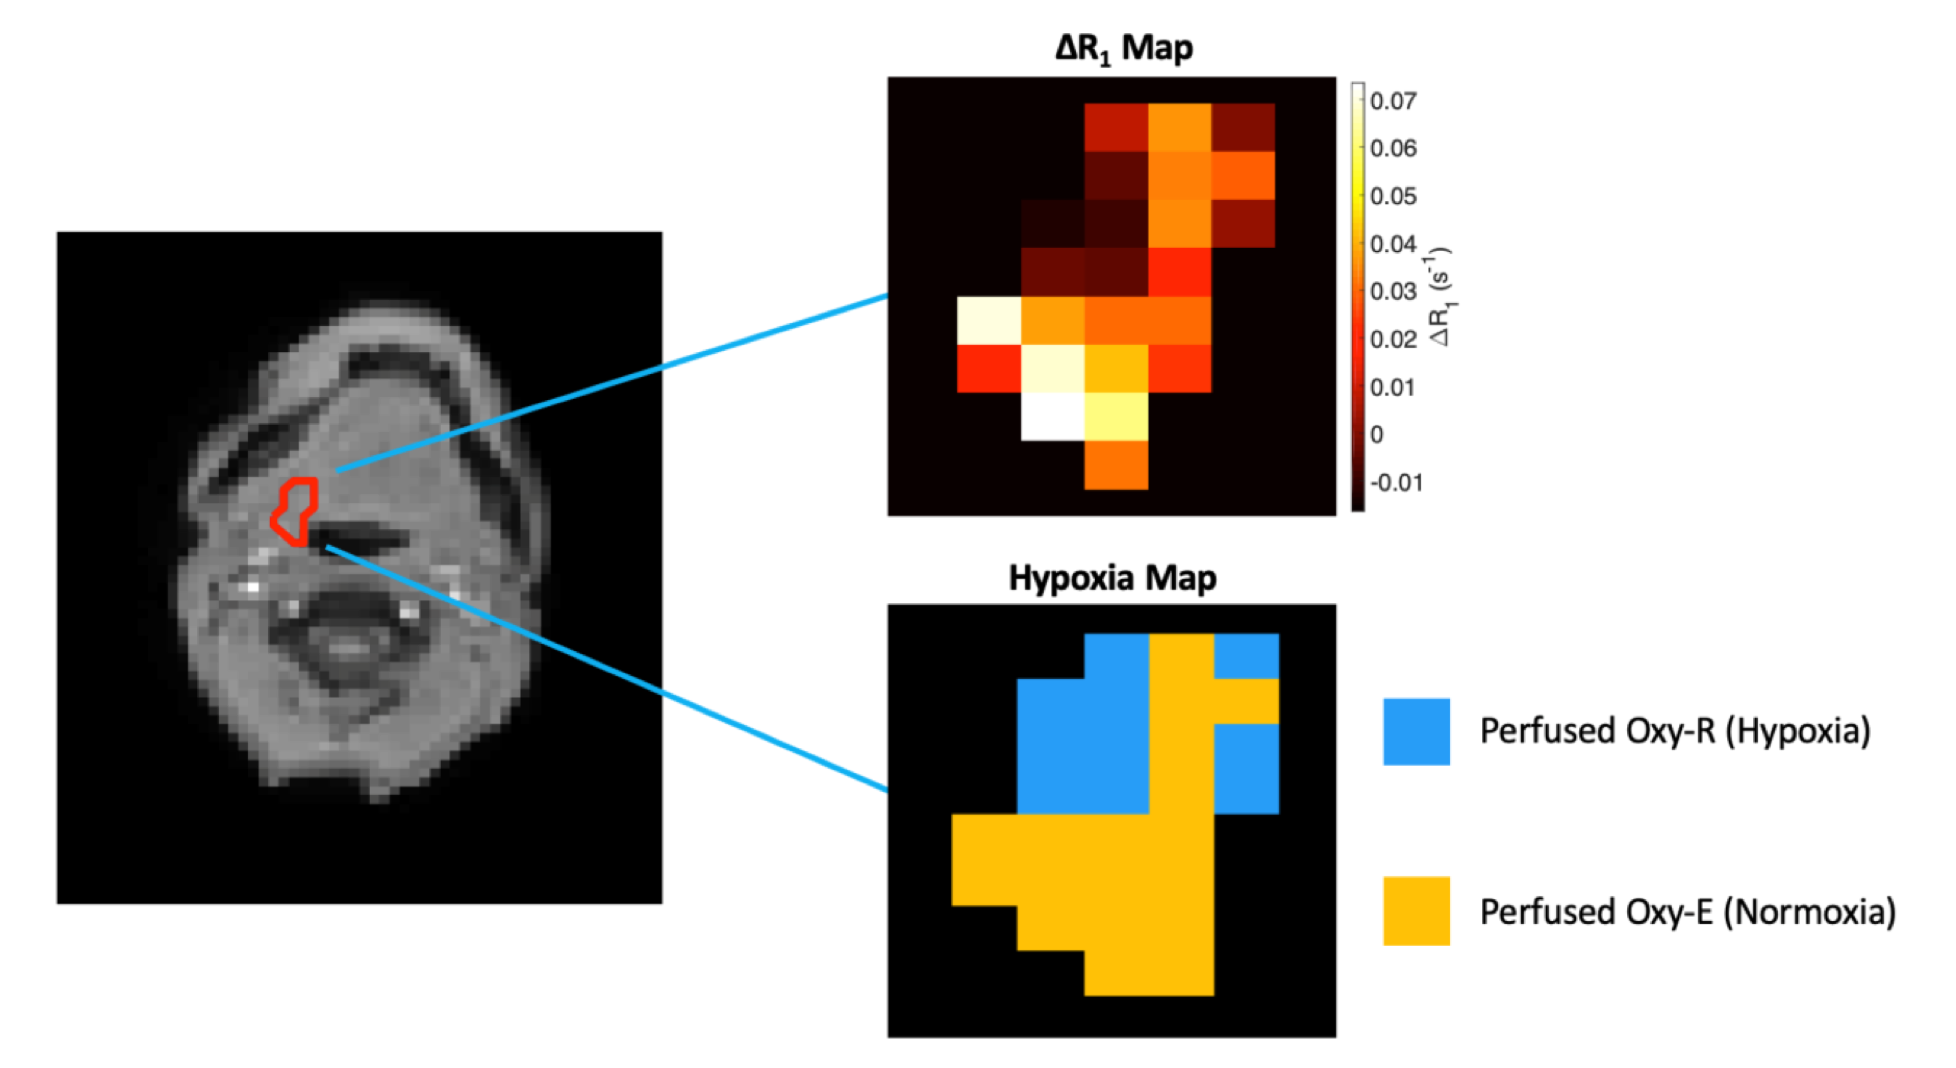
Figure 4. Data from the first H&N cancer patient imaged with combined OE and DCE-MRI on an MRL. Tumour delineated on image with (top) associated oxygen-induced ΔR1 map and (bottom) derived hypoxia map illustrating regions that are perfused and do not enhance with oxygen (Perfused Oxy-R), i.e. suggestive of hypoxia, and regions which enhance on both Gd contrast agent and oxygen inhalation (Perfused Oxy-E), i.e. suggestive of normoxia.
DOI: https://doi.org/10.58530/2022/0290