0289
Imaging hypoxia in murine oral cavity squamous cell carcinomas with oxygen-enhanced MRI1Division of Radiotherapy and Imaging, The Institute of Cancer Research, Sutton, United Kingdom
Synopsis
Oxygen-enhanced (OE)-MRI was used to map and quantify hypoxia (pOxyR) in two murine models of oral cavity squamous cell carcinoma, a tumour type in which hypoxia adversely affects patient prognosis. OE-MRI relies on quantifying changes in the longitudinal MRI relaxation rate R1 induced by excess paramagnetic oxygen molecules dissolved in blood plasma and interstitial fluid with inhalation of oxygen. When combined with susceptibility-contrast MRI for determination of fractional blood volume and diffusion-weighted MRI to assess cellularity, OE-MRI enables an assessment of the spatial distribution and extent of tumour hypoxia, patent vasculature and necrosis.
Introduction
Oral cavity squamous cell carcinoma (OSCC) represents a prominent subset of head and neck (H&N) cancers, amongst the most common and aggressive cancers worldwide. Despite advances in detection, and standard therapeutic approaches incorporating radiotherapy, surgery and chemotherapy, the prognosis for OSCC remains poor due to a high rate of locoregional recurrence and development of distant metastases1,2.An important negative prognostic factor in H&N cancer is hypoxia3, which is associated with resistance to radiotherapy4,5 and chemotherapy6, and mediates metastasis. Oxygen-enhanced (OE)-MRI is being exploited for the rapid quantification of the degree and spatial distribution of tumour hypoxia. When combined with an MRI biomarker of perfusion, perfused tumour sub-volumes refractory to hyperoxia-induced changes in R1, termed ‘perfused Oxy-R’ (pOxyR), were shown to be hypoxic7. In this study we have evaluated OE-MRI to assess the hypoxic signature arising in vivo in two syngeneic murine oral cancer (MOC) models8.
Methods
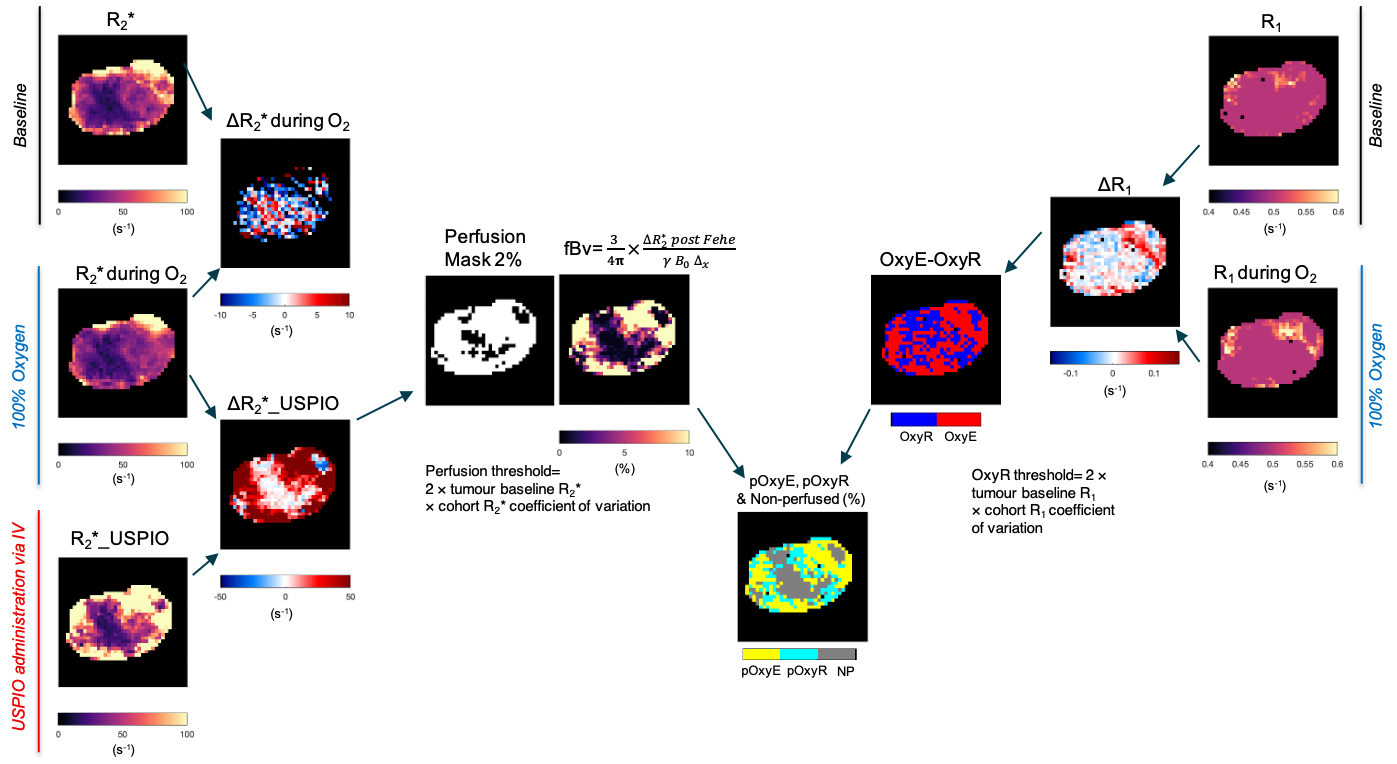
MOC1 and MOC2 OSCC tumours were propagated subcutaneously in the flanks of female C57BL/6J mice (n=11/model). Tumours were imaged ~50 and 20 days post implantation, respectively, at a volume ~350mm3. Pimonidazole (60mg/kg i.p.) was administered 45 minutes prior to imaging on a Bruker 7T horizontal bore MRI system.Prior to OE-MRI, multi-slice T2-weighted MRI (TR/TE=4.5s/36ms) and diffusion-weighted (DW)-MRI images for mapping the apparent diffusion coefficient (ADC) were acquired (5 b-values: 200-1000s/mm2). T1 (IR-TrueFISP, TR/TE=3.4/1.7ms, 50 TIs: 72.1-2738ms) and R2* (MGE, 8 echoes, TR/TEs=200/3-24ms) were quantified from a central 1mm transverse tumour slice under air and subsequently 100% oxygen-breathing. This was followed by intravenous administration of USPIO particles (ferumoxytol, 150μmol Fe/kg) and acquisition of a final set of MGE images. The USPIO-induced ΔR2* was used for determination of fractional blood volume (fBV), and to provide a perfusion mask. Parametric ADC, R1 (1/T1), R2* and fBV maps were calculated voxel-wise for tumour ROIs using in-house software (ImageView running in IDL and Matlab R2020b). The schematic diagram demonstrating the workflow of parametric map generation is presented in Figure 1. Significant differences in the MR parameters were identified between the two models using Student’s t-test, assuming a significance level of 5%. Following MRI, the perfusion marker Hoechst 33342 (15mg/kg i.v.) was administered for 1 minute and tumours were rapidly excised and bisected at the imaging plane and snap frozen. Whole tumour frozen sections aligned with imaging plane were processed for the detection of pimonidazole adduct formation and Hoechst 33342 uptake, and subsequently stained with haematoxylin & eosin (H&E).
Results
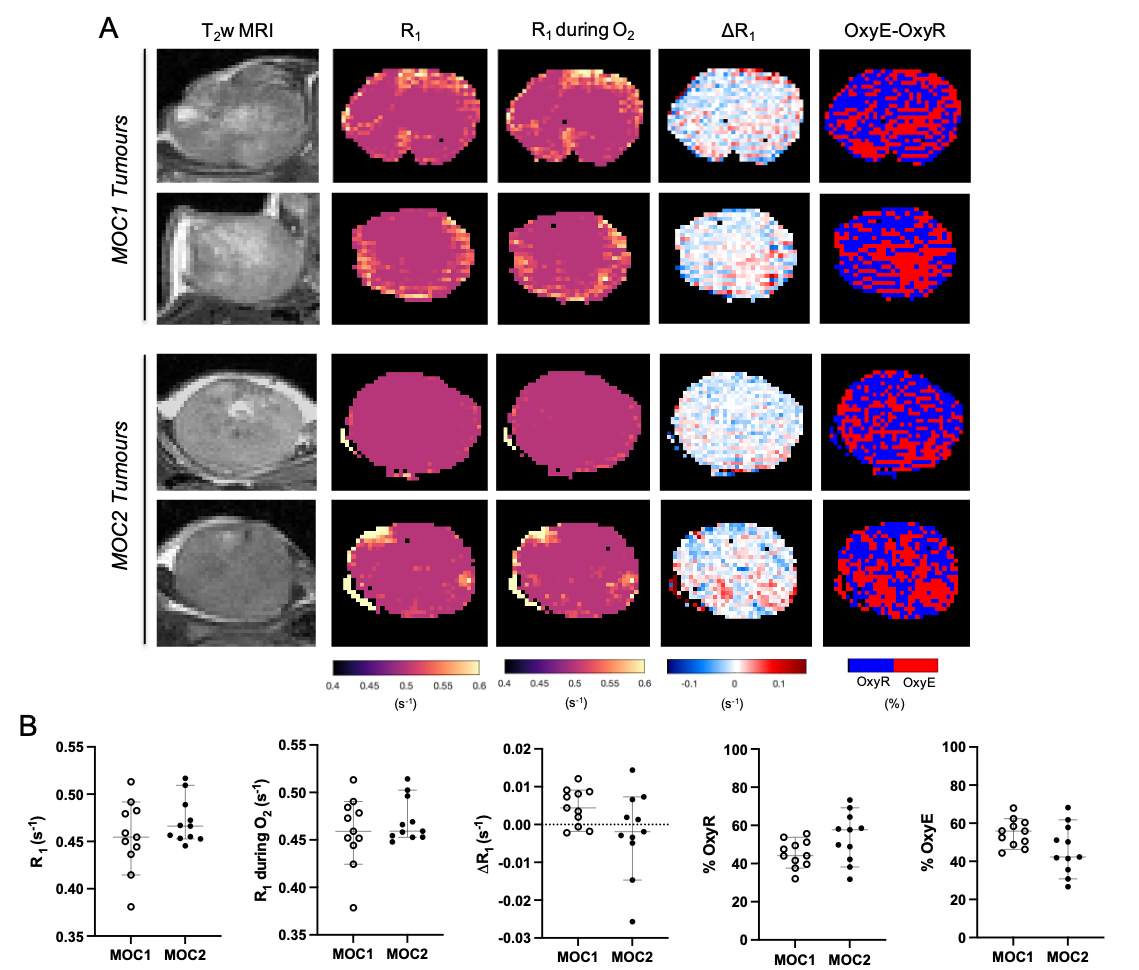
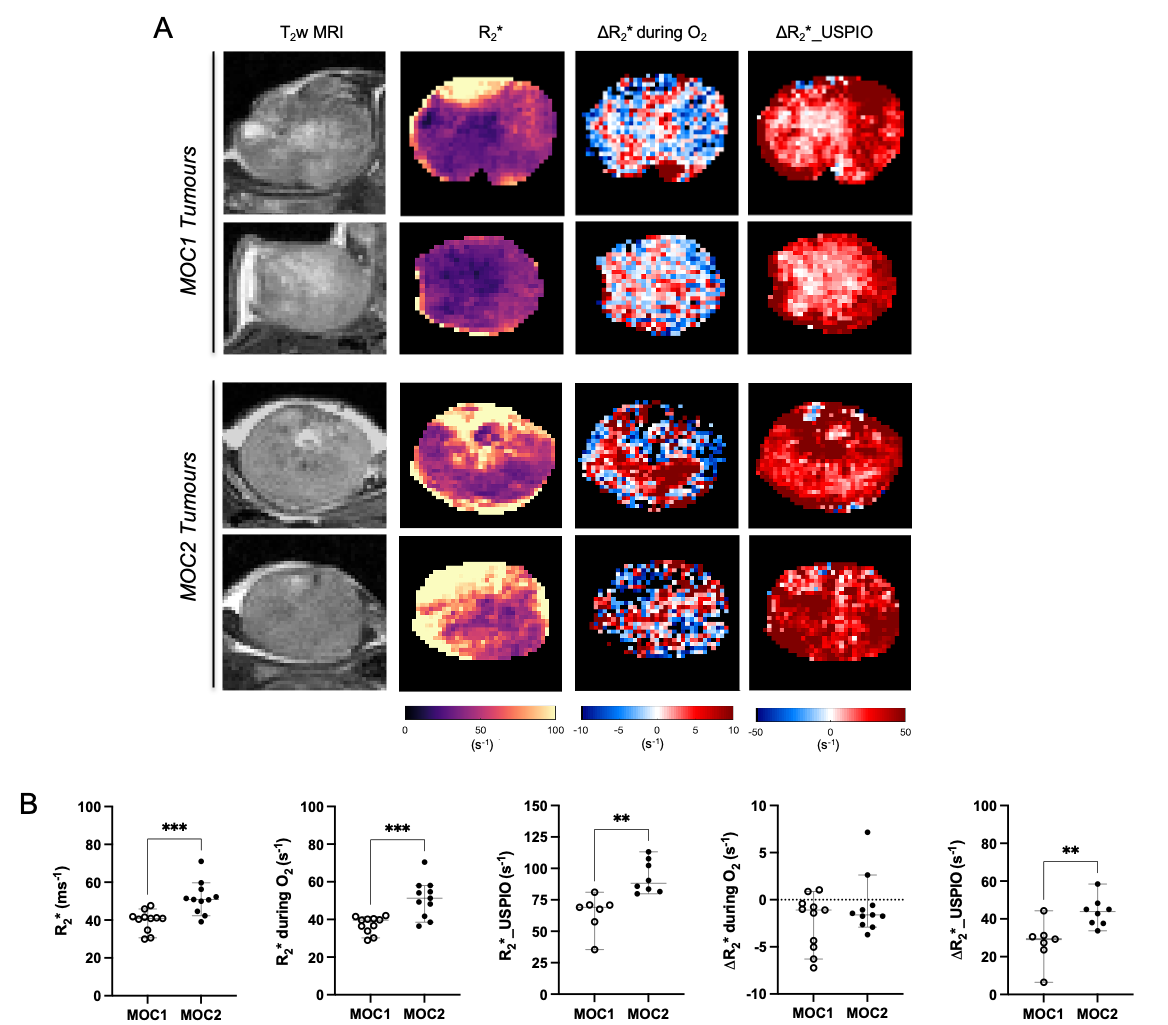
Baseline R1 distribution was more heterogeneous in MOC1 tumours than MOC2 tumours, but a heterogeneous distribution of OxyE and OxyR voxels was apparent across both tumour models (Figure 2A). No statistically significant differences were found in median baseline R1, ΔR1, OxyE and OxyR between the MOC1 and MOC2 cohorts (Figure 2B).Baseline R2* maps exhibited faster values in the MOC2 tumours compared to MOC1, and the median values confirmed a significant difference (Figure 3). Both hyperoxia-induced and USPIO-induced ΔR2* maps identified haemodynamically perfused tumour areas and suggest distinct differences in patent vasculature between the MOC1 and MOC2 tumours (Figure 3A). Median USPIO-induced ΔR2* was significantly greater in the MOC2 cohort (Figure 3B).
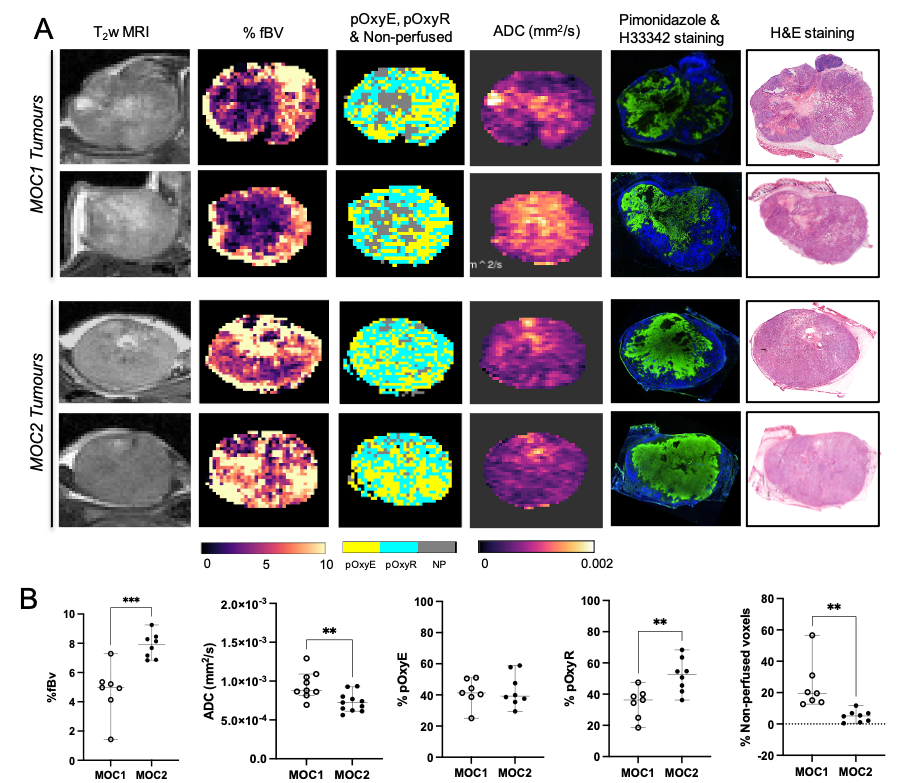
In the MOC1 tumours, fBV and Hoechst 33342 uptake were primarily associated with the tumour periphery, and a good spatial association of heterogeneously distributed pOxyR voxels and pimonidazole adducts was apparent (Figure 4A). Areas of non-perfused voxels were associated with elevated ADC and histologically-confirmed necrosis. In the MOC2 tumours, the extent and heterogeneous distribution of both fBV and pOxyR voxels was markedly higher. This was associated with extensive regions of pimonidazole adduct formation detected in viable tumour tissue with less necrosis. Significantly higher fBV and pOxyR, and lower ADC and non-perfused voxels, were identified in the MOC2 tumours compared to the MOC1 cohort (Figure 4B).
Discussion
A refined pre-clinical OE-MRI protocol was successfully implemented for the non-invasive assessment of hypoxia in two murine models of OSCC. When combined with susceptibility-contrast MRI for determination of fractional tumour blood volume and diffusion-weighted MRI to assess tissue cellularity, the OE-MRI protocol enables an assessment of the spatial distribution and extent of tumour hypoxia, patent vasculature and necrosis in the same imaging session.OE-MRI revealed extensive hypoxia in both the MOC1 and MOC2 tumour models, consistent with the expected phenotype for OSCC. The extent of pOxyR voxels was markedly higher than that previously reported in other subcutaneously propagated colorectal, renal and lung carcinoma xenografts7,9,10.
A noticeably different MRI-derived hypoxic signature was found between the MOC1 and MOC2 tumours. The higher number of pOxyR voxels and more abundant pimonidazole adduct formation in the more rapidly growing MOC2 tumours suggest that this model is relatively more hypoxic than the MOC1 tumours. On this basis, planned studies will test the hypothesis that pOxyR can provide a predictive imaging biomarker for the relative radioresistance of the MOC2 tumours compared to MOC1.
Conclusion
OE-MRI can identify and map the extensive and heterogeneous distribution of hypoxia in two murine models of OSCC, confirming the strong hypoxic phenotype anticipated in this tumour type. Different MRI-derived and histologically confirmed hypoxic signatures were identified between the two models.Acknowledgements
We acknowledge support from Cancer Research UK grant C16412/A27725, The Oracle Cancer Trust, and Children with Cancer UK.References
1. Kademani D. Oral cancer. Mayo Clin Proc 2007;82:878–87.
2. Rogers SN et al. Survival following primary surgery for oral cancer. Oral Oncol 2009; 45:201–11.
3. Sorensen BS & Horsman MR. Tumor hypoxia: impact on radiation therapy and molecular pathways. Front Oncol. 2020 Apr 21;10:562.
4. Brizel DM et al. Tumor hypoxia adversely affects the prognosis of carcinoma of the head and neck. Int. J. Radiat. Oncol. 38, 285–289 (1997).
5. Nordsmark M et al. Prognostic value of tumor oxygenation in 397 head and neck tumors after primary radiation therapy. An international multi-center study. Radiother. Oncol. 77, 18–24 (2005).
6. Shannon AM et al. Tumour hypoxia, chemotherapeutic resistance and hypoxia-related therapies. Cancer Treat. Rev. 29, 297–307 (2003).
7. O'Connor JPB et al. Oxygen-enhanced MRI accurately identifies, quantifies, and maps tumor hypoxia in preclinical cancer models. Cancer Res 2016;76:787-795.
8. Judd NP et al. ERK1/2 regulation of CD44 modulates oral cancer aggressiveness. Cancer Res. 2012 Jan 1;72(1):365-74.
9. Little RA et al. Mapping hypoxia in renal carcinoma with oxygen-enhanced MRI: comparison with intrinsic susceptibility MRI and pathology. Radiology, 288, 739-747, 2018.
10. Salem A et al. Oxygen-enhanced MRI is feasible, repeatable, and detects radiotherapy-induced change in hypoxia in xenograft models and in patients with non-small cell lung cancer. Clin Cancer Res. 2019 Jul 1;25(13):3818-3829.
Figures