0288
Differentiation of hepatocellular carcinoma from intrahepatic cholangiocarcinoma by mDIXON Quant and intravoxel incoherent motion imaging1The First Affiliated Hospital of Dalian Medical University, Dalian, China, 2Philips Healthcare, Beijing, China
Synopsis
Differentiation between hepatocellular carcinoma (HCC) and intrahepatic cholangiocarcinoma (ICC), the most common types of primary liver cancer, is important for the treatment planning and prognosis, but remains challenging via conventional radiological tools. Results by this study indicated that both mDIXON Quant and IVIM parameters showed significant different between HCC and ICC groups, and their combination can be of great potential value for clinical differential diagnosis between the two lesions.
Introduction
Primary liver cancer mainly includes hepatocellular carcinoma (HCC) and intrahepatic cholangiocarcinoma (ICC), which differ greatly in terms of pathogenesis, biological behavior, histological morphology, treatment and prognosis[1,2]. However, due to overlaps in typical imaging features, the differential diagnosis of HCC and ICC still remains challenging[3]. Recent progress in the water-fat separation techniques such as the mDIXON Quant[4] method enable quantification of fat fraction (FF) and R2* values for liver. Intravoxel incoherent motion (IVIM) imaging, based on diffusion-weighted imaging (DWI) with multiple b values, was reported capable of evaluation of both diffusion and micro-perfusion information in focal liver lesions[5]. The purpose of this study was to explore the value of mDIXON Quant and IVIM imaging in the differential diagnosis of HCC and ICC.Materials and Methods
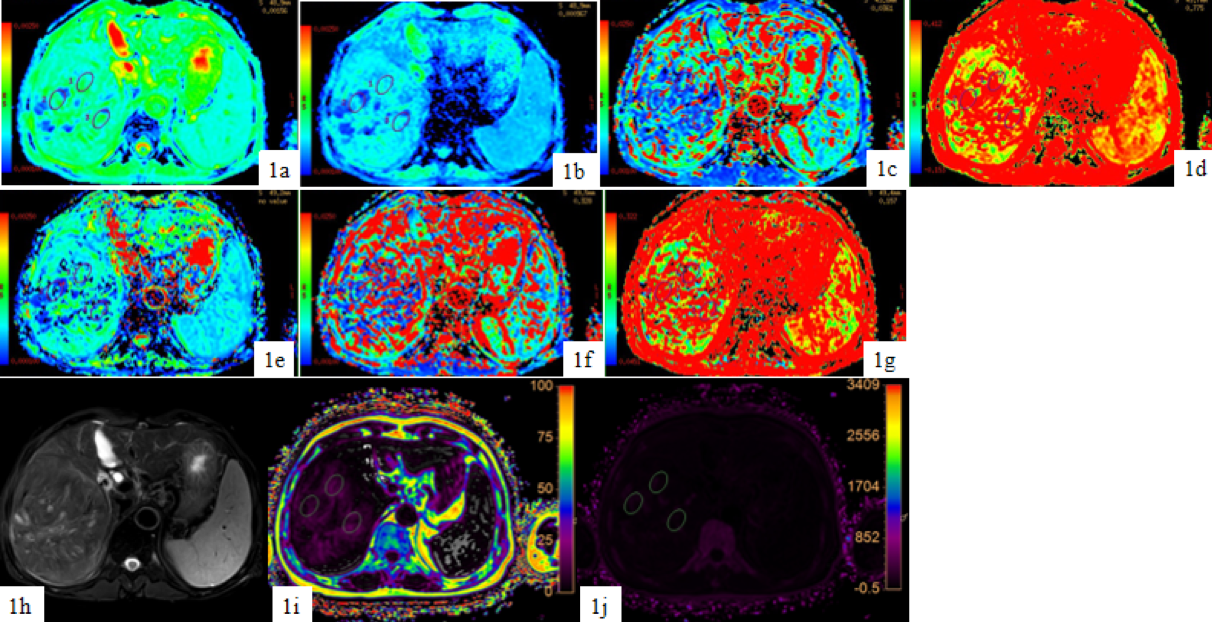
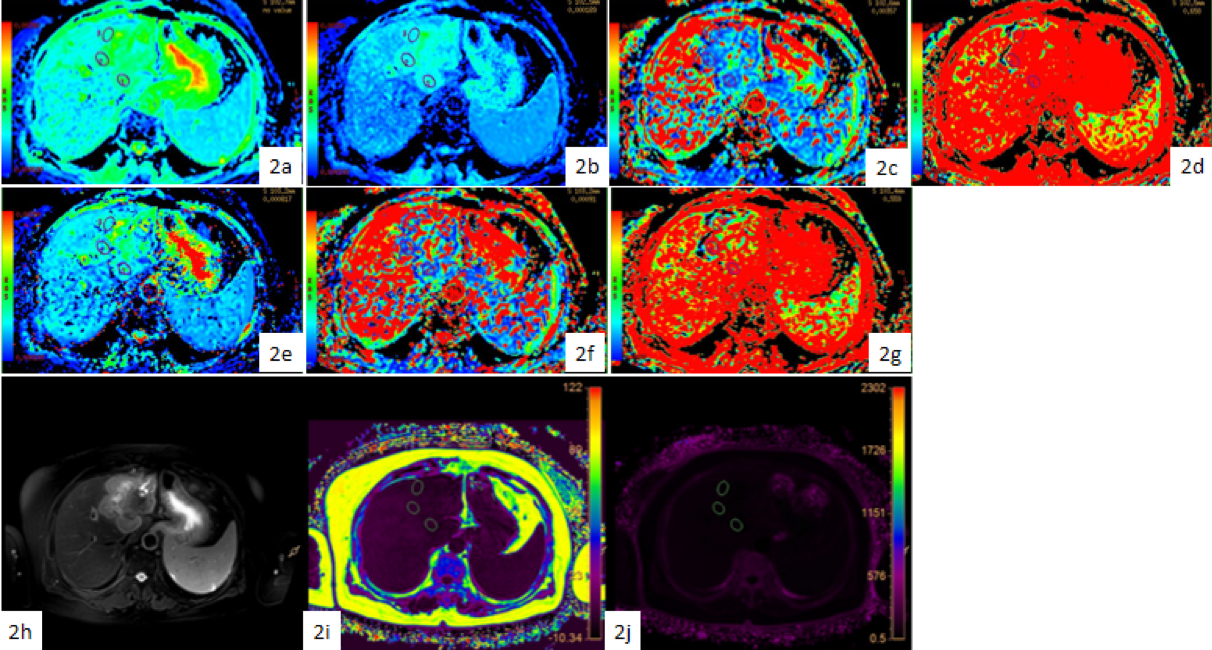
30 patients 20 HCC (19 males, mean age, 60 years; range, 44-76 years) and 10 ICC (6 males, mean age, 62 years; range, 48-72 years) (with clinical symptoms and MRI image characteristics of primary liver cancer) were recruited in this study who underwent 3T MRI scans (Ingenia CX, Philips Healthcare, Best, the Netherlands) including T1 weighted (T1WI), T2 weighted (T2WI), mDIXON Quant and IVIM imaging. The detail scan parameters were shown in Table 1. mDIXON Quant images with fat fraction (FF) and R2* maps were automatically generated in real-time on the MR console and then transferred to a post-processing workstation (Intelli Space Portal; Philips Healthcare) for further measurements. For IVIM scans, the resulting images were transferred to the GE AW 4.6 workstation where the IVIM parameter maps were generated using Functool software. ROIs (each 100-200 mm2) were drawn by a radiologist (7 years abdominal radiology experience) on the T2WI images showing the largest area of lesion and were copied to the FF map, R2* map, and IVIM parameter maps (Figure 1, Figure 2). Mean values of the ROI measurements were compared between the two groups using Mann-Whitney U test. ROC curve was used to analyze the significantly different parameters for the diagnostic efficiency between HCC and ICC, and logistic regression was used to calculate the value of combinational use of mDIXON Quant and IVIM parameters (with those significantly different parameters) in the differential diagnosis of HCC and ICC. The difference between AUCs was compared using Delong test. A p-value < 0.05 was considered statistically significant.Results
The measured value of mDIXON Quant and IVIM maps were shown in Table 2 for both HCC and ICC cohorts. The FF, fast ADC_Mono, fraction of fast ADC_ Mono and fast ADC_Bi values were significantly different in HCC and ICC. The ROC analyses revealed the diagnostic performance of FF, fast ADC_Mono, fraction of fast ADC_ Mono and fast ADC_Bi in differentiating HCC from ICC with AUCs of 0.803, 0.889, 0.744 and 0.811, respectively (Table 3). The AUC of FF, IVIM (fast ADC_Mono & fraction of fast ADC_Mono & fast ADC_Bi), and combination (FF & fast ADC_Mono & fraction of fast ADC_Mono & fast ADC_Bi) were 0.803, 0.889 and 0.944, respectively. When mDIXON Quant was combined with IVIM, the AUC was significantly improved to 0.944 when compared to mDIXON Quant was used alone, with a sensitivity of 94.4% and a specificity of 90.0% (Table 4).Discussion and Conclusion
Our study revealed that HCC had significantly higher FF values than ICC, implying more fat content in HCC. The R2* value was also significantly higher in HCC than ICC, which might because HCC cells proliferated faster and induced more neovascularization. IVIM alone also provided a fairly good biomarker to differentiate HCC from ICC, which may indicate the different diffusion and micro-perfusion properties in the two kinds of lesions. When mDIXON Quant was combined with IVIM, the AUC was significant improved from 0.803 (mDIXON Quant) and 0.889 (IVIM) to 0.944. In conclusion, mDIXON quant combined with IVIM has clinical potential in the differential diagnosis between HCC and ICC.Acknowledgements
No acknowledgement found.References
[1] Ponnoprat D, Inkeaw P, Chaijaruwanich J et al. Classification of hepatocellular carcinoma and intrahepatic cholangiocarcinoma based on multi-phase CT scans.Med Biol Eng Comput, 2020, 10;58: 2497-2515.
[2] Tomimatsu M, Ishiguro N, Taniai M et al. Hepatitis c virus antibody in patients with primary liver cancer (hepatocellular carcinoma, cholangiocarcinoma, and combined hepatocellularcholangiocarcinoma) in Japan. Cancer, 1993, 8;72:683–688.
[3] Rimola J, Forner A, Reig M et al. Cholangiocarcinoma in cirrhosis: absence of contrast washout in delayed phases by magnetic resonance imaging avoids misdiagnosis of hepatocellular carcinoma. 2009, 9;50:791–798.
[4] Pacicco T, Ratner S, Xi Y et al. Pelvic muscle size and myosteatosis: Relationship with age, gender, and obesity.Indian J Radiol Imaging, 2019, 29: 155-162.
[5] Klauss M, Mayer P, Maier-Hein K et al. IVIM-diffusion-MRI for the differentiation of solid benign and malign hypervascular liver lesions-Evaluation with two different MR scanners. Eur J Radiol, 2016, 7;85: 1289-94.
Figures
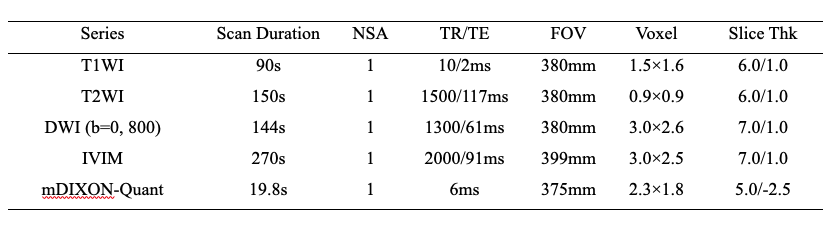
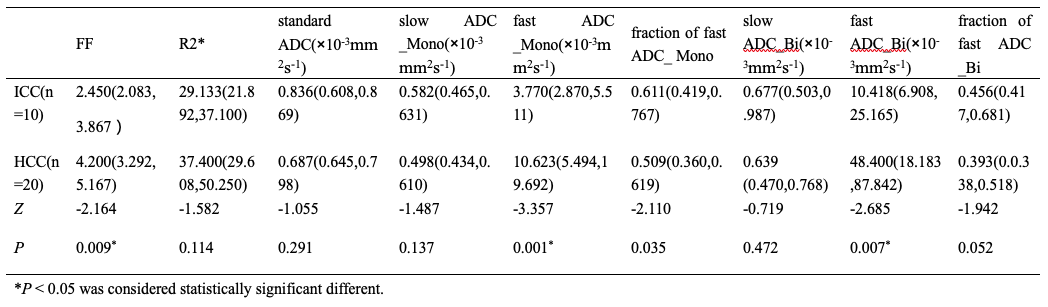
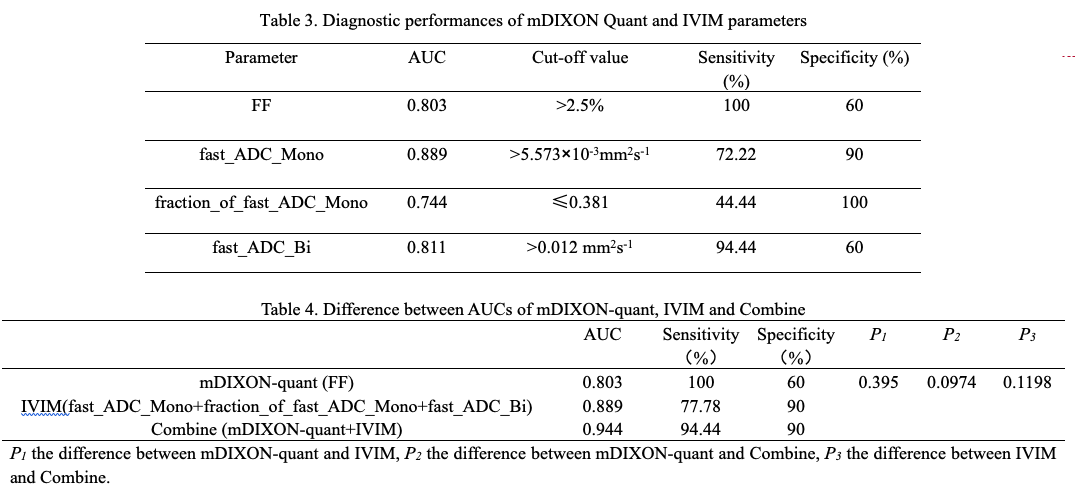
Table 3. Diagnostic performances of mDIXON Quant and IVIM parameters
Table 4. Differences between AUCs of mDIXON-quant, IVIM and their combination