0287
Glucose versus fructose metabolism in the liver measured with deuterium metabolic imaging1Department of Radiology, University Medical Center Utrecht, Utrecht, Netherlands, 2Department of Medical Imaging (Radiology), Radboud University Medical Center, Nijmegen, Netherlands, 3WaveTronica B.V., Utrecht, Netherlands
Synopsis
The worldwide increase in sugar consumption is a major health concern. The contribution of fructose to the epidemic of metabolic disorders is controversial. This study investigated differences between glucose and fructose metabolism in the liver using dynamic deuterium metabolic imaging (DMI). Deuterium signal time curves after bolus injection and slow infusion were successfully acquired and showed different patterns. It was found that the peak concentration and conversion of deuterated glucose was different from that of fructose, indicating faster turnover of the latter. Overall, these methods could potentially lead to better understanding of healthy liver metabolism and aberrations in metabolic diseases.
Introduction
The increase in sugar consumption over the last decades is a major health concern and it is considered to be a contributor to the worldwide epidemics of obesity and diabetes [1-5]. Fructose is found in fruits, sucrose (table sugar), and in high-fructose corn syrup-sweetened beverages and energy drinks. The role of fructose in metabolic disorders is, however, controversial. Metabolism of fructose is different from glucose. While 15-30% of an oral glucose load is taken up by the liver, an oral fructose load is almost completely (>70%) extracted by the liver [1,2]. High fructose diets stimulate de novo lipogenesis in the liver, and animal studies link high fructose consumption to hepatic steatosis, hypertension, obesity, insulin resistance and diabetes [1-4]. However, for moderate fructose consumption, there is no solid evidence of its deleterious effects [2].Deuterium metabolic imaging (DMI) is an emerging technique to measure metabolism in vivo. After administration of deuterium labelled glucose ([6,6’-2H2]-glucose), DMI can be used to distinguish tumour tissue from healthy tissue [6-8] and to measure glucose uptake and metabolism in the liver [8-10].
In this study, we aim to measure differences in the uptake and metabolism of glucose and fructose in the mouse liver using dynamic DMI.
Methods
In total, 8 mice (C57BL/6J female, 20±2 g, 9 weeks) were examined with a Buker BioSpec 11.7T small animal MRI system. Ethical approval of the Central Animal Experiments Committee was obtained for the study. During the measurements the animals received anaesthesia by inhalation of a 1-3% isoflurane gas mixture. The MR system was equipped with a standard Bruker 1H transmit-receive birdcage coil (500MHz) for anatomical imaging, and a custom-built 2H transmit-receive surface coil (76.8MHz) for DMI.Four mice received deuterated glucose ([6,6’-2H2]-glucose), and four mice deuterated fructose ([6,6’-2H2]-fructose) at 1.3 g of deuterated substrate per kg bodyweight (typically 26 mg for a 20 g mouse). The glucose/fructose load was administered via intravenous (IV) tail vein bolus injection (2 mice: 1 glucose, 1 fructose) or slow intravenous tail vein infusion over 30 minutes (6 mice: 3 glucose, 3 fructose).
The MRI scan protocol consisted of 1H anatomical imaging, B0 shimming and a natural abundance DMI scan for reference. After the start of the infusion, a time series of dynamic 3D DMI scans was performed with a total duration of either 60 minutes (bolus injection) or 90 minutes (slow infusion). DMI scan parameters: 3D 2H MRSI, 3.7x3.7x3.7mm3 voxels, 33x33x33mm3 FOV, TR=250ms, acquisition delay=0.4ms, 5000Hz spectral bandwidth, 2 averages and a scan duration of 3:00min.
Processing of the 3D DMI datasets was done with DMIWizard v1.1 [8], including zero filling and 2Hz Lorentzian apodization. A single voxel from the 3D DMI dataset was selected in the liver. Fitting was performed using the AMARES function of jMRUI. Tissue concentrations (mM) were calculated with reference to the first natural abundance baseline water signal integral, which was set to 13.7 mM.
Results
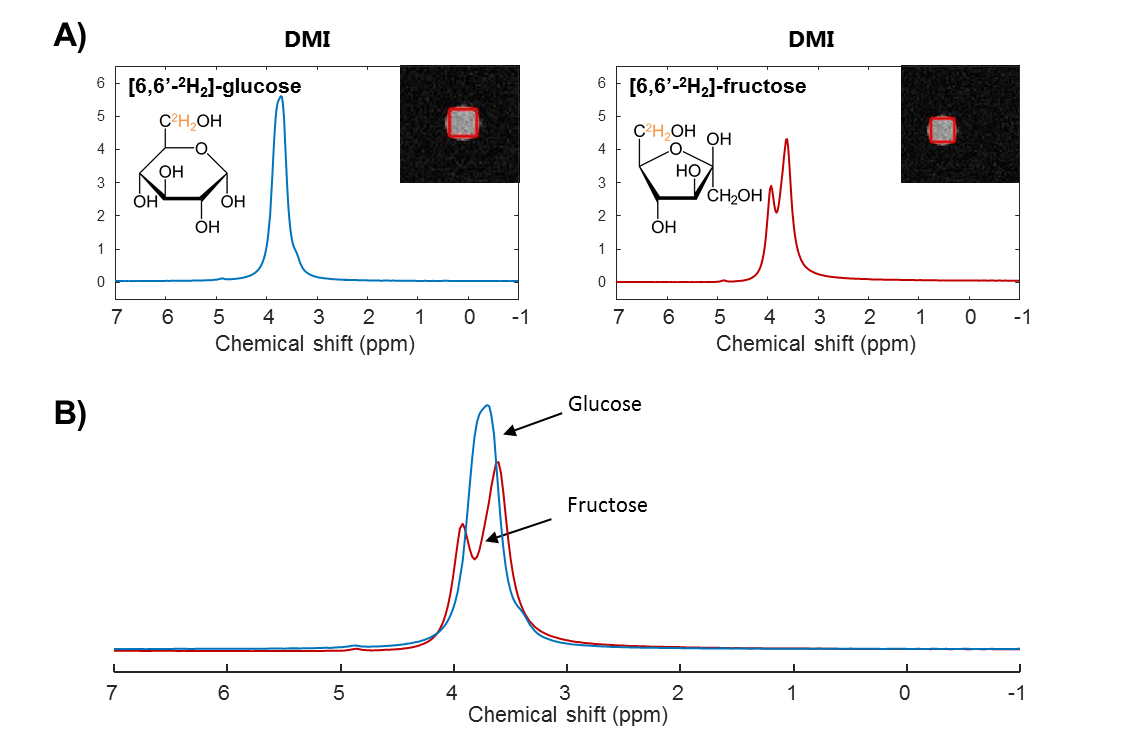
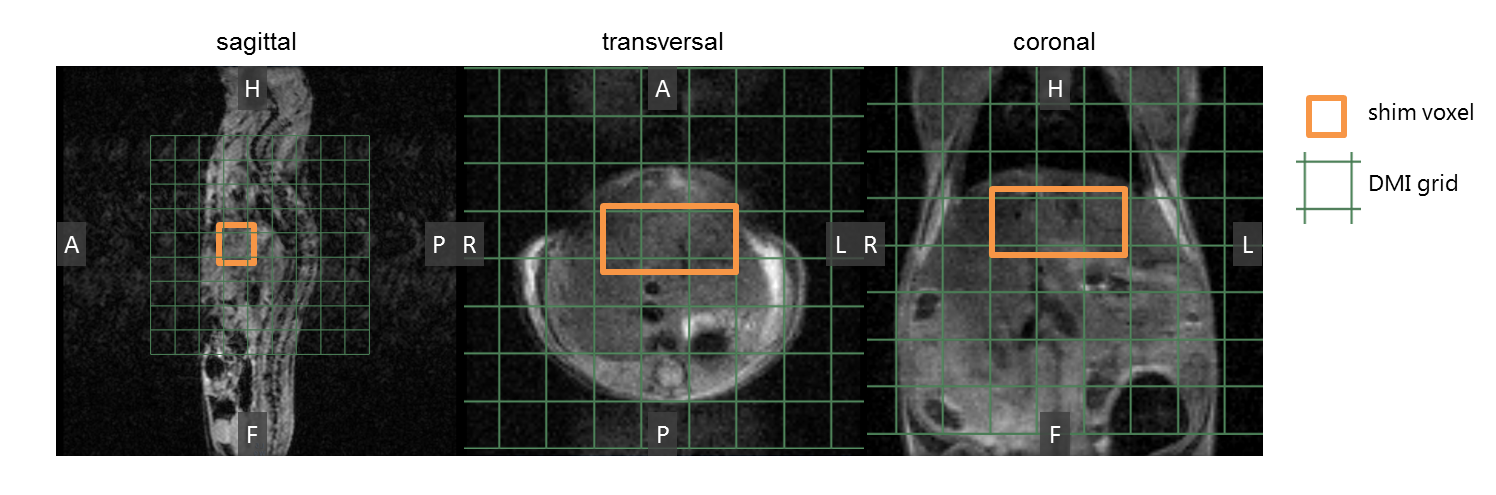
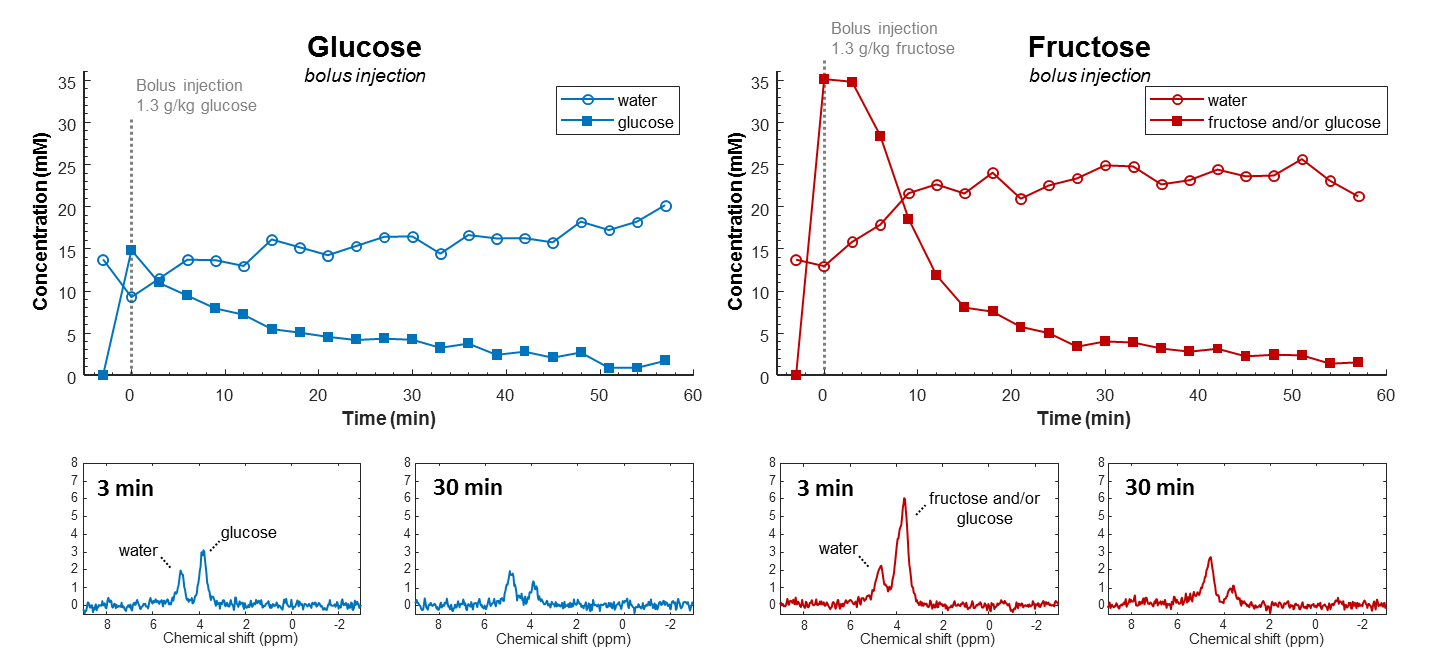
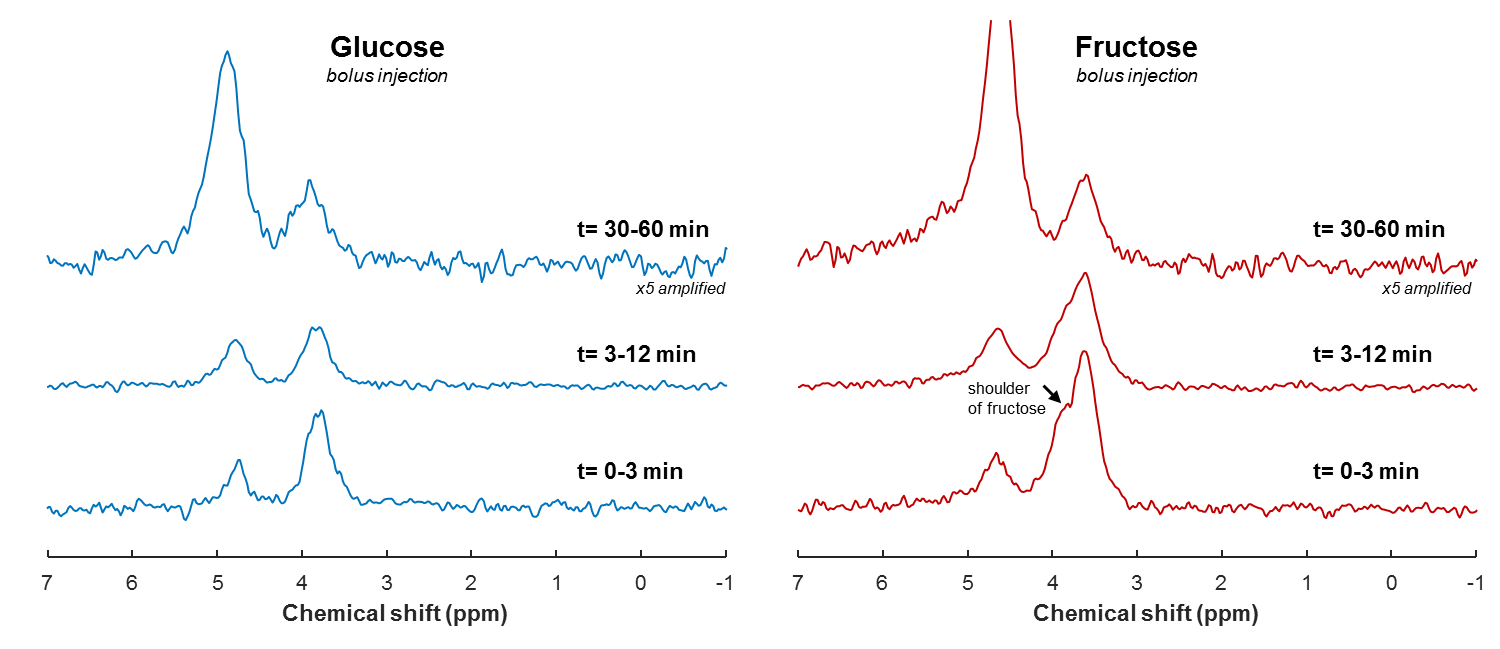
Phantom DMI scans of deuterated glucose and fructose solutions showed a clear peak at 3.8 ppm (Figure 1). The glucose and fructose peaks overlapped, but the fructose signal showed a splitting. In vivo anatomical scans were acquired for B0 shimming and DMI grid placement (Figure 2).In vivo DMI scans after bolus injection of deuterated glucose or fructose (Figure 3), showed that the initial 3.8 ppm signal level was much larger for fructose (35mM) as compared to glucose (15mM), while the amount of injected substrate was the same. The initial decay of the 3.8 ppm signal, and the rise of the water signal, was faster for fructose than for glucose injection. After about 20 min, the signal decay was similar for glucose and fructose. The spectra after fructose injection (Figure 4), showed a shoulder of the 3.8 ppm signal during the first few minutes (0-3 min), but no longer during the later time points (30-60 min).
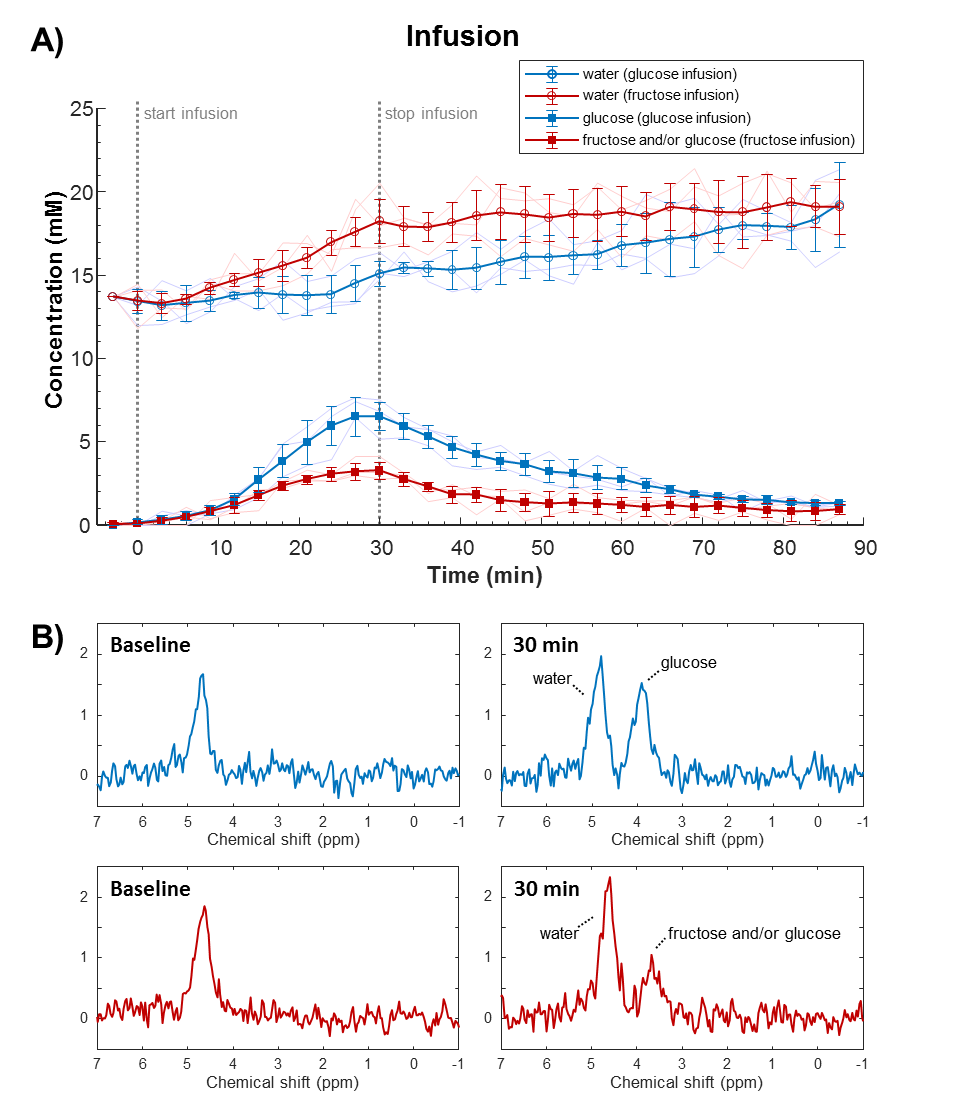
With the slow infusion protocol (Figure 5), a gradual increase in the 3.8 ppm signal was observed during glucose infusion, and a slow decrease after the infusion period. During fructose infusion, the maximum 3.8 ppm signal was much lower compared to glucose, whereas the deuterated water concentration increased more rapidly.
Discussion and conclusion
In this study, a much higher deuterated fructose signal in the liver was observed after an IV bolus injection compared to that of glucose. This is in line with literature describing that fructose uptake mainly occurs in the (first passage through the) liver, whereas glucose is also consumed by other tissues [1,2]. A high turnover of fructose could explain the faster decay of its signal in the bolus measurement, the lower signal maximum in the slow infusion measurement, and the faster increases in deuterated water concentration with both protocols. Moreover, from the peak shape analysis, the signal at 3.8 ppm seems to originate mainly from glucose 30 min after bolus injection of deuterated fructose, supporting the rapid conversion of fructose to glucose.Overall, this study shows that differences in hepatic uptake and metabolism of glucose and fructose can be measured with DMI. In the long-term, these methods could potentially contribute to better understanding of human metabolism, also in case of metabolic diseases like diabetes and non-alcoholic fatty liver disease.
Acknowledgements
This work was supported by the Netherlands Organisation for Health Research and Development (ZonMw) via the Enabling Technologies Hotels programme, grant number: 435005014, and the Dutch Research Council (NWO), grant number: HTSM17134, BodyDMI (Prompers).References
[1] Hannou SA, Haslam DE, McKeown NM, Herman MA. Fructose metabolism and metabolic disease. J Clin Invest. 2018 Feb 1;128(2):545-555. doi: 10.1172/JCI96702. Epub 2018 Feb 1.
[2] Tappy L, Lê KA. Does fructose consumption contribute to non-alcoholic fatty liver disease? Clin Res Hepatol Gastroenterol. 2012 Dec;36(6):554-60. doi: 10.1016/j.clinre.2012.06.005. Epub 2012 Jul 12.
[3] Rizkalla SW. Health implications of fructose consumption: A review of recent data. Nutr Metab (Lond). 2010 Nov 4;7:82. doi: 10.1186/1743-7075-7-82.
[4] Tappy L. Fructose-containing caloric sweeteners as a cause of obesity and metabolic disorders. J Exp Biol. 2018 Mar 7;221(Pt Suppl 1):jeb164202. doi: 10.1242/jeb.164202.
[5] Bray GA, Nielsen SJ, Popkin BM. Consumption of high-fructose corn syrup in beverages may play a role in the epidemic of obesity. Am J Clin Nutr. 2004 Apr;79(4):537-43. doi: 10.1093/ajcn/79.4.537. Erratum in: Am J Clin Nutr. 2004 Oct;80(4):1090.
[6] Kreis F, Wright AJ, Hesse F, Fala M, Hu DE, Brindle KM. Measuring Tumor Glycolytic Flux in Vivo by Using Fast Deuterium MRI. Radiology. 2020 Feb;294(2):289-296. doi: 10.1148/radiol.2019191242. Epub 2019 Dec 10.
[7] Veltien A, van Asten J, Ravichandran N, de Graaf RA, De Feyter HM, Oosterwijk E, Heerschap A. Simultaneous Recording of the Uptake and Conversion of Glucose and Choline in Tumors by Deuterium Metabolic Imaging. Cancers (Basel). 2021 Aug 10;13(16):4034. doi: 10.3390/cancers13164034.
[8] De Feyter HM, Behar KL, Corbin ZA, Fulbright RK, Brown PB, McIntyre S, Nixon TW, Rothman DL, de Graaf RA. Deuterium metabolic imaging (DMI) for MRI-based 3D mapping of metabolism in vivo. Sci Adv. 2018 Aug 22;4(8):eaat7314. doi: 10.1126/sciadv.aat7314.
[9] Gursan A, Hendriks AD, Welting D, Klomp DWJ, Prompers JJ. Monitoring liver glucose uptake and metabolism with dynamic 3D deuterium metabolic imaging at 7T. Proceedings of the Annual Meeting of the ISMRM 2021, p.1784
[10] De Feyter HM, Thomas MA, Behar KL, de Graaf RA. NMR visibility of deuterium-labeled liver glycogen in vivo. Magn Reson Med. 2021 Jul;86(1):62-68. doi: 10.1002/mrm.28717. Epub 2021 Feb 15.
Figures