0286
Fusion of T2/FLAIR Hyperintensities with Chemical Shift Imaging in Glioma Patients1Radiology, Brigham and Women's Hospital, Boston, MA, United States, 2Chemical & Biological Physics, Weizmann Institute of Science, Rehovot, Israel
Synopsis
This work fuses manual segmentation of T2/FLAIR hyperintensity regions using 3D Slicer with multivoxel magnetic resonance spectroscopy (MRSI), which profiles neurochemical concentrations in a wide area of the brain. The utility of MRSI is demonstrated in the mapping of metabolites including 2HG, N-acetyl aspartate, myoinositol, glutamate plus glutamine, lactate, and choline in the region of interest. Voxel fractions of hyperintensity were correlated to metabolites, and metabolite-to-creatine ratio intercepts were used to compare hyperintense with healthy tissue.
Introduction
Proton magnetic resonance spectroscopy (MRS) is a technique used to non-invasively profile tissue metabolite concentrations in-vivo. It is used to complement MR imaging in helping provide diagnosis and monitoring of brain tumors. MRS has been used to detect the neurochemical signature of brain tumors including elevated choline, a membrane turnover marker; myoinositol, a glial cell marker; glutamate and glutamine, an excitatory neurotransmitter; lactate, found in high-grade brain tumors; and decreased N-acetylaspartate, a neuron density marker1. MRS has also been used to identify low-grade gliomas with IDH-1 mutation through detecting the oncometabolite 2-hydroxyglutarate2. Single-voxel spectroscopy is often used clinically but suffers from partial volume effects. This work uses chemical shift imaging (CSI) which provides additional spatial resolution such that signal comprised of purely lesion tissue can be obtained. The CSI results can then be combined with image segmentation to specify areas with T2/FLAIR hyperintensity, which can be attributable to tumor. Partial fractions of hyperintensity are then calculated and correlated with metabolite concentrations through linear regression. The metabolite concentrations in MRSI voxels within T2/FLAIR hyperintense areas are then compared with those in healthy tissue in the contralateral brain region. Previously, this methodology was applied to visualize grey and white matter contributions to metabolites3. In this work, we applied it to gliomas where there is greater importance in discerning the partial volume composition of lesion and healthy tissue in voxels.Methods
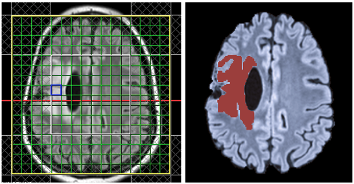
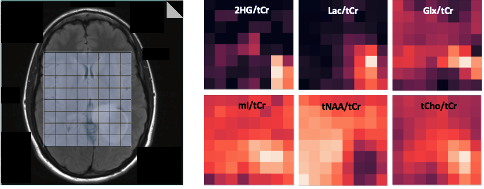
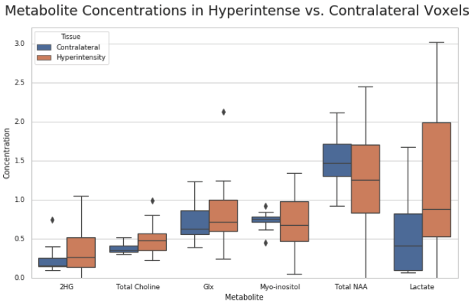
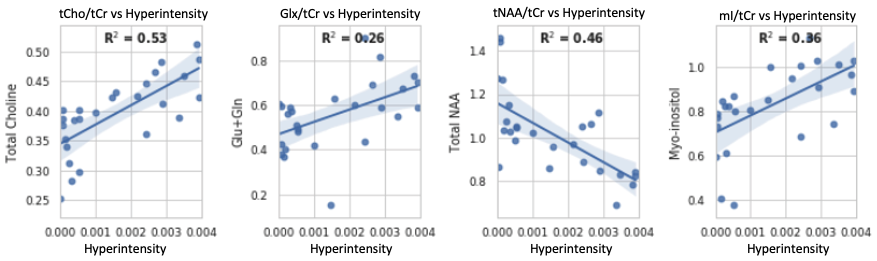
All MRS scans were performed on a 3T scanner (Siemens Skyra, Erlangen, Germany) with a 32-channel head coil array. The MRI protocol included a 3D T1 and T2-weighted sequence. CSI was acquired with semi-localized adiabatic selective refocusing spectroscopic imaging sequence using TE/TR=97/1700 ms, a 2D 16x16 voxel acquisition matrix with an 8x8 voxel region of interest, and a voxel volume of 10x10x15 mm3 (1.5 mL). MRSI scans were reconstructed using OpenMRS Lab4 and concentrations of total N-acetyl aspartate (tNAA), myoinositol (mI), total creatine (tCr), total choline (tCho), glutamate and glutamine (Glx), and 2-hydroxyglutarate (2HG) were quantified using LCModel5 in each voxel of the MRSI grid. The Segment Editor module in 3D Slicer6 was used to perform manual segmentation of hyperintense and contralateral regions in each brain volume as shown in Figure 1. Chemical shift imaging was performed in 16 patients, comprising a total of 563 data points (Hyperintensity, N=344; Contralateral, N=219). Data quality cleaning was performed, involving the removal of voxels with CRLB of equal to or higher than 50% in the metabolites of interest. Afterwards, 446 voxels in total remained (Hyperintensity, N=264; Contralateral, N=182). Visual Display Interface (VDI) software7 in MATLAB was then used to co-register the CSI and T2/FLAIR images and calculate the fractions of T2 hyperintense volume in each MRSI voxel, which were then correlated with metabolite-to-creatine ratios using linear regression as shown in Figure 4. Intercepts from linear regression at which voxels contained purely T2/FLAIR hyperintensity were displayed in boxplots along with mean metabolite-to-creatine ratios of contralateral voxels in each subject (Fig. 3). Finally, paired t-tests were performed between the two voxel classifications across all patients.Results and Discussion
Manual segmentation using 3D Slicer was able to precisely parcellate the T2/FLAIR hyperintense regions into binary masks to be overlaid with 2D MRSI volumes (Figure 1). Chemical shift imaging provided color maps showing spatial distribution of metabolites. Areas containing T2/FLAIR hyperintensity coincided with MRSI voxels where high concentrations of tCho/tCr, Lac/tCr, Glx/tCr, and mI/tCr, and low tNAA/tCr were detected (Figure 2). Boxplots also displayed ranges of metabolite-to-creatine ratios in hyperintense and contralateral regions. Paired t-tests were performed, showing significantly higher concentrations of Lac/tCr (p=0.029) and tCho/tCr (p=0.05) in hyperintense voxels. In addition, higher hyperintensity concentrations were observed in the boxplot from metabolites that did not have significant findings, which included mI/tCr (p=0.86), Glx/tCr (p=0.49), and 2HG (p=0.16). The hyperintense voxels had lower NAA/tCr concentrations compared to the contralateral but was not statistically significant (p=0.29) indicating that there was still partial volume of healthy tissue within the lesion. In addition, several healthy contralateral areas retained voxels with high lactate concentrations. One potential shortcoming of this work is that multiple patients contained bilateral T2/FLAIR hyperintensity areas which resulted in a smaller sample size of contralateral healthy voxels. Despite this factor, the value of CSI is demonstrated in detecting neurochemical differences in the two different voxel types that adds additional information to the T2/FLAIR imaging.Conclusion
This work combines the rich metabolite concentration dataset from chemical shift imaging with the spatial specificity of manual segmentation in glioma patients. The methodology provides a neurochemical comparison of different tissue types that has the potential to contribute to the volumetric information provided by T2/FLAIR images in brain cancer.Acknowledgements
No acknowledgement found.References
[1] Horská, A., & Barker, P. B. (2010). Imaging of brain tumors: MR spectroscopy and metabolic imaging. Neuroimaging clinics of North America, 20(3), 293–310. https://doi.org/10.1016/j.nic.2010.04.003
[2] Zhou, M., Zhou, Y., Liao, H., Rowland, B. C., Kong, X., Arvold, N. D., Reardon, D. A., Wen, P. Y., Lin, A. P., & Huang, R. Y. (2018). Diagnostic accuracy of 2-hydroxyglutarate magnetic resonance spectroscopy in newly diagnosed brain mass and suspected recurrent gliomas. Neuro-oncology, 20(9), 1262–1271. https://doi.org/10.1093/neuonc/noy022
[3] Zhao W, Coello E, Louis M, Breedlove K, Tal A, Lin A. Compression of Multivoxel Spectroscopic Data via Visualization of Grey and White Matter Contributions to Metabolite Concentrations. Proc. Intl. Soc. Mag. Reson. Med. 29:2238 (2021)
[4] Rowland, B., Sreepada, L., Jiang, S., & Lin, A. (2017). OpenMRSLab: An open-source software repository for Magnetic Resonance Spectroscopy data analysis tools. Paper presented at the European Society of Magnetic Resonance in Medicine and Biology, Barcelona, Spain.
[5] Provencher SW. Automatic quantitation of localized in vivo 1H spectra with LCModel. NMR Biomed. 2001 Jun;14(4):260-4. doi: 10.1002/nbm.698. PMID: 11410943.
[6] Fedorov A., Beichel R., Kalpathy-Cramer J., Finet J., Fillion-Robin J-C., Pujol S., Bauer C., Jennings D., Fennessy F., Sonka M., Buatti J., Aylward S.R., Miller J.V., Pieper S., Kikinis R. 3D Slicer as an Image Computing Platform for the Quantitative Imaging Network. Magnetic Resonance Imaging. 2012 Nov;30(9):1323-41. PMID: 22770690
[7] Tal, A (2020). Visual Display Interface (VDI) [Computer Software]. Retrieved from http://www.vdisoftware.net
Figures