0285
MRS-Detectable Metabolic Biomarkers of TERT positive Glioblastoma1Radiology and Biomedical Imaging, UCSF, San Francisco, CA, United States, 2Department of Neurological Surgery, UCSF, San Francisco, CA, United States
Synopsis
Telomerase reverse transcriptase (TERT) expression results from TERT promoter mutations and is a hallmark of cancer. GABPB1, its upstream transcriptional factor, was recently identified as a promising tumor-specific therapeutic target. However, imaging methods that can detect TERT expression and its inhibition with emerging GABPB1-based therapeutics are limited. Here, we demonstrate that the combination of 1H-MRS and hyperpolarized 13C-MRS of [1-13C]pyruvate allow detection of TERT modulation in TERT-expressing GBM cells and in vivo tumors. These findings could be translated to the clinic and thus improve the monitoring and personalized treatment of GBM.
INTRODUCTION
Re-expression of telomerase reverse transcriptase (TERT) is the most common mechanism through which cancers maintain their telomere length and achieve immortality. TERT promoter mutations are the most common mechanism by which TERT expression is restored, and over 80% of glioblastoma (GBM) harbor a TERT promoter mutation. TERT is therefore considered a potential therapeutic target. Recent findings demonstrate that GABPB1, which is an upstream transcriptional factor of TERT, is a promising target for TERT inhibition and glioma treatment 1,2. Conventional TERT detecting methods require invasive tumor tissue resection and are therefore of limited clinical relevance for longitudinal monitoring of response to treatment. In this context, noninvasive biomarkers of TERT expression are viewed as essential for monitoring response to TERT-targeted therapies. The goal of this study was to identify MRS-detectable metabolic biomarkers which are correlated with TERT expression in GBM and therefore provide a non-invasive means for monitoring TERT status.METHODS
Cell models: Investigations were performed in U251 cells in which TERT or GABPB1 were silenced via transduction with shRNA targeting TERT or GABPB1 respectively.1H-MRS of cell extracts: Cells were extracted using the dual-phase extraction method 3. 1H spectra were acquired using a 500 MHz Bruker Spectrometer. Spectra were processed and analyzed using MNOVA (Mestrelab Research). Metabolites were quantified by peak integration and normalized to an external reference and cell number. Multivariate analysis was performed using SIMCA software.
Hyperpolarized 13C-MRS in cells: 3-8x10⁷ cells were suspended in a 5 mm NMR tube. [1-13C]pyruvate solution was polarized using a Hypersense DNP polarizer and injected into the cells as previously 4. Spectra were acquired using a 500 MHz Agilent spectrometer using a 5 ° flip angle and 3 s TR over 300 s. Data were analyzed using MNOVA.
In vivo 1H-MRS: 5x10⁵ cells were injected intracranially in 6-8 week old male nu/nu rats. MR studies were performed using a 3 T pre-clinical Bruker MR scanner. 1H data was acquired from a 4x4x4 mm3 voxel using the PRESS sequence. LCModel was used to quantify the spectra.
In vivo hyperpolarized 13C-MRS: [1-13C]pyruvate solution was polarized using a Hypersense DNP polarizer and injected through the tail vein over 12 s as previously 4. Spectra were acquired using a spectral spatial echo-planar spectroscopic imaging (EPSI) 5 sequence and processed using a Matlab script.
RESULTS AND DISCUSSION
Lactate and GSH are the common significantly reduced metabolites following TERT silencing: Representative spectra comparing our cell lines illustrated a reduction in lactate and GSH in TERT-silenced (U251shTERT and U251shGABPB1) cells compared to controls (U251shCtrl) (Fig. 1A). The principal component analysis (PCA) score plots comparing U251shCtrl to U251shTERT, and U251shCtrl to U251shGABPB1, showed clear separation between the groups (Fig. 1B). The VIP predictive scores revealed that lactate and GSH were the common topmost important metabolites contributing to the separation between control and TERT or GABPB1-silenced cells (Fig. 1C). The significant drop in lactate and GSH levels in TERT or GABPB1 silenced cells was confirmed by univariate analysis (Fig. 1D). Finally, we found a strong correlation between TERT expression and lactate or GSH levels (Fig. 1E).TERT silencing leads to a drop in hyperpolarized [1-13C]pyruvate conversion to lactate in live cells: A representative spectral array of U251 cells following injection of hyperpolarized [1-13C]pyruvate shows the production of [1-13C]lactate at 183ppm (Fig. 2A). The sum spectrum, the temporal evolution, and quantification of the lactate-to-pyruvate ratio further illustrate the drop in hyperpolarized [1-13C]lactate production following siTERT treatment (Fig. 2B-D). The lactate-to-pyruvate ratio of U251shTERT or U251shGABPB1 was significantly lower than that of U251shCtrl (Fig. 2D).
In vivo 1H-MRS confirmed that lactate and GSH can be reliable biomarkers of TERT silencing in glioblastoma: Consistent with TERT silencing, U251shTERT and U251shGABPB1 tumors grew slower than U251shCtrl tumors (Fig. 3A). Representative spectra and T2-weighted images of U251shCtrl tumors are presented in Fig. 3B. LCModel quantification of the metabolites showed that both GSH and the composite lactate plus lipid signals were significantly lower in TERT-silenced tumors compared to controls (Fig. 3C and D).
In vivo 13C-MRS of hyperpolarized pyruvate metabolism demonstrated that hyperpolarized lactate can be a reliable biomarker of TERT expression and TERT silencing in glioblastoma: 13C-MRS spectra of hyperpolarized [1-13C]pyruvate show clearly detectable levels of [1-13C]lactate in each model (Fig. 4A). The temporal evolution of hyperpolarized [1-13C]lactate demonstrates that lactate production is lower in the TERT-silenced tumors compared to the U251shCtrl (Fig. 4B). Quantification of the dynamic lactate-to-pyruvate ratio (Fig. 4C and D) showed that the difference between tumor and contralateral brain, and tumor and normal brain was significant. [1-13C]lactate production in TERT-silenced tumors remained higher than the contralateral brain and normal brain. Nonetheless, we found that the difference in hyperpolarized lactate production between the TERT-expressing and TERT-silenced tumors was statistically significant, confirming the value of hyperpolarized lactate as a biomarker of TERT status.
Conclusion
Detection of lactate and GSH by 1H-MRS, and detection of hyperpolarized [1-13C]pyruvate metabolism by 13C MRS are readily translatable to the clinic, and thus could ultimately improve GBM patient management.Acknowledgements
This work was supported by NIH R01CA172845, NIH R01CA197254, NIH P01CA118816, UCSF LOGLIO collective, UCSF NICO project, NIH P30CA082103, NIH R01CA239288, NIH K00CA212470, and Department of Defense W81XWH201055315. The authors also acknowledge support from NIH P41EB013598.References
1. Bell RJ, Rube HT, Kreig A, et al. Cancer. The transcription factor GABP selectively binds and activates the mutant TERT promoter in cancer. Science. 2015; 348(6238):1036-1039.
2. Mancini A, Xavier-Magalhaes A, Woods WS, et al. Disruption of the beta1L Isoform of GABP Reverses Glioblastoma Replicative Immortality in a TERT Promoter Mutation-Dependent Manner. Cancer Cell. 2018; 34(3):513-528 e518.
3. Ronen SM, Jackson LE, Beloueche M, Leach MO. Magnetic resonance detects changes in phosphocholine associated with Ras activation and inhibition in NIH 3T3 cells. Br J Cancer. 2001; 84(5):691-696.
4. Chaumeil MM, Radoul M, Najac C, et al. Hyperpolarized (13)C MR imaging detects no lactate production in mutant IDH1 gliomas: Implications for diagnosis and response monitoring. Neuroimage Clin. 2016; 12:180-189.
5. Yen YF, Kohler SJ, Chen AP, et al. Imaging considerations for in vivo 13C metabolic mapping using hyperpolarized 13C-pyruvate. Magn Reson Med. 2009; 62(1):1-10.
Figures
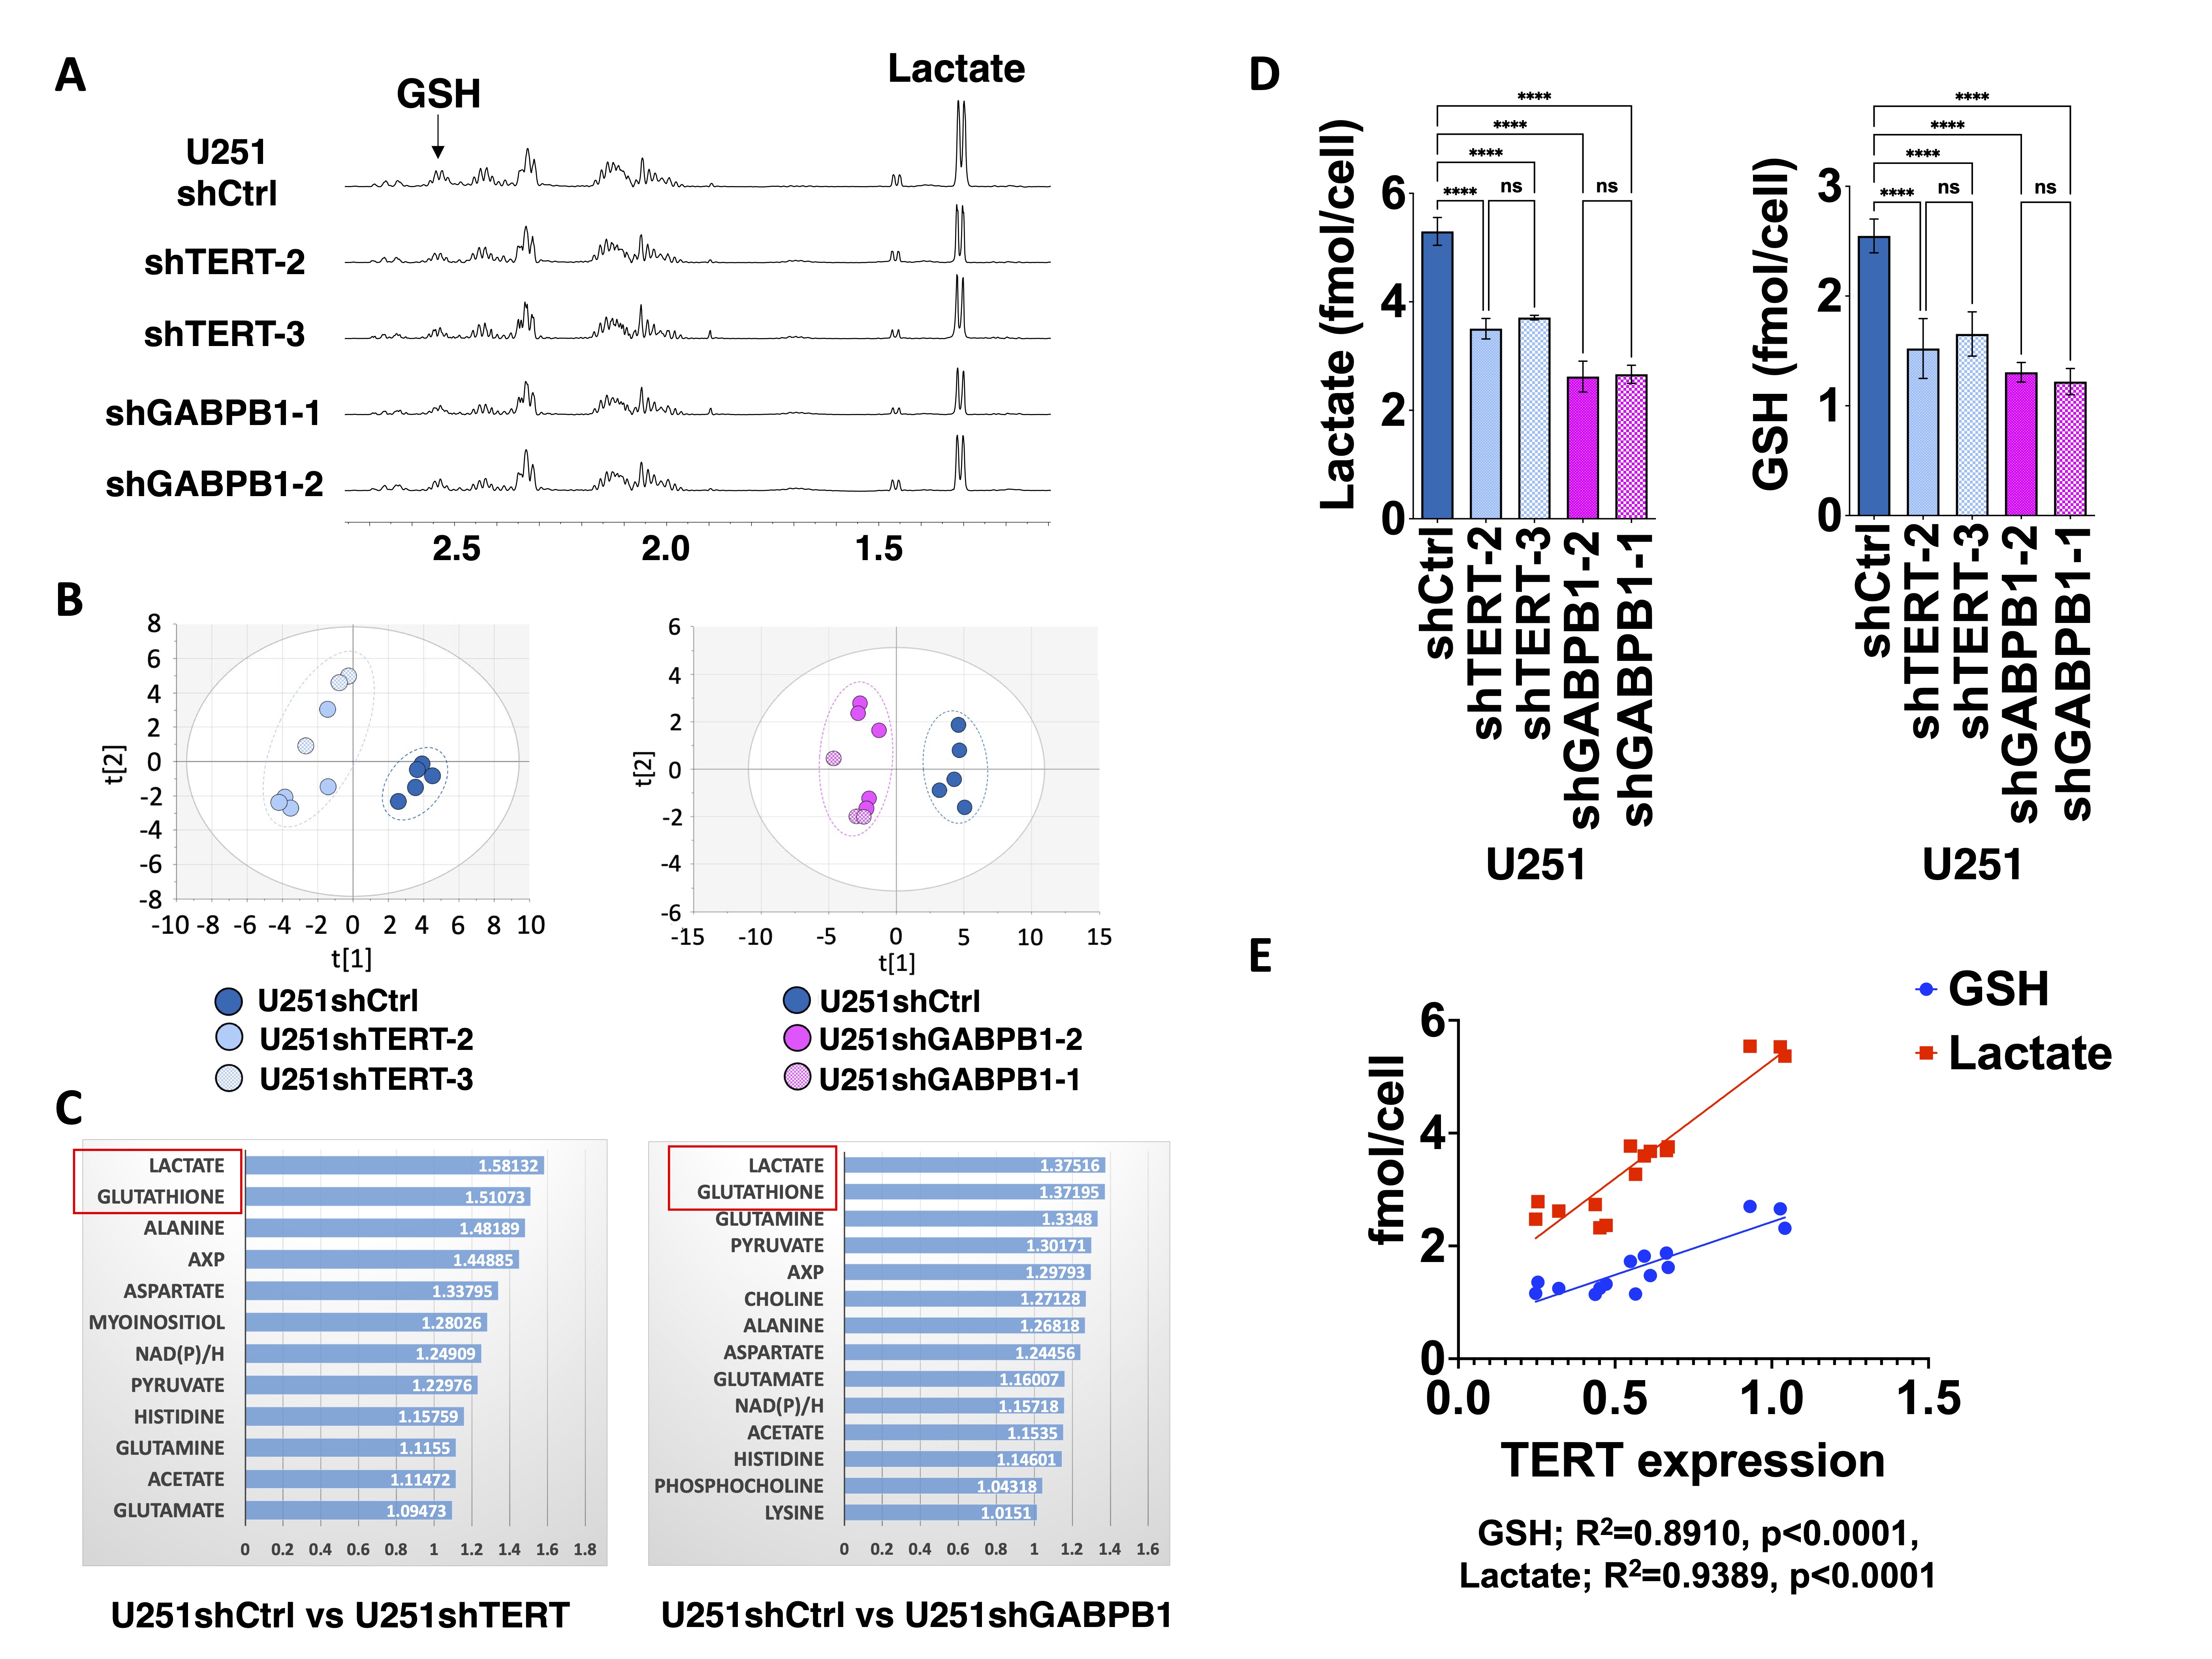
A. Representative spectra of U251 cell lines stably expressing shRNAs. B. PCA comparing U251shCtrl and U251shTERT. C. VIP predictive scores calculated from OPLS-DA comparing U251shCtrl and U251shTERT, and U251shCtrl and U251shGABPB1. Metabolites with a score >1 were illustrated. D. Univariate analysis of lactate and GSH levels comparing U251shCtrl, U251shTERT and U251shGABPB1 cells. E. GSH and lactate levels of all U251sh cells plotted against as a function of TERT expression (GSH; R2=0.8910, p<0.0001, lactate; R2=0.9389, p<0.0001).
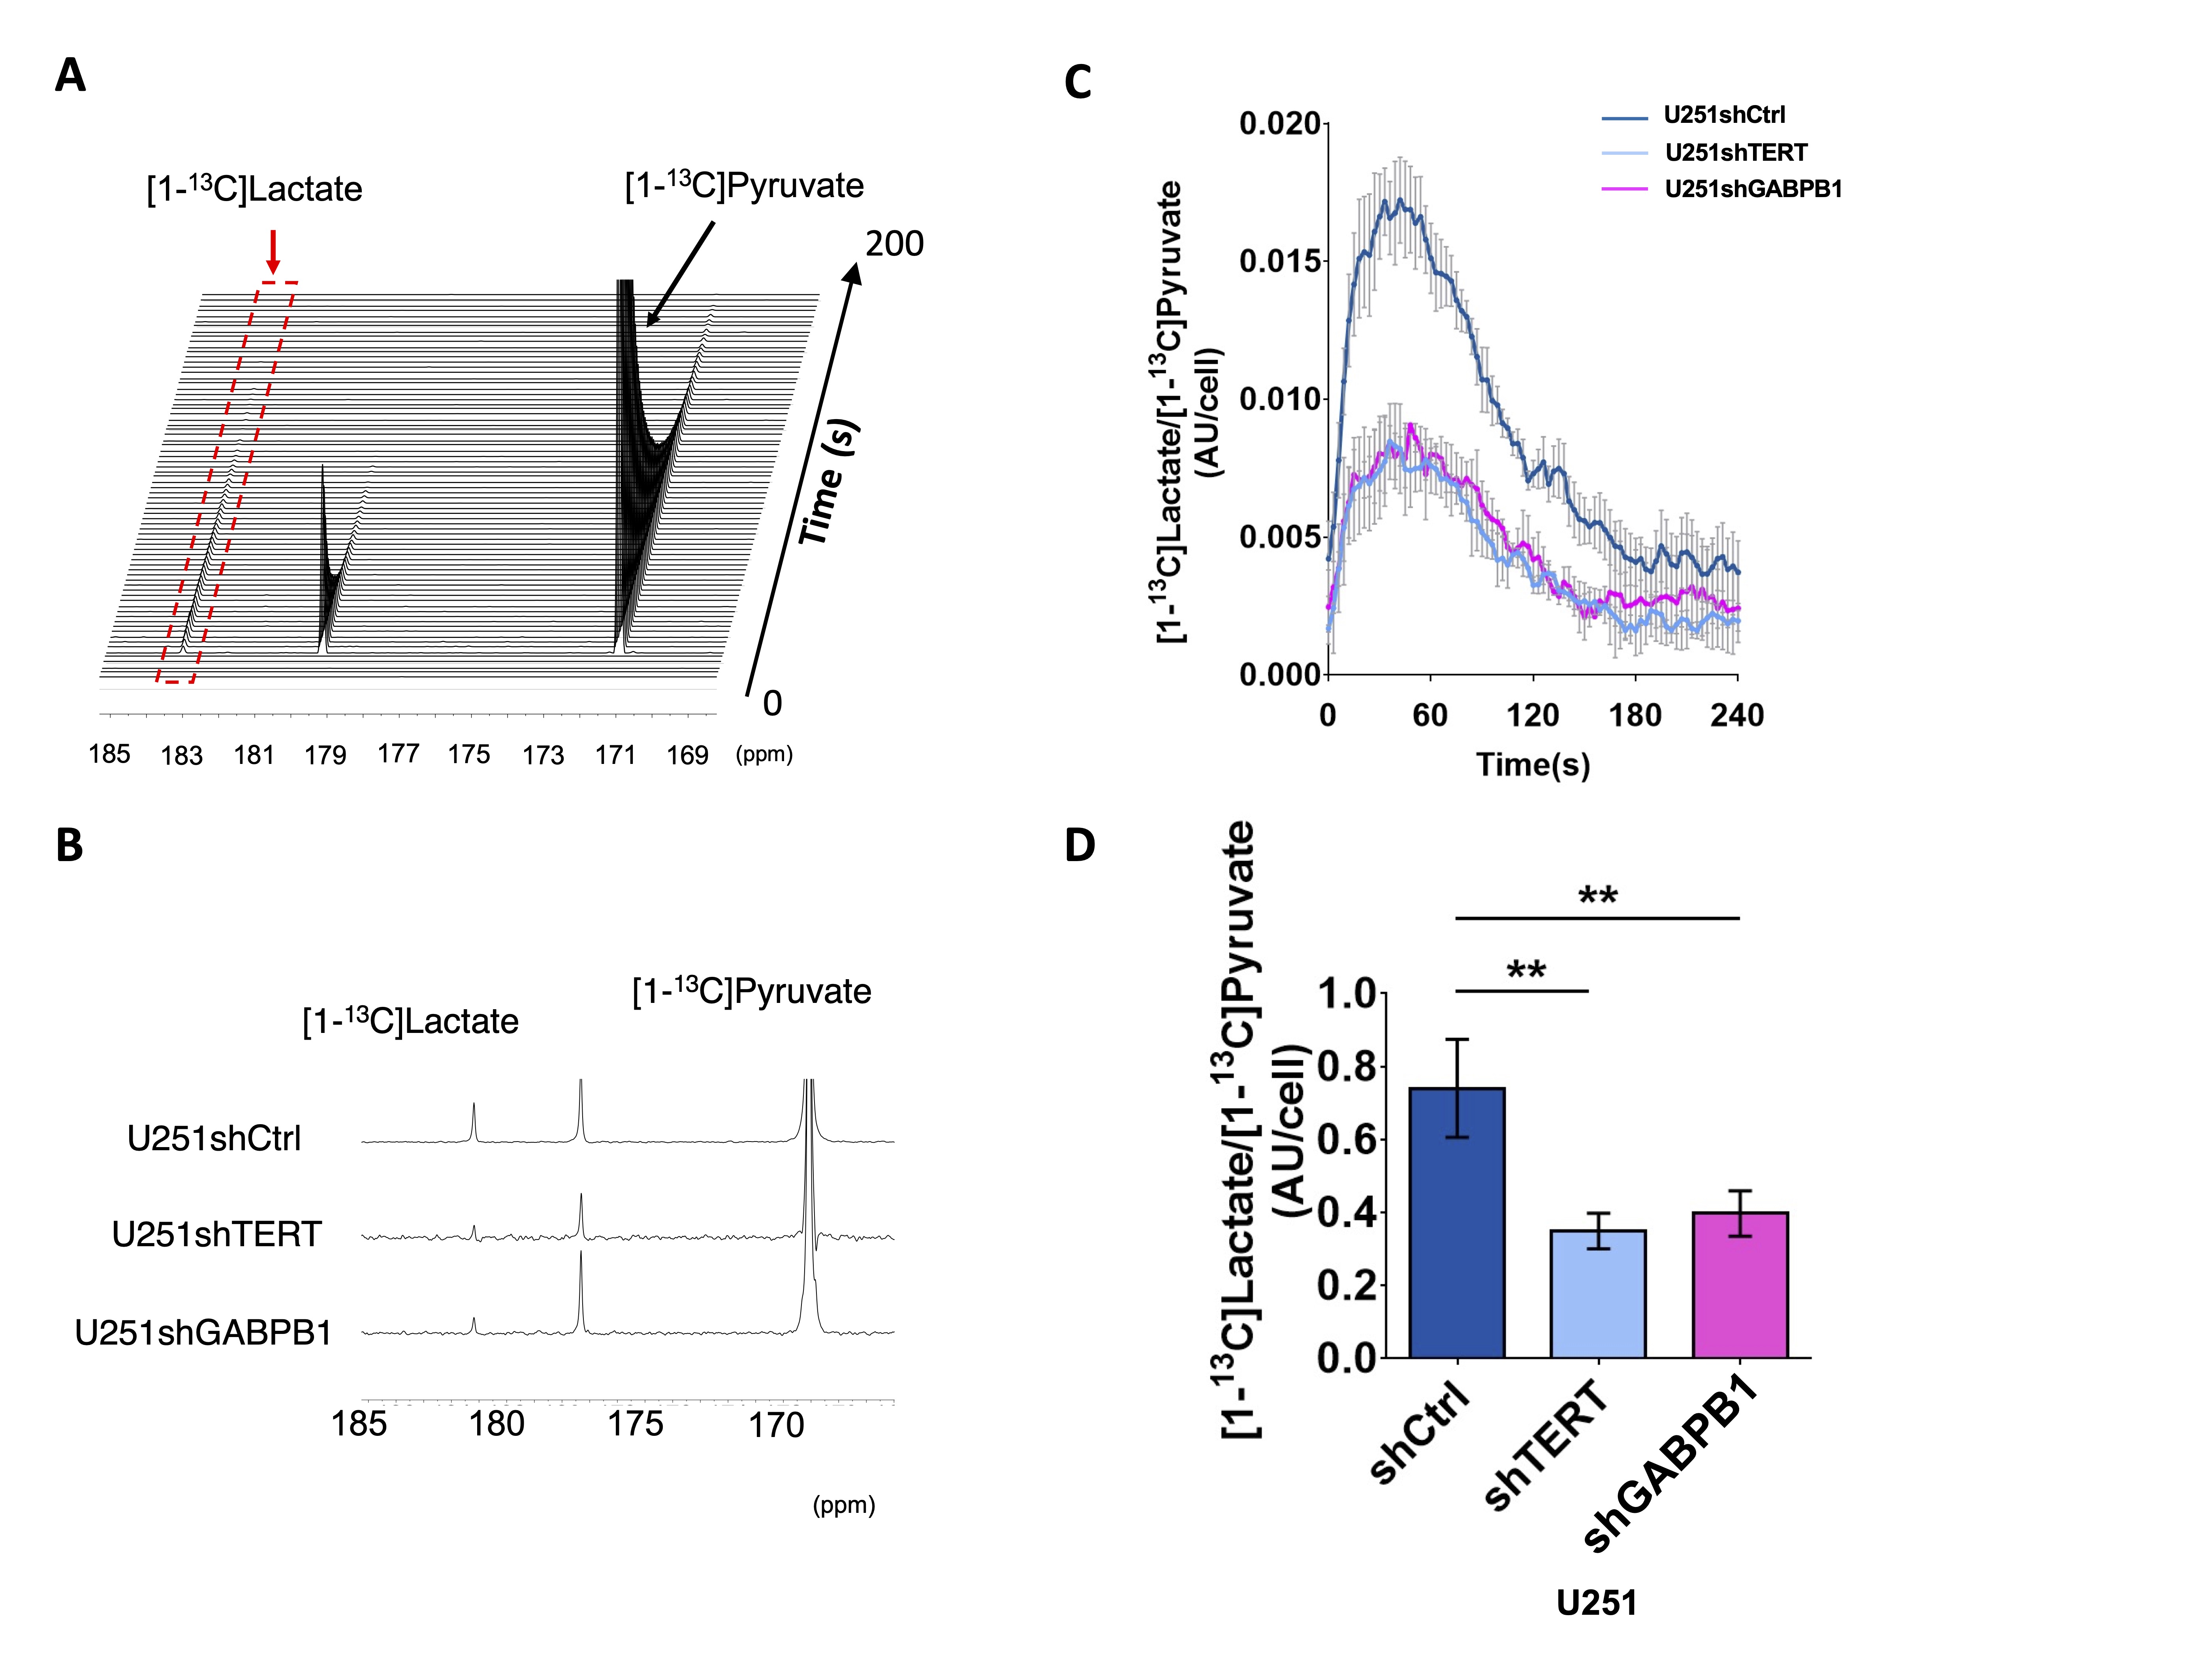
A. Representative spectra array of U251shCtrl following injection of hyperpolarized [1-13C]pyruvate. B. Sum of hyperpolarized spectra comparing U251shCtrl, U251shTERT, and U251shGABPB1. C. Temporal evolution of [1-13C]lactate/[1-13C]pyruvate comparing U251shCtrl, U251shTERT, and U251shGABPB1. D. The AUC of [1-13C]lactate/[1-13C]pyruvate comparing U251shCtrl, U251shTERT, and U251shGABPB1.
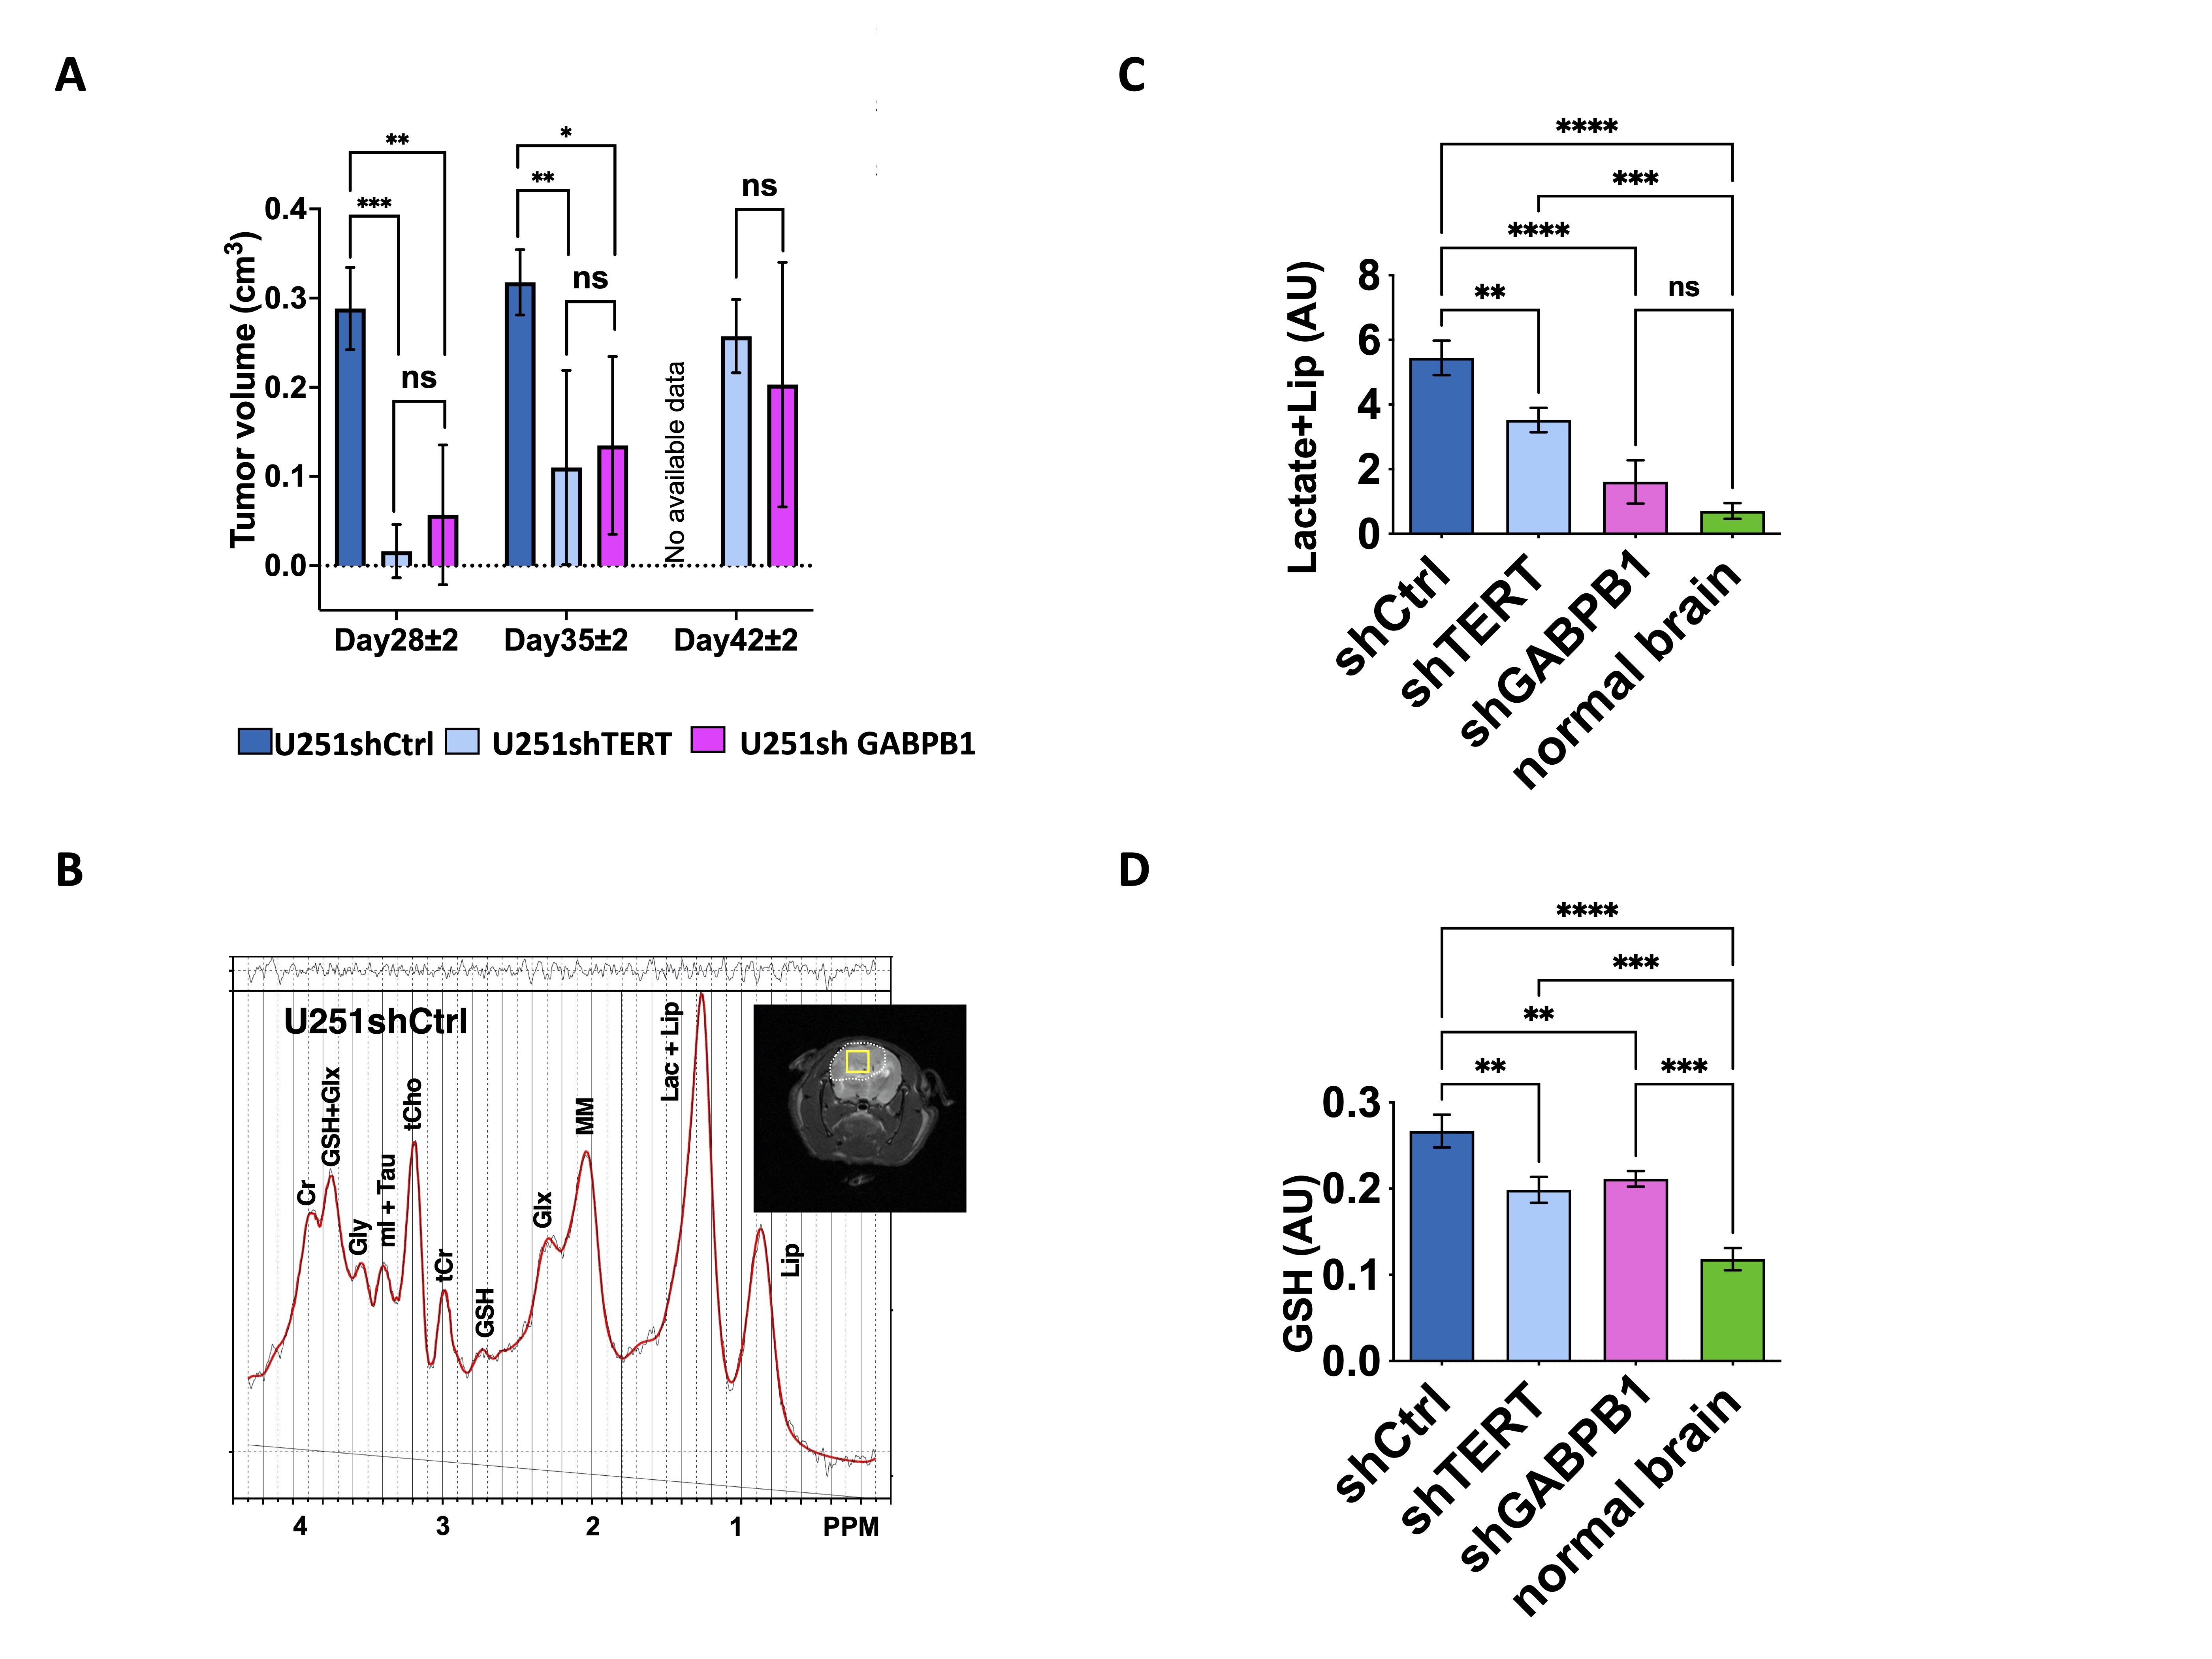
A. Tumor volume change post implantation comparing U251shCtrl, U251shTERT, and U251shGABPB1 (Day28 ± 2, Day35 ± 2, Day42 ± 2). B. Representative 1H-MRS spectrum and T2-weighted image (insert) of U251shCtrl tumor. The tumor is contoured in white and the spectroscopic voxel position is illustrated in yellow in the anatomic image. C. Univariate analysis of the composite lactate plus lipid peak comparing U251shCtrl, U251shTERT, and U251shGABPB1 tumors, and normal brain. D. Univariate analysis of GSH levels comparing U251shCtrl, U251shTERT, and U251shGABPB1.
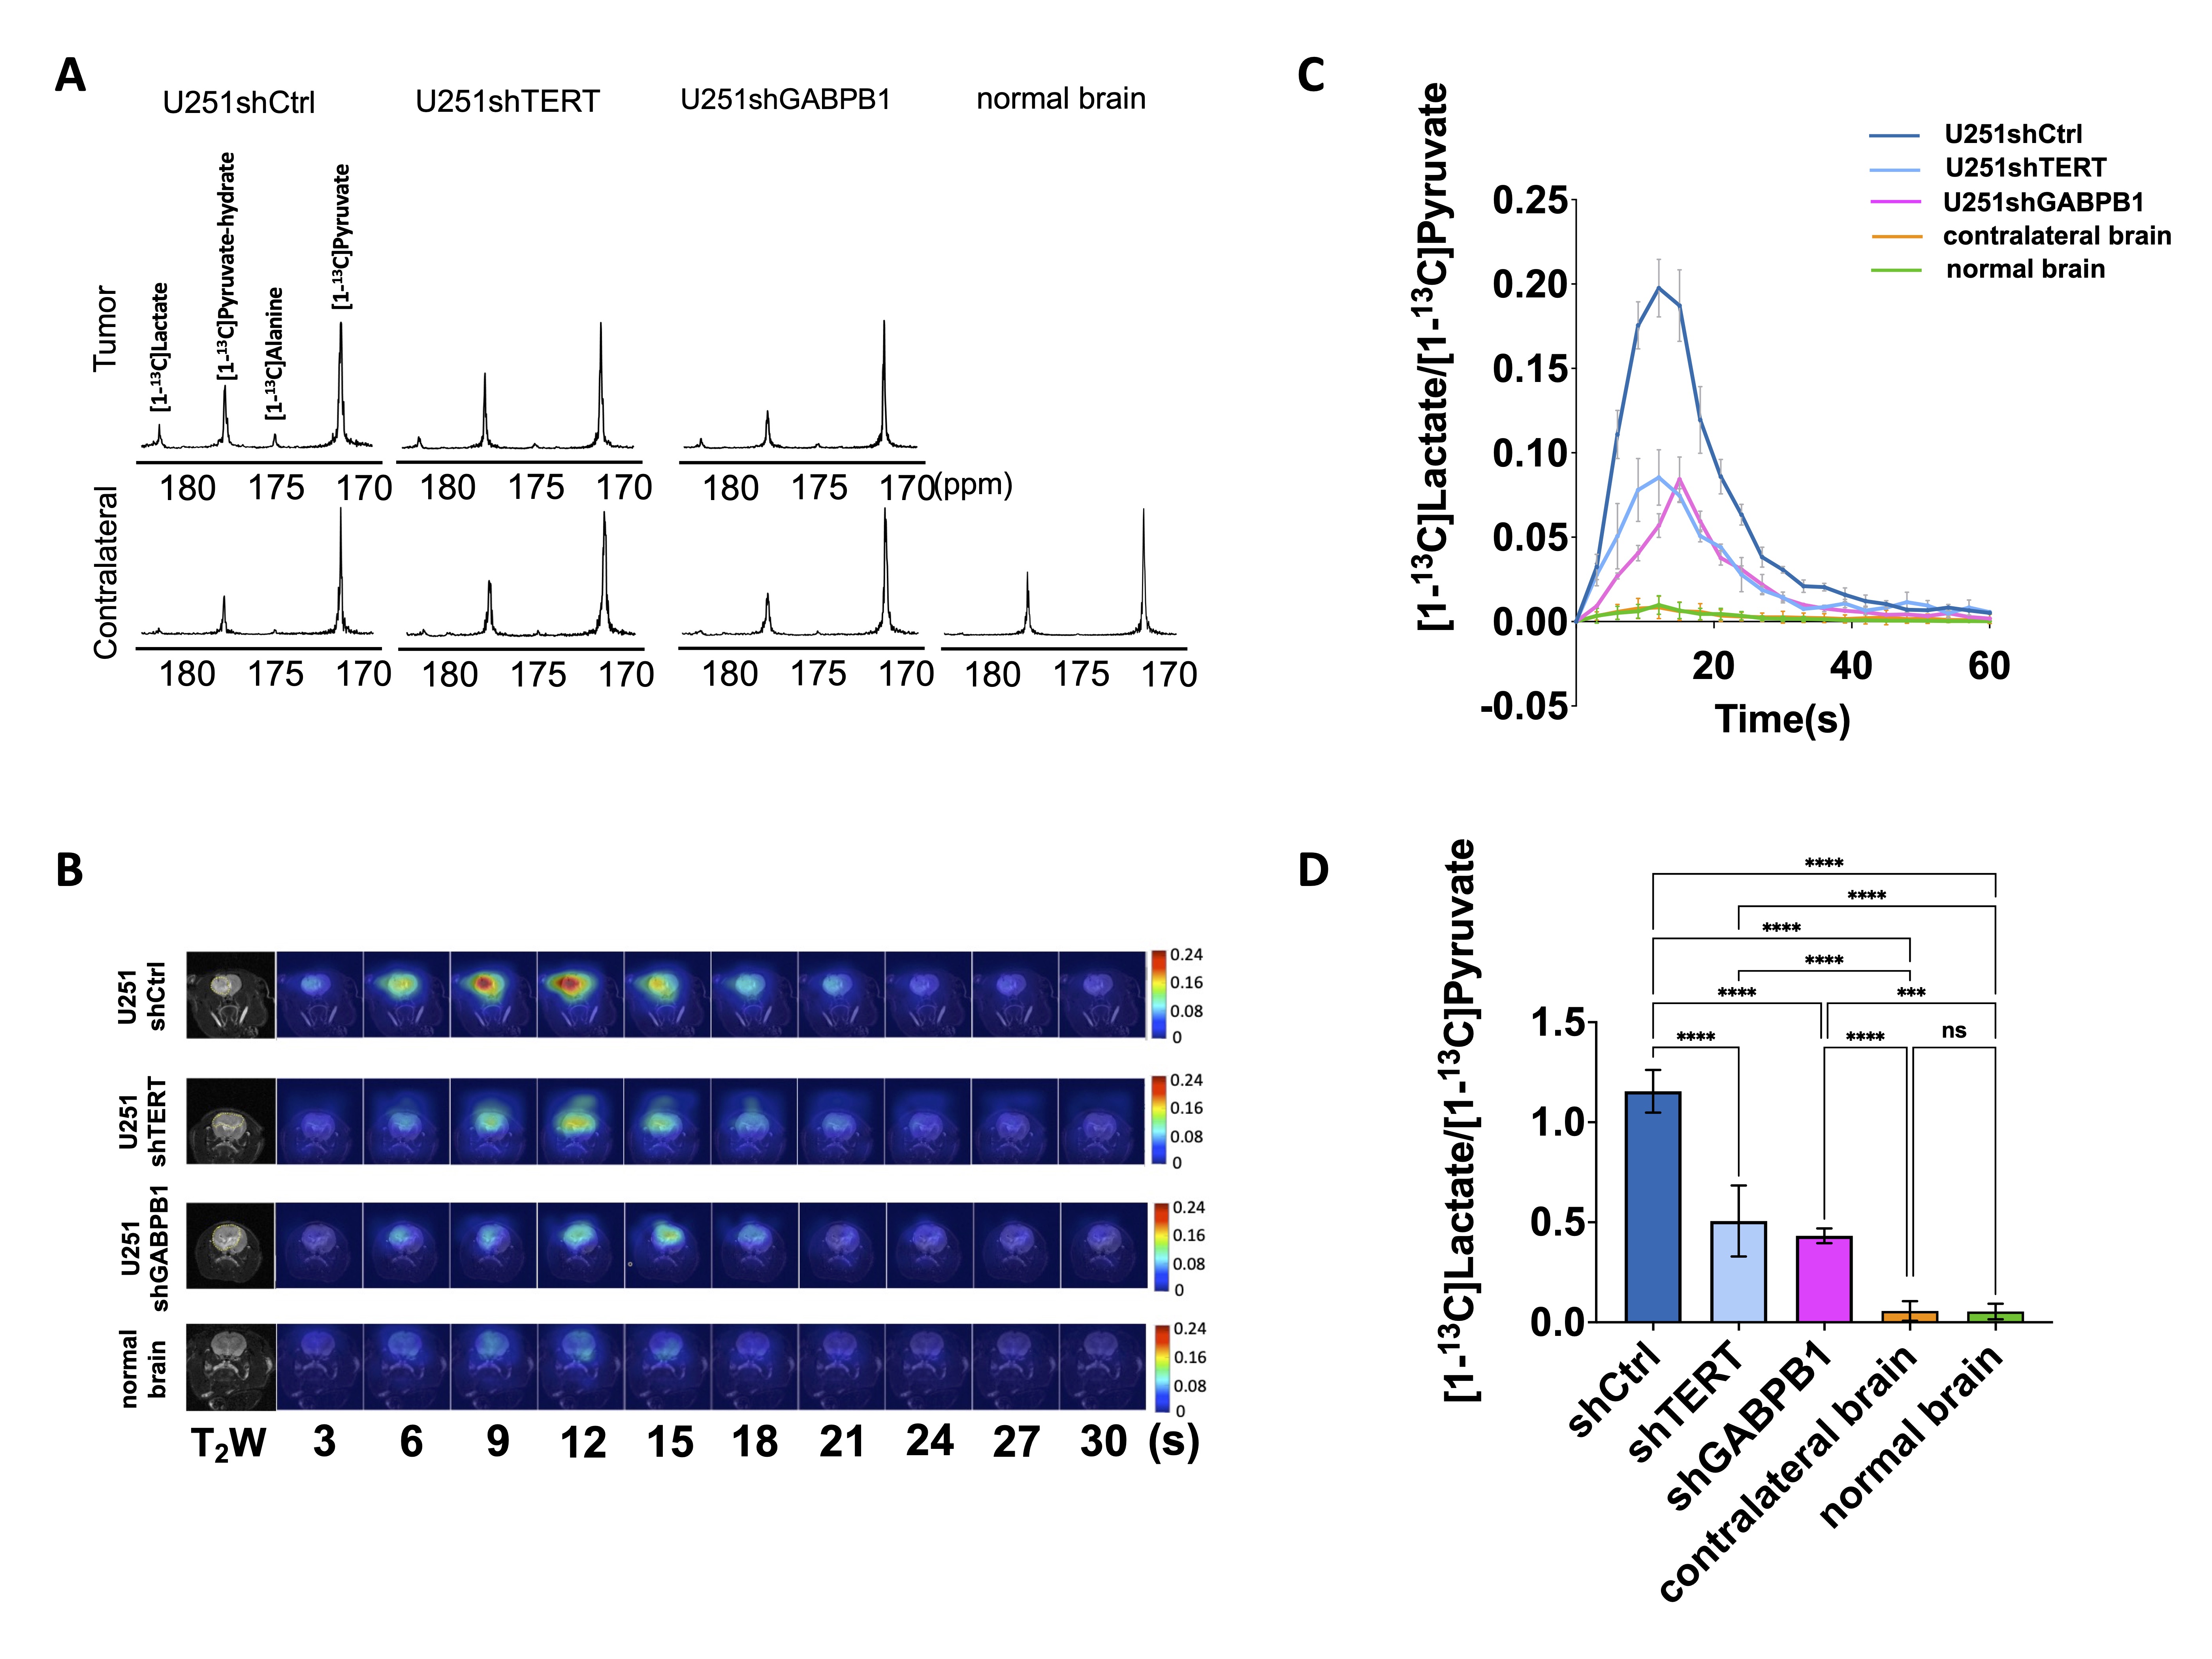
A. Representative 13C spectra from each tumor model at 12 s after injection of hyperpolarized [1-13C]pyruvate. B. Dynamic hyperpolarized 13C EPSI data of [1-13C]lactate acquired from one slice from each tumor model at 3 s temporal resolution. C. Average dynamic lactate to pyruvate ratio of tumor voxel from each tumor model and from contralateral brain and normal brain. D. AUC of [1-13C]lactate/[1-13C]pyruvate comparing U251shCtrl, U251shTERT, U251shGABPB1 tumors, contralateral brain, and normal brain