0282
Medullary vein architecture modulates the white matter BOLD CVR response to CO2: observations from high-resolution T2* weighted imaging at 7T1UMC Utrecht, Utrecht, Netherlands
Synopsis
Brain stress testing using blood oxygenation level-dependent (BOLD) MRI to evaluate changes in cerebrovascular reactivity (CVR) is of growing interest for evaluating white matter integrity. However, even under healthy conditions, the white matter BOLD-CVR response differs notably from that observed in the gray matter. The confluence of arterial hemodynamics and BOLD signal characteristics weighted by venous architecture unrelated to smooth-muscle mediated dilation/contraction play a significant role in defining the WM BOLD-signal response to hypercapnia. This caveat should be taken into account when attributing disease mechanisms and/or progression to presumed impaired WM BOLD-CVR.
Introduction
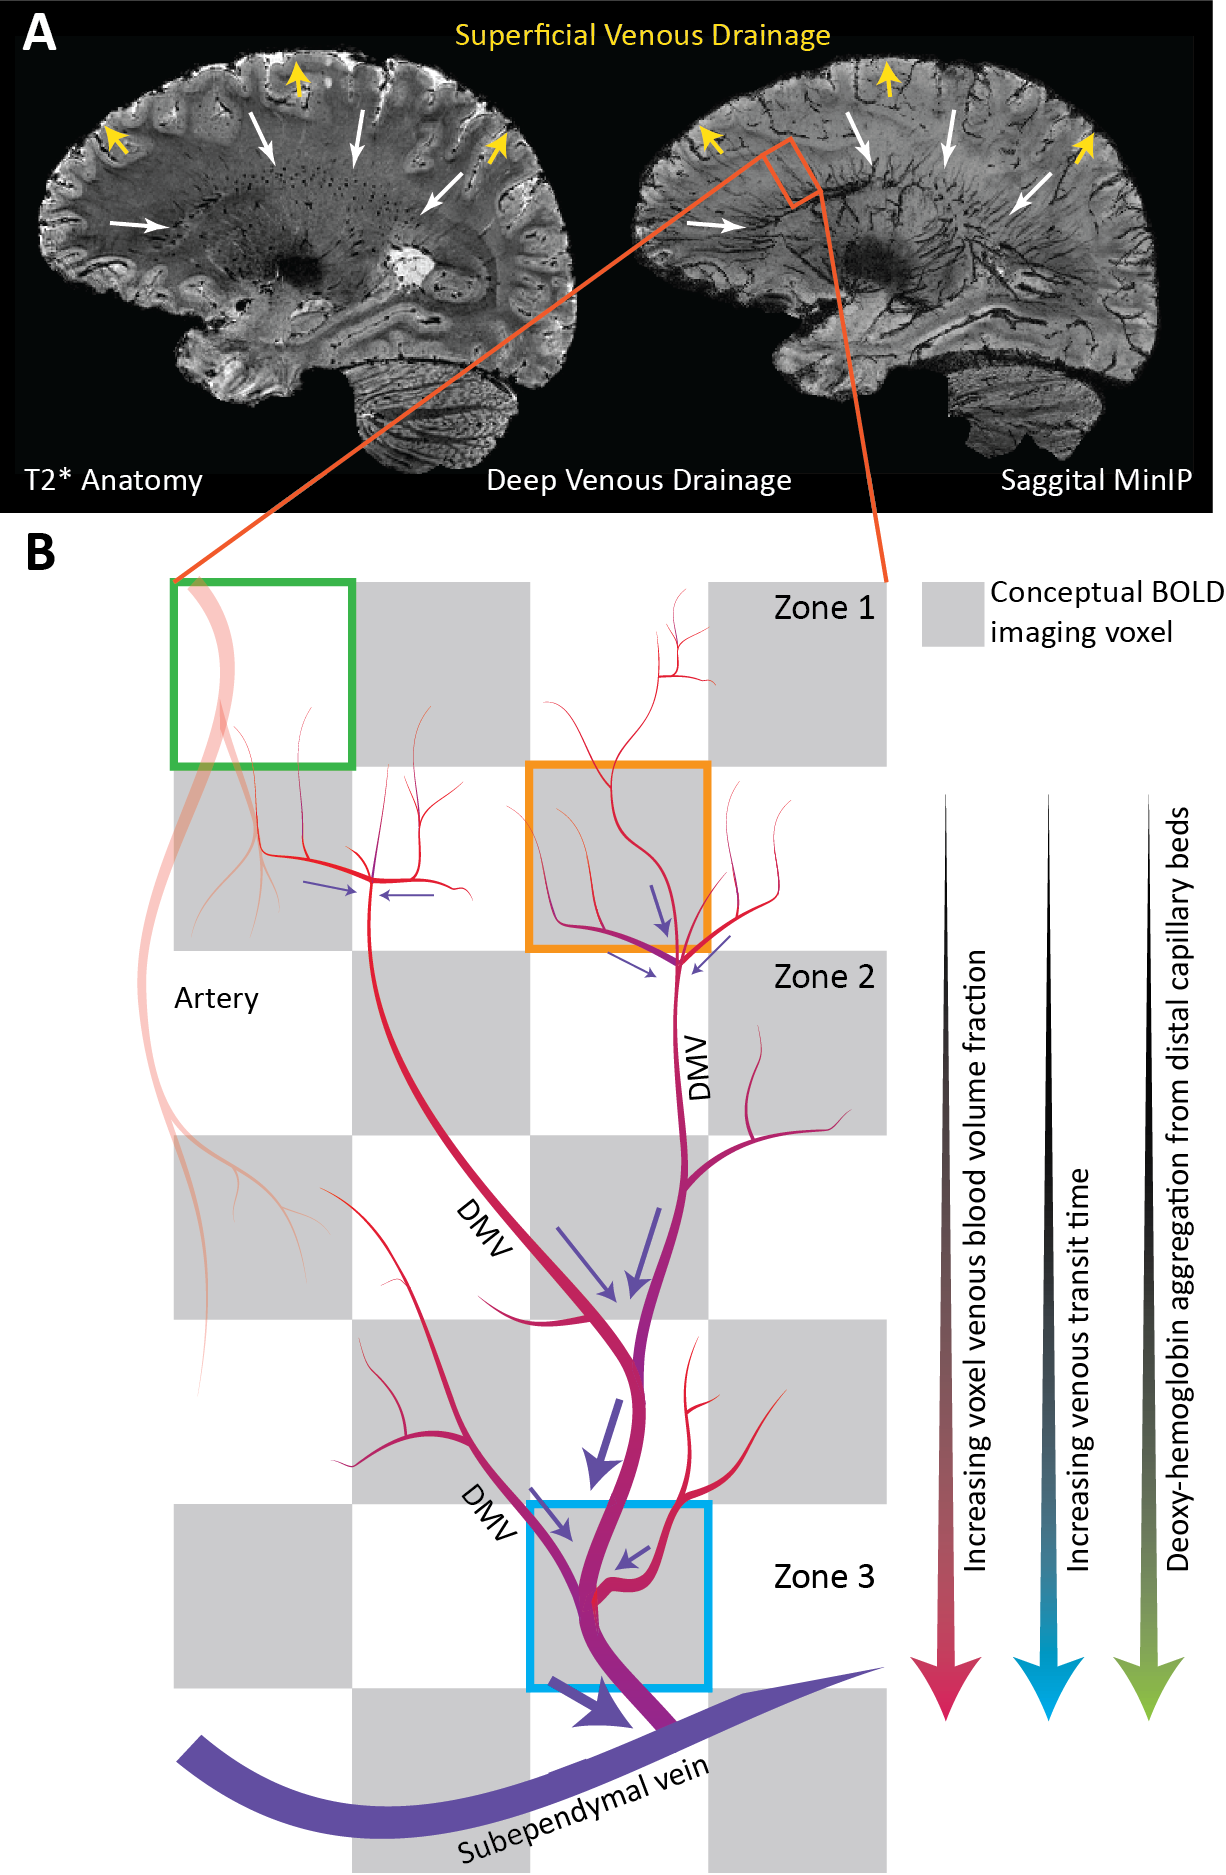
Evaluating CVR using BOLD-MRI is of growing interest for evaluating white matter (WM) integrity. However, even under healthy conditions, the WM BOLD-CVR response differs notably from that in the gray matter. In addition to actual arterial control, the venous draining topology may influence the WM-CVR response leading to signal delays and dispersions. These hemodynamic deviations are sometimes linked with pathology, but may also arise from normal venous architecture (figure 1). To investigate this notion, vascular responses generated using hypercapnic-BOLD imaging were contextualized using high-resolution T2* weighted imaging at 7 tesla. Hemodynamic parameters including base CVR, hemodynamic lag, lag-corrected CVR, response onset and signal dispersion, and finally ΔCVR (corrected - base) were calculated in 8 subjects. Parameter maps were spatially normalized and correlated against an MNI-registered WM medullary vein atlas[1]. Moderate correlations were observed between medullary vessel frequency and various hemodynamic parameters indicating that when assessed in the context of the WM venous architecture, changes in the response shape may only be partially reflective of the actual vascular reactivity response occurring further upstream by control vessels. This finding may have implications when attributing diseases mechanisms and/or progression to presumed impaired WM BOLD-CVR.Methods
This was a retrospective study. The local database was surveyed for datasets containing high-resolution dynamic BOLD-MRI data (Multi-slice single-shot GE-EPI, fa: 90°, TR/TE 3000/25 ms, EPI/SENSE factor 47/3, reconstructed resolution: 1.5 x 1.5 mm2, slice thickness: 1.6 mm, FOV: 217.6 x 192 mm2, acquisition matrix: 133 x 120, slices: 43 ) during which a controlled hypercapnic stimulus (Gen3 RespirAct, Thornhill Research, Canada) was administered. Participants also underwent a high-resolution T2*-weighted anatomical scan (3D multi-shot GE-EPI, fa: 24°, TR/TE: 77/27 ms, EPI factor: 13, SENSE factor RL/FH: 2.3/1, reconstructed resolution: 0.5 mm isotropic, FOV: 240 x 150 x 192 mm3, acquisition matrix: 480 x 381 x 300 mm3, scan duration: 385 s) to visually compare hemodynamic parameter maps with deep WM vasculature. Eight datasets were identified (age(range) 31(9-48) yrs., 4 females). Data was acquired with approval by the medical research ethics committee of UMC Utrecht and written informed consent was obtained from all subjects. The BOLD data was processed using FSL (FMRIB[2], Oxford, UK: BET, MCFLIRT, FAST). Motion corrected BOLD data was then ‘scrubbed’ using functions included in the seeVR toolbox (seeVR[3], Utrecht, The Netherlands). Here, motion parameters (rot/trans) and derivatives (derivative, square) along with PetO2 (in 5 of 8 subjects) traces were regressed out of the source BOLD data. Data were interpolated by a factor of 4 (effective TR 0.75s) and then used to generate hemodynamic lag, base CVR, lag-corrected CVR, ΔCVR (corrected - base), dispersion and onset maps. Lag maps were made using a modified RAPIDTiDe [4] approach while GLM regression of a series of functions based on a double gamma function were used to model dispersion [5,6] and onset. All parameter maps were generated based on implementations available in the seeVR toolbox. Hemodynamic parameter maps were co-registered (via corresponding BOLD image) to the a 1mm MNI-template via the T2*-w anatomical image(FSL: FLIRT, FNIRT) whose WM segmentation (FAST) was used to delineate WM on all maps. A minimum intensity projection of the T2*-w image was generated based in a 9.5mm slab for qualitative comparison. Normalization to MNI space facilitated a group-level correlation analysis (Pearson correlation) between the MNI-registered medullary vein atlas with hemodynamic maps.Results
An representative example of the data-scrubbing process is shown in figure 2 In general, a qualitative spatial correspondence was evident between medullary veins visible in MinIP with the various hemodynamic parameter maps (figure 3). For the group-level analysis (figure 4), moderate correlations (Pearson’s rho) were observed between medullary vessel frequency (MVF) and ΔCVR (0.52), MVF and lag (0.42), MVF and dispersion (0.44), and MVF and onset (0.43).Discussion
The main finding reported herein was that parametric maps showed moderate positive correlations with the frequency of the larger WM medullary veins. Considering BOLD contrast mechanisms, this finding supports the hypothesis that drainage topology plays an important role in determining WM BOLD-CVR characteristics that might otherwise be attributed solely to auto-regulatory dilation/constriction. This notion supports parallel findings in GM, where venous physiology is known to impact the specificity of fMRI responses [7]. Unlike the GM which drains to the surface following closely with feeding arterioles, the WM drains towards the ventricles passing through several zones of convergence [8]. Progressive pooling of dHb descending venous tributaries has two consequences. First, total dHb increases as blood drains from sub-cortical WM towards the larger peri-ventricular medullary veins. Here, both the blood volume fraction and total dHb concentration may evoke a stronger BOLD signal effect. Second, as the venous blood drains, it moves away from the actual site of arterial reactivity leading to a potential delocalization of the CVR signal response (see conceptual example; figure 5). Especially at lower fields, where intravenous signal contributions increase and larger voxels and smoothing kernels are typically applied. In light of this new perspective, integrating knowledge of venous organization can sharpen the application of CVR as a biomarker for diseases affecting the WM. This caveat should be considered when attributing disease mechanisms and/or progression to presumed impaired WM-CVR inferred via longer hemodynamic lag or increased signal dispersion.Acknowledgements
The author thanks Hans Hoogduin and Marielle Philippens for their mentorship and supervision during the period in which the data used in this study was acquired. Also thanks to Wouter Schellekens, Mario Gilberto Báez Yáñez and Jaco J.M. Zwanenburg for valuable discussions, and Hugo Kuijf for providing the medullar vein atlas. This work was supported by a Dutch research council talent grant awarded to Alex A. Bhogal (NWO VENI: The ischemic fingerprint, [VI.VENI.194.056]. The analysis tools used to generate the results presented in this manuscript are freely available via the open-source seeVR toolbox (https://github.com/abhogal-lab/seeVR).References
[1] Kuijf HJ, Bouvy WH, Zwanenburg JJ, et al. Quantification of deep medullary veins at 7 T brain MRI. European radiology. 2016; 26: 3412-8.
[2] Jenkinson M, Beckmann CF, Behrens TE, Woolrich MW and Smith SM. FSL. Neuroimage. 2012; 62: 782-90.
[3] Bhogal AA. seeVR: a toolbox for analyzing cerebrovascular reactivity data. Zenodo. 2021; (v1.01).
[4] Donahue MJ, Strother MK, Lindsey KP, Hocke LM, Tong Y and Frederick BD. Time delay processing of hypercapnic fMRI allows quantitative parameterization of cerebrovascular reactivity and blood flow delays. JCBFM. 2016; 36: 1767-79.
[5] Poublanc J, Crawley AP, Sobczyk O, et al. Measuring cerebrovascular reactivity: the dynamic response to a step hypercapnic stimulus. JCBFM. 2015; 35: 1746-56.
[6] Yao JF, Yang HS, Wang JH, et al. A novel method of quantifying hemodynamic delays to improve hemodynamic response, and CVR estimates in CO2 challenge fMRI. JCBFM. 2021; 41: 1886-98.
[7] Turner R. How much cortex can a vein drain? Downstream dilution of activation-related cerebral blood oxygenation changes. Neuroimage. 2002; 16: 1062-7.
[8] Taoka T, Fukusumi A, Miyasaka T, et al. Structure of the Medullary Veins of the Cerebral Hemisphere and Related Disorders. Radiographics : a review publication of the Radiological Society of North America, Inc. 2017; 37: 281-97.
Figures