0279
Cerebral blood flow is associated with cerebral microstructural integrity in normative aging1National Institute on Aging, Baltimore, MD, United States
Synopsis
Maintenance of cerebral tissue homeostasis is particularly sensitive to deficits in cerebral blood flow (CBF) and concomitant hypoxia and hypoglycemia. However, little work has been conducted to investigate the potential association between deficits in CBF and deterioration of brain microstructure, especially in normative aging. The results of our analysis, conducted on a large cohort of cognitively unimpaired adults, of the association between CBF and several MRI metrics of cerebral microstructural integrity, indicate that low CBF values correspond to low tissue integrity. These results provide further evidence of the intimate relationship between neurovascular physiology and brain integrity throughout normative aging.
INTRODUCTION
Gray matter (GM) and white matter (WM) tissue deterioration and decline in cerebral blood flow (CBF) are central features of several neurodegenerative diseases (1-6). Brain tissue maintenance is an energy-demanding process, making it particularly sensitive to hypoperfusion and concomitant hypoxia and hypoglycemia. Despite its central importance, little is known about the association between blood flow and brain microstructural integrity, including in normative aging (7-9). Examining the extent of this potential relationship is sine qua non for understanding the interactions between CBF and tissue integrity in impaired populations. Here, we investigated the regional association between CBF and deterioration of cerebral microstructural integrity probed using various MR imaging metrics in a large cohort of well-characterized adults.METHODS
Study cohort and data acquisitionThe study cohort consisted of 94 subjects (age 50.7±19.2years, 38 women) spanning the age range between 22 and 88 years. Participants underwent i) a pseudo-continuous arterial spin labeling (pCASL) imaging for CBF mapping (11,12). This consisted of acquiring control, labeled, and proton density (PD) images at labeling duration of 1.8 s, post-labeling duration of 2 s, and 30 signal averages; details of this imaging protocol can be found in (10), ii) our BMC-mcDESPOT imaging for myelin water fraction (MWF) mapping (11-14), a surrogate of myelin content, and longitudinal and transverse relaxation rates (R1 and R2) mapping, sensitive metrics to myelin content, axonal density, dendritic density, synaptic density, and iron content (15); details of this and the mcDESPOT imaging protocol can be found in (11), and iii) diffusion tensor imaging (DTI) for fractional anisotropy (FA), and mean, radial and axial diffusivities (FA, MD, RD and AxD) mapping; details about this imaging protocol can be found in (16, 17).
Image processing
For each subject, whole-brain MWF, R1 and R2 maps were generated using the BMC-mcDESPOT (12-14), DESPOT1 and DESPOT2 analyses (18), whole-brain maps of FA, MD, RD and AxD maps were derived from the DTI dataset using FSL (16, 17, 19), and a whole-brain CBF map was generated from the pCASL dataset using the NESMA-ASL analysis to improve accuracy and precision in CBF determination (10, 20). All derived parameter maps were nonlinearly registered to the MNI atlas using FSL (19). Finally, mean parameter values were calculated in six WM and GM regions-of-interest (ROIs) defined from MNI.
Statistical analysis
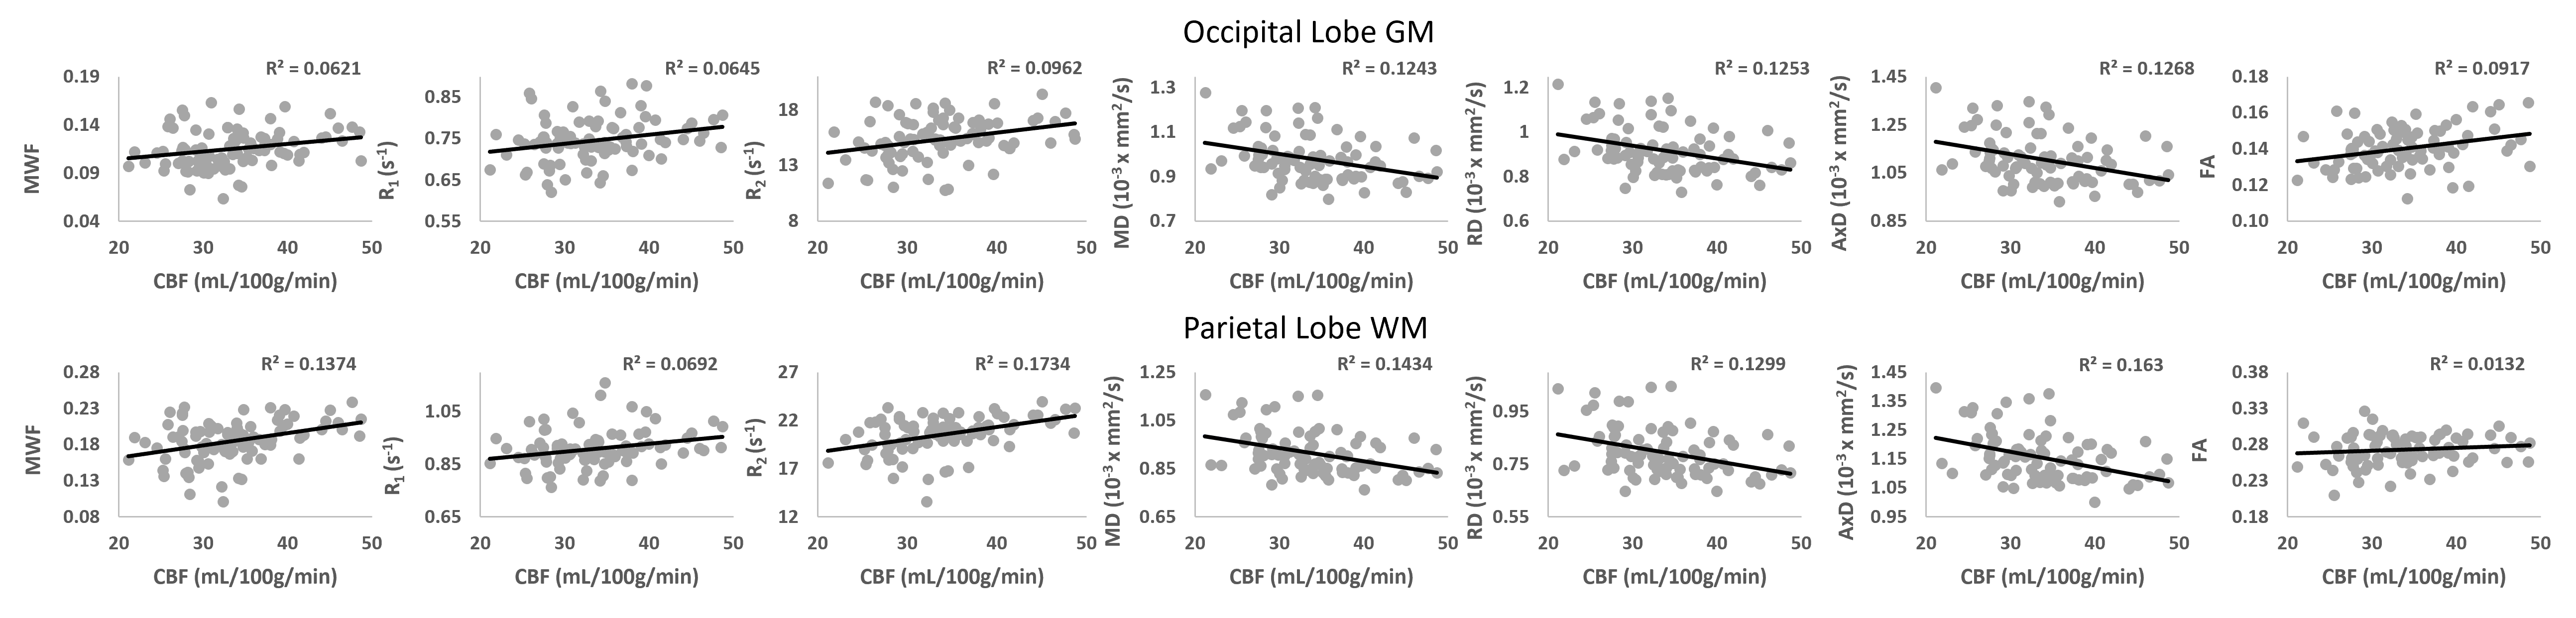
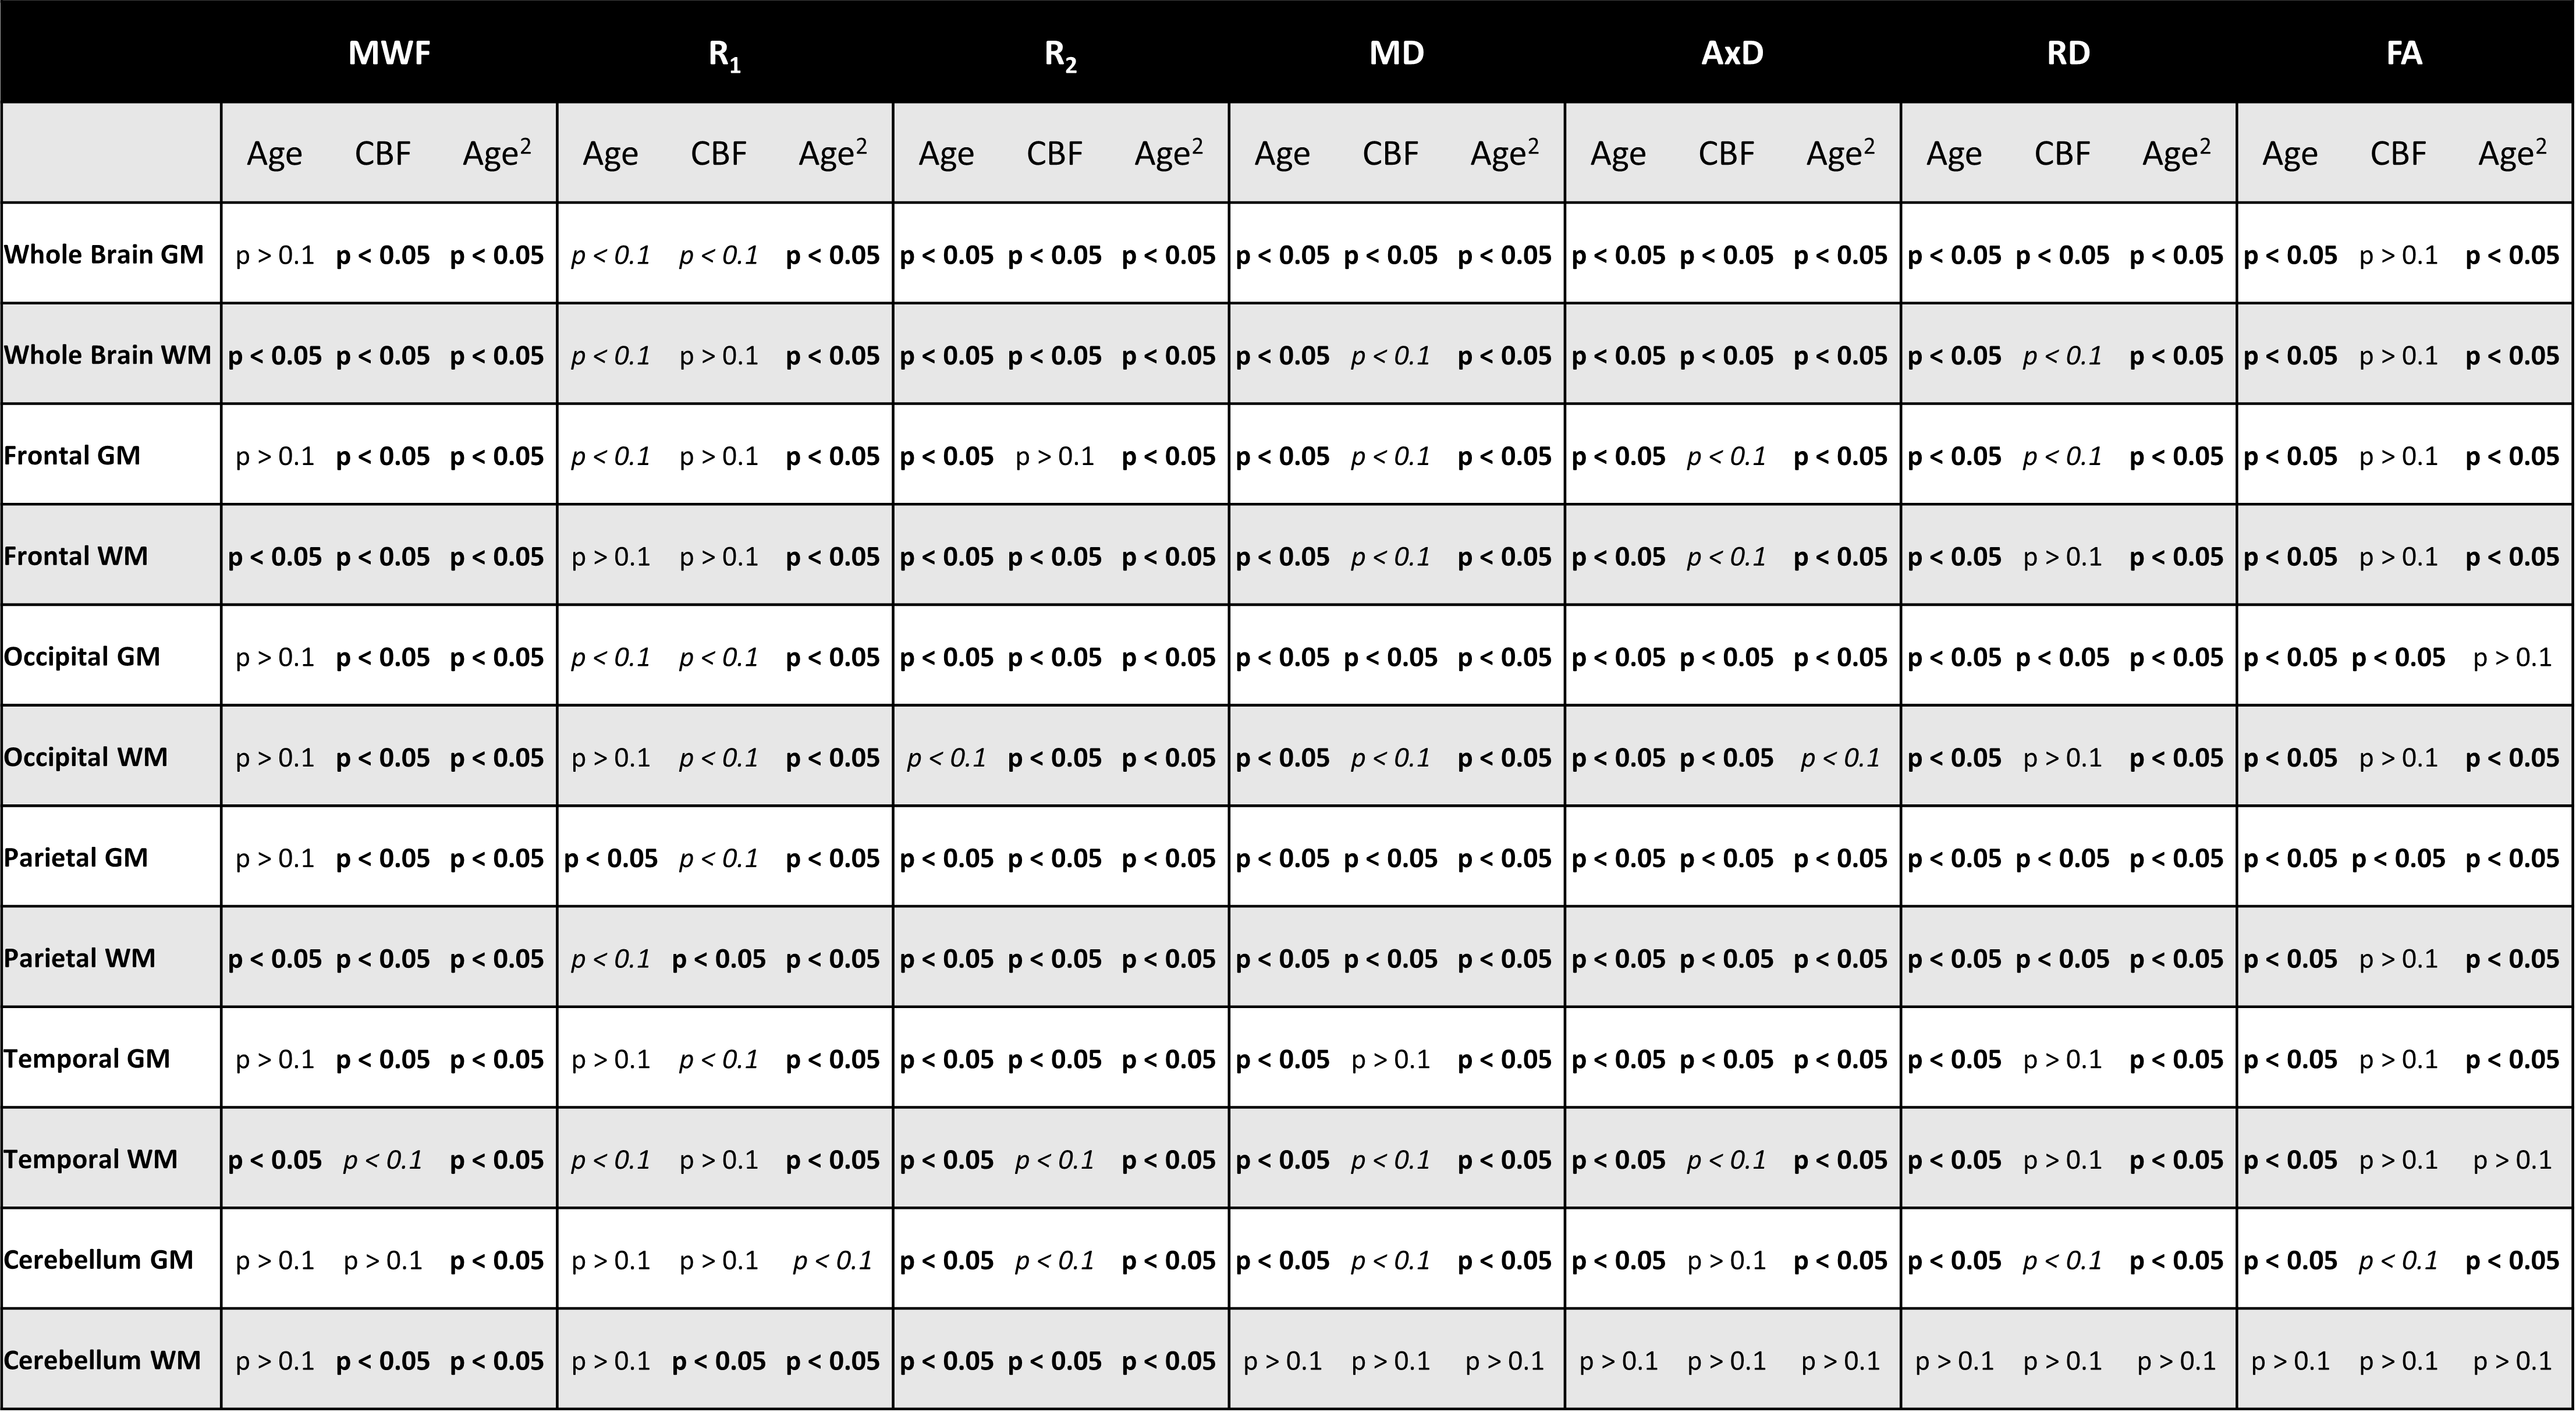
For each ROI, the effect of CBF on each MR parameter, that is, MWF, R1, R2, FA, MD, RD, or AxD, was investigated using multiple linear regression with the mean MR parameter value within the ROI as the dependent variable and CBF, age, and age2 as the independent variables.
RESULTS & DISCUSSION
Figure 1 show plots of the relationship between CBF and each MR parameter studied for representative ROIs. It is readily seen that lower CBF values correspond to lower FA, R1, R2 and MWF values or higher MD, AxD and RD values. Our statistical analysis indicates that these associations between CBF and these MR parameters of tissue integrity were statistically significant (pCBF<0.05) or close to significance (pCBF<0.1) in several GM and WM structures examined (Table 1). Interestingly, this association was more pronounced between CBF and MWF as well as CBF and AxD; this agrees with literature and our recent work in this much larger cohort size (7-9), suggesting that myelin sheets, axons, dendrites, and synapses are vulnerable to deficits in blood supply. Indeed, this functional relationship has been documented in animal studies showing that glial cells, including oligodendrocytes, the cells responsible for myelin synthesis and trophic support to neurons, are vulnerable to blood flow deficits, and that loss of these cells may occur rapidly in response to chronic hypoperfusion (21, 22). Further, deterioration of GM tissue due to deficits in CBF would be expected as several studies have shown that high consumption of energy is crucial for normal functioning of the brain. It has been shown that a substantial amount of this energy is used to support synaptic activity (23), while dendritic structures were rapidly distorted after acute or chronic ischemia (24). Therefore, inadequate supply of blood glucose and oxygen to the cortical tissue may lead to neuronal and glia death. Therefore, our results provide further evidence of this association in normative aging.Finally, the effect of age on all MR parameters studied was statistically significant in all ROIs evaluated, as expected. Similarly, in agreement with literature (11, 25-28), the quadratic effect of age, age2, was significant in most brain regions for all observed metrics (Table 1). This quadratic pattern reflects brain maturation until middle age followed by a rapid phase of degeneration at older ages.
CONCLUSIONS
These findings suggest that blood flow may significantly impact GM and WM integrity. We expect that this work may lay the foundation for investigations to further establish this link and to clarify the nature of early brain damage in MRI markers of neurodegeneration, including small vessel ischemic disease or Alzheimer’s disease. These studies may lead to new neuroimaging biomarkers of brain microstructure and function for disease progression.Acknowledgements
This work was supported by the Intramural Research Program of the National Institute on Aging of the National Institutes of Health.References
1. Roher AE, Debbins JP, Malek-Ahmadi M, Chen K, Pipe JG, Maze S, et al. Cerebral blood flow in Alzheimer's disease. Vasc Health Risk Manag. 2012;8:599-611.
2. Sweeney MD, Kisler K, Montagne A, Toga AW, Zlokovic BV. The role of brain vasculature in neurodegenerative disorders. Nature neuroscience. 2018;21(10):1318-31.
3. Nasrabady SE, Rizvi B, Goldman JE, Brickman AM. White matter changes in Alzheimer’s disease: a focus on myelin and oligodendrocytes. Acta Neuropathologica Communications. 2018;6:22.
4. Moll NM, Rietsch AM, Thomas S, Ransohoff AJ, Lee J-C, Fox R, et al. Multiple sclerosis normal-appearing white matter: pathology-imaging correlations. Annals of neurology. 2011;70(5):764-73.
5. Minkova L, Habich A, Peter J, Kaller CP, Eickhoff SB, Klöppel S. Gray matter asymmetries in aging and neurodegeneration: A review and meta-analysis. Human brain mapping. 2017;38(12):5890-904.
6. Shi Y, Thrippleton MJ, Makin SD, Marshall I, Geerlings MI, de Craen AJM, et al. Cerebral blood flow in small vessel disease: A systematic review and meta-analysis. Journal of cerebral blood flow and metabolism : official journal of the International Society of Cerebral Blood Flow and Metabolism. 2016;36(10):1653-67.
7. Chen JJ, Rosas HD, Salat DH. The Relationship between Cortical Blood Flow and Sub-Cortical White-Matter Health across the Adult Age Span. PloS one. 2013;8(2):e56733.
8. Giezendanner S, Fisler MS, Soravia LM, Andreotti J, Walther S, Wiest R, et al. Microstructure and Cerebral Blood Flow within White Matter of the Human Brain: A TBSS Analysis. PloS one. 2016;11(3):e0150657.
9. Bouhrara M, Alisch J, Nikkita N, Kim R, Rejimon A, Cortina L, et al. Association of cerebral blood flow with myelin content in cognitively unimpaired adults BMJ Neurology Open. 2020;2:e000053.
10. Alisch JSR, Khattar N, Kim RW, Cortina LE, Rejimon AC, Qian W, et al. Sex and age-related differences in cerebral blood flow investigated using pseudo-continuous arterial spin labeling magnetic resonance imaging. Aging (Albany NY). 2021;13(4):4911-25.
11. Bouhrara M, Rejimon AC, Cortina LE, Khattar N, Bergeron CM, Ferrucci L, et al. Adult brain aging investigated using BMC-mcDESPOT based myelin water fraction imaging. Neurobiology of aging. 2020;85:131-9.
12. Bouhrara M, Spencer RG. Incorporation of nonzero echo times in the SPGR and bSSFP signal models used in mcDESPOT. Magnetic resonance in medicine. 2015;74(5):1227-35.
13. Bouhrara M, Spencer RG. Improved determination of the myelin water fraction in human brain using magnetic resonance imaging through Bayesian analysis of mcDESPOT. NeuroImage. 2016;127:456-71.
14. Bouhrara M, Spencer RG. Rapid simultaneous high-resolution mapping of myelin water fraction and relaxation times in human brain using BMC-mcDESPOT. NeuroImage. 2017;147:800-11.
15. Deoni SC. Quantitative relaxometry of the brain. Topics in magnetic resonance imaging : TMRI. 2010;21(2):101-13.
16. Bouhrara M, Kim RW, Khattar N, Qian W, Bergeron CM, Melvin D, et al. Age-related estimates of aggregate g-ratio of white matter structures assessed using quantitative magnetic resonance neuroimaging. Human brain mapping.n/a(n/a).
17. Cortina LE, Kim RW, Kiely M, Triebswetter C, Gong Z, Alsameen MH, et al. Cerebral aggregate g-ratio mapping using magnetic resonance relaxometry and diffusion tensor imaging to investigate sex and age-related differences in white matter microstructure. Magnetic resonance imaging. 2022;85:87-92.
18. Deoni SC, Peters TM, Rutt BK. High-resolution T1 and T2 mapping of the brain in a clinically acceptable time with DESPOT1 and DESPOT2. Magnetic resonance in medicine. 2005;53(1):237-41.
19. Jenkinson M, Beckmann CF, Behrens TE, Woolrich MW, Smith SM. FSL. NeuroImage. 2012;62(2):782-90.
20. Bouhrara M, Lee DY, Rejimon AC, Bergeron CM, Spencer RG. Spatially adaptive unsupervised multispectral nonlocal filtering for improved cerebral blood flow mapping using arterial spin labeling magnetic resonance imaging. Journal of Neuroscience Methods. 2018.
21. Choi BR, Kim DH, Back DB, Kang CH, Moon WJ, Han JS, et al. Characterization of White Matter Injury in a Rat Model of Chronic Cerebral Hypoperfusion. Stroke; a journal of cerebral circulation. 2016;47(2):542-7.
22. Cechetti F, Pagnussat AS, Worm PV, Elsner VR, Ben J, da Costa MS, et al. Chronic brain hypoperfusion causes early glial activation and neuronal death, and subsequent long-term memory impairment. Brain Res Bull. 2012;87(1):109-16.
23. Attwell D, Buchan AM, Charpak S, Lauritzen M, Macvicar BA, Newman EA. Glial and neuronal control of brain blood flow. Nature. 2010;468(7321):232-43.
24. Zhu L, Wang L, Ju F, Ran Y, Wang C, Zhang S. Transient global cerebral ischemia induces rapid and sustained reorganization of synaptic structures. Journal of Cerebral Blood Flow & Metabolism. 2017;37(8):2756-67.
25. Dvorak AV, Swift-LaPointe T, Vavasour IM, Lee LE, Abel S, Russell-Schulz B, et al. An atlas for human brain myelin content throughout the adult life span. Sci Rep. 2021;11(1):269.
26. Arshad M, Stanley JA, Raz N. Adult age differences in subcortical myelin content are consistent with protracted myelination and unrelated to diffusion tensor imaging indices. NeuroImage. 2016;143:26-39.
27. Fjell AM, Engvig A, Tamnes CK, Grydeland H, Walhovd KB, Westlye LT, et al. Life-Span Changes of the Human Brain White Matter: Diffusion Tensor Imaging (DTI) and Volumetry. Cerebral Cortex. 2009;20(9):2055-68.
28. Hagiwara A, Fujimoto K, Kamagata K, Murata S, Irie R, Kaga H, et al. Age-Related Changes in Relaxation Times, Proton Density, Myelin, and Tissue Volumes in Adult Brain Analyzed by 2-Dimensional Quantitative Synthetic Magnetic Resonance Imaging. Investigative radiology. 2021;56(3).
Figures