0278
Increased Pulsatility Index of Perforating Arteries as Novel 7T Marker in Sporadic Cerebral Small Vessel Disease – Results of ZOOM@SVDs Study.1Radiology, UMC Utrecht, Utrecht, Netherlands, 2Neurology and Neurosurgery, UMC Utrecht, Utrecht, Netherlands
Synopsis
We assessed blood-flow velocity measurements on 7T MRI as a potential disease marker for cerebral small vessel disease (SVD). Two-dimensional phase-contrast velocity measurements were performed in perforating arteries of the basal ganglia (BG) and white matter of the centrum semiovale (CSO) in patients with sporadic SVD and age- and sex-matched controls. Pulsatility index (PI) was significantly higher in the BG, in patients (0.45 [0.41–0.49] vs. 0.36 [0.30–0.41] in controls) (p=0.02). In the CSO, similar number of vessels, mean velocity, and PI were observed between patients and controls. BG pulsatility could be a potential marker for SVD.
Introduction
Cerebral small vessel diseases (SVDs) account for most hemorrhagic strokes, a quarter of the ischemic strokes and approximately 45% of dementia cases, alone or together with other neurodegenerative disorders1. In 70% of the people over 65, manifestations of SVDs can be found on brain MRI2. Despite the large health burden of SVDs, there is still no treatment for SVDs with a proven efficacy due to the limited understanding of the mechanisms behind SVDs.Current biomarkers of SVDs such as visible MRI manifestations (i.e. lacunes, white matter hyperintensities, enlarged perivascular spaces, microbleeds), microstructural changes to white matter measured with diffusion tensor imaging, or blood-based biomarkers are primarily reflective of irreversible SVDs-related damage to parenchymal tissue. SVDs impact small vessel function of pial and parenchymal arteries as observed in animal models3. New MRI techniques at 7T MRI allow for measuring the small vessel function in humans directly at the small vessels themselves4. These measures have potential as biomarkers for SVDs to give more insight in the disease mechanisms.
The ZOOM@SVDs5 study was a prospective observational cohort study part of the SVDs@target collaborative program. One of the aims of this study was to assess which aspects of small vessel function measured at 7T MRI are affected in patients with Cerebral Autosomal Dominant Arteriopathy with Subcortical Infarcts and Leukoencephalopathy (CADASIL), a monogenic form of SVD, and in patients with a sporadic form of SVD. Here we present the first results of small vessel blood-flow velocity and pulsatility measurements in patients with sporadic SVD and matched controls.
Methods
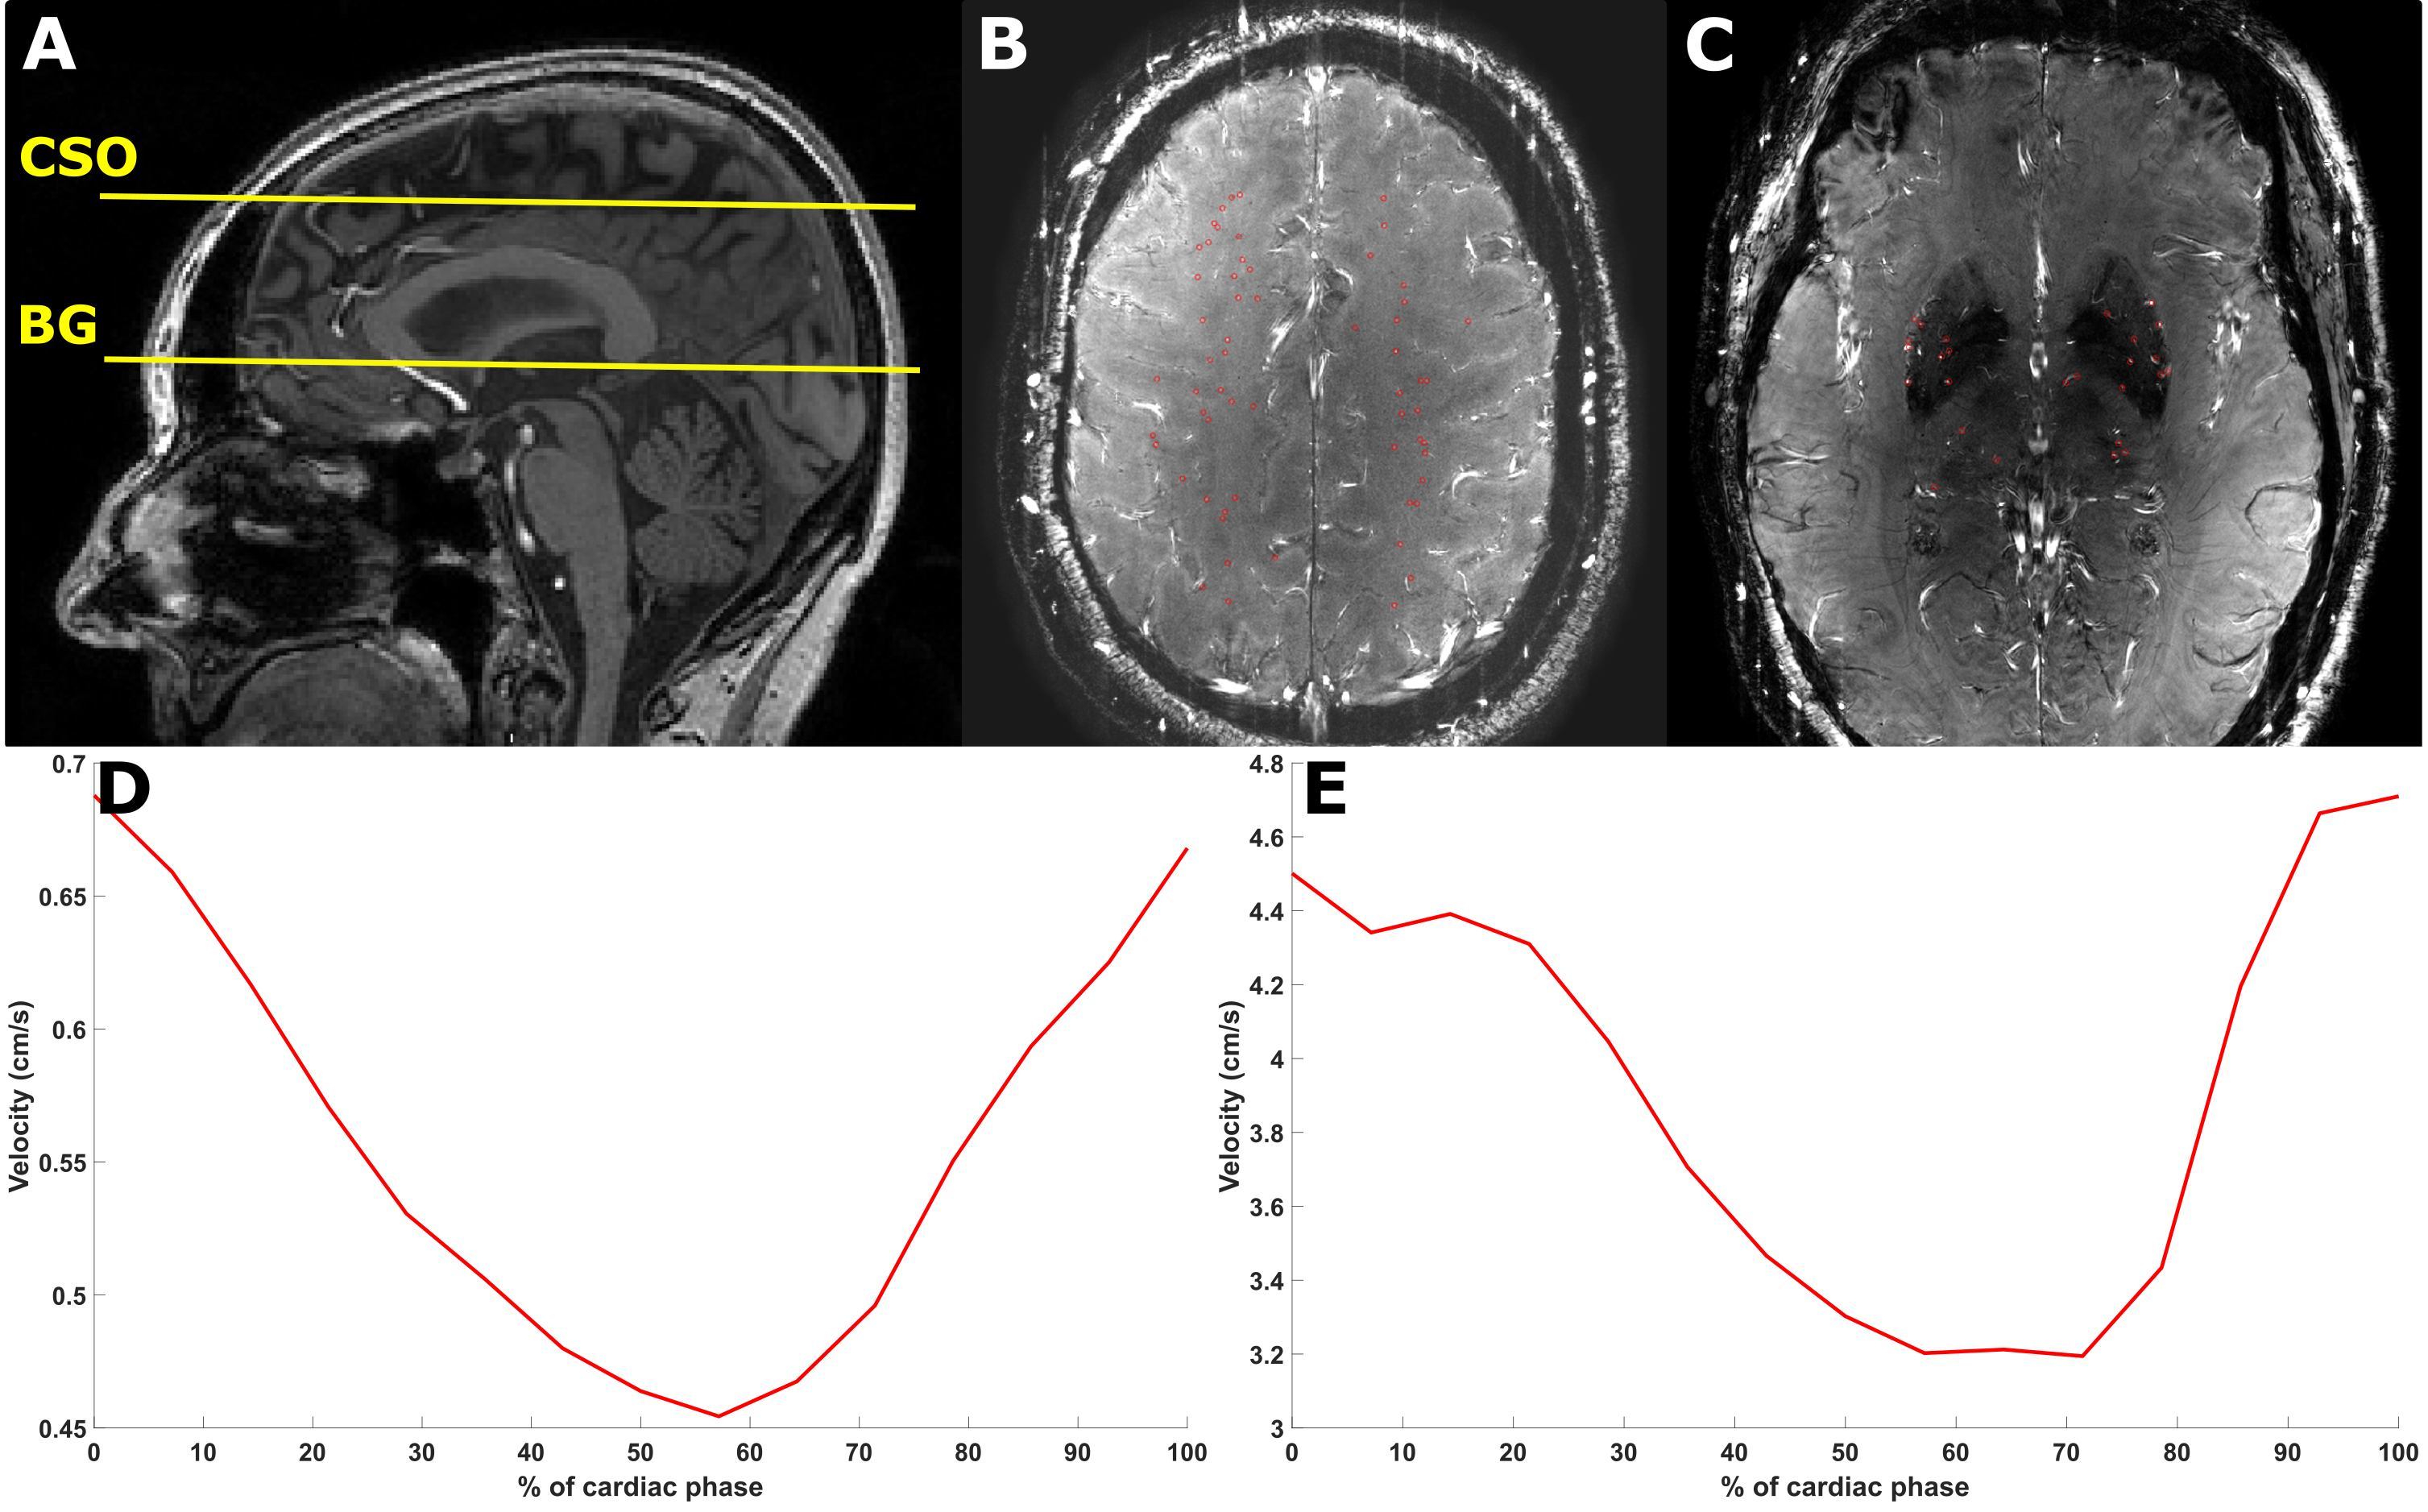
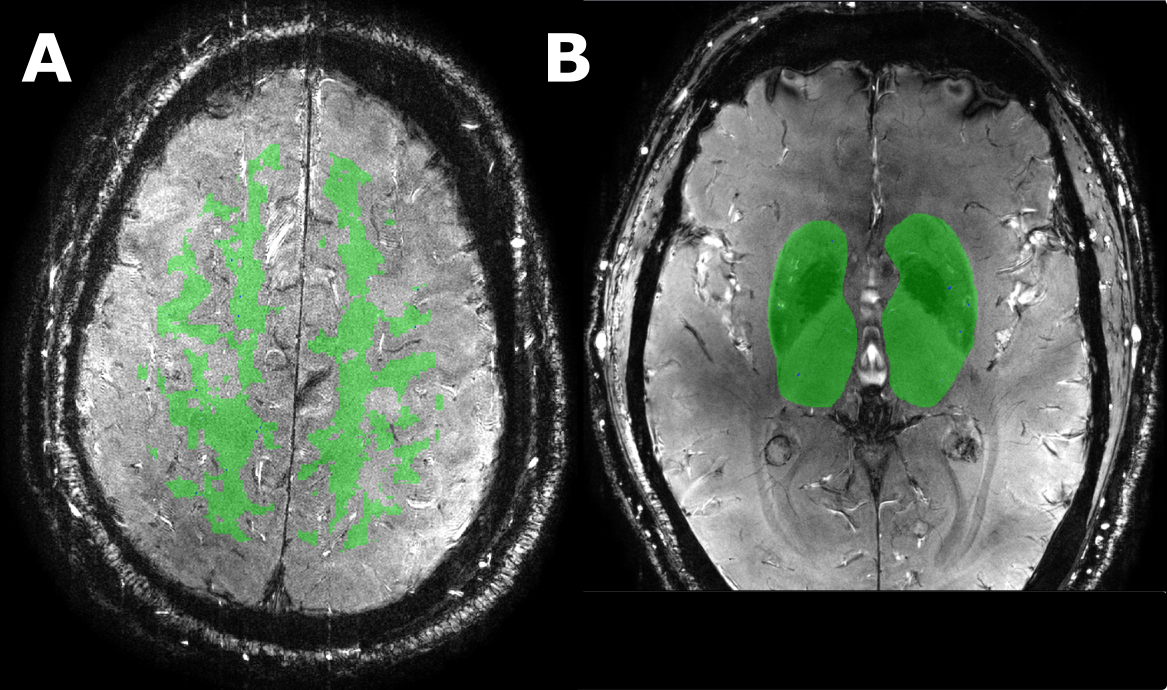
An overview of the ZOOM@SVDs study design has been published5. 46 patients with sporadic SVD and 22 matched healthy controls had successful 7T MRI brain scans. Subjects were scanned on a Philips 7T MRI with a 32-channel head coil. The blood-flow velocity measurements were performed in the small perforating arteries at the level of the centrum semiovale (CSO) and the basal ganglia (BG) using a two-dimensional phase contrast (2D-PC) MRI acquisition (Figure 1). The following scan parameters were used: field of view CSO: 230x230 mm2, BG: 170x170 mm2; reconstructed spatial resolution CSO/BG: 0.2x0.2x2.0 mm3; TR/TE CSO: 29/16 ms, BG: 28/15 ms; velocity encoding CSO: 4 cm/s, BG: 20 cm/s; acquired temporal resolution CSO/BG: 112 ms; 13 reconstructed heart phases, scan duration: 5 minutes for a heart rate of 60 bpm. The 2D-PC images were analyzed to assess the cerebral perforating artery density (Ndensity) (number of perforating arteries/cm2), mean blood-flow velocity (Vmean), and pulsatility index (PI). The PI was defined as $$PI = \frac{V_{max}-V_{min}}{V_{mean}}$$ where Vmax, Vmin, and Vmean, are the maximum, minimum, and mean of the normalized and averaged velocity trace over the cardiac cycle (Figure 1). Analysis of the 2D-PC images was performed as described previously6–8. The region of interest (ROI) in the CSO was segmented automatically for the total white matter (TWM) and normal appearing white matter (NAWM) (Figure 2). ROIs in the BG were drawn manually. All statistical analyses were corrected for age and comparison of PI was corrected for Vmean.Results
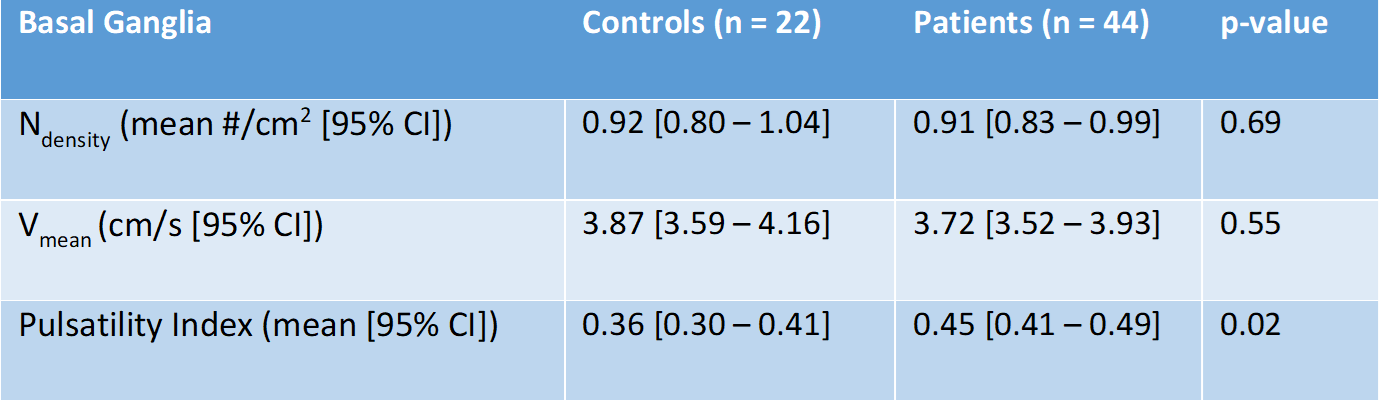
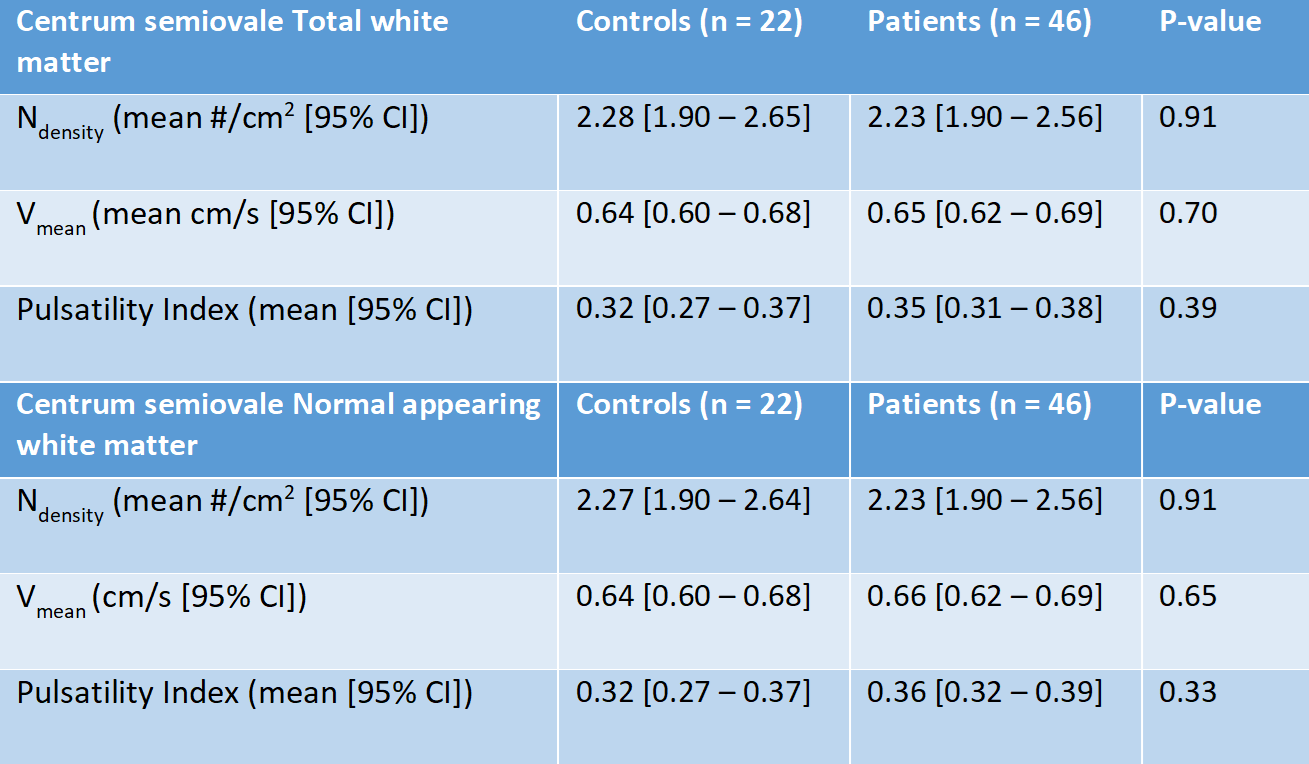
Controls were matched with patients based on age and sex. Mean age of the patients and controls were 63 and 65 years respectively. All controls had successful CSO and BG scans. 46 (100%) and 44 (96%) patients had successful CSO and BG scans respectively. In the BG we found similar Ndensity (mean difference: 0.01 vessels/cm2; p=0.69), lower Vmean (mean difference: 0.15 cm/s; p=0.55), and significantly higher PI (mean difference: 0.09; p=0.02), in patients when compared to controls (Table 1). In the CSO we found similar Ndensity, Vmean, and PI in the NAWM and TWM between patients and controls (Table 2).Discussion
Patients with sporadic SVD had a higher velocity pulsatility in the BG when compared to healthy matched controls. No differences in the CSO outcome measures between controls and patients were found. The increased velocity pulsatility index we found in the BG in sporadic SVD is also in accordance with previous results in lacunar stroke patients9 and with other findings of an increase pulsatility index in the internal carotid or middle cerebral arteries in cerebrovascular diseases10,11. The measurements in sporadic SVD are very comparable to the CADASIL patients in the ZOOM@SVDs cohort12. It is known that SVDs can manifest in small vessels as loss of smooth muscle cells, fibrinoid necrosis, narrowing of the lumen, and thickening of the vessel wall13, which could be parts of the mechanism behind the increased velocity pulsatility index. With these results we signify the potential for 2D-PC blood-flow velocity measurements to be a direct signature of the disease in the small perforating arteries. These disease markers could also potentially be associated with disease burden or progression. The strength of these markers is that they are a direct reflection of small vessel function rather than small vessel damage.Conclusion
The ZOOM@SVDs study showed the potential for 7T MRI 2D-PC blood-flow velocity measurements as small vessel function markers in monogenic and sporadic forms of SVD. The strength of these markers is that they are derived directly from the small vessels themselves, which could help contribute to unraveling the mechanisms behind SVDs.Acknowledgements
We want to thank all study participants for participating in the ZOOM@SVDs study. Furthermore, we want to thank all partners of the SVDs@target collaborative program for their efforts in the field of SVDs. ZOOM@SVDs is part of SVDs@target that has received funding from the European Union’s Horizon 2020 research and innovative program under grant agreement No. 666881. JCWS and SDTP are funded by the UMCU Brain Center Young Talent Fellowship 2019.References
1. Wardlaw JM, Smith C, Dichgans M. Small vessel disease: mechanisms and clinical implications. Lancet Neurol. 2019;18(7):684-696.
2. Debette S, Schilling S, Duperron M-G, et al. Clinical Significance of Magnetic Resonance Imaging Markers of Vascular Brain Injury: A Systematic Review and Meta-analysis. JAMA Neurol. 2019;76(1):81-94.
3. Dabertrand F, Krøigaard C, Bonev AD, et al. Potassium channelopathy-like defect underlies early-stage cerebrovascular dysfunction in a genetic model of small vessel disease. Proc Natl Acad Sci. 2015;112(7):E796-E805.
4. Zwanenburg JJM, Van Osch MJP. Targeting cerebral small vessel disease with MRI. Stroke. 2017;48(11):3175-3182.
5. van den Brink H, Kopczak A, Arts T, et al. Zooming in on cerebral small vessel function in small vessel diseases with 7T MRI: Rationale and design of the “ZOOM@SVDs” study. Cereb Circ - Cogn Behav. 2021;2:100013.
6. Geurts L, Biessels GJ, Luijten P, et al. Better and faster velocity pulsatility assessment in cerebral white matter perforating arteries with 7T quantitative flow MRI through improved slice profile, acquisition scheme, and postprocessing. Magn Reson Med. 2018;79(3):1473-1482.
7. Arts T, Meijs TA, Grotenhuis H, et al. Velocity and Pulsatility Measures in the Perforating Arteries of the Basal Ganglia at 3T MRI in Reference to 7T MRI. Front Neurosci. 2021;15:480.
8. Arts T, Siero JCW, Biessels GJ, et al. Automated Assessment of Cerebral Arterial Perforator Function on 7T MRI. J Magn Reson Imaging. 2021;53(1):234-241.
9. Geurts LJ, Zwanenburg JJM, Klijn CJM, et al. Higher Pulsatility in Cerebral Perforating Arteries in Patients with Small Vessel Disease Related Stroke, a 7T MRI Study. Stroke. 2019;50(1):62-68.
10. Shi Y, Thrippleton MJ, Blair GW, et al. Small vessel disease is associated with altered cerebrovascular pulsatility but not resting cerebral blood flow. J Cereb Blood Flow Metab. 2020;40(1):85-99.
11. Shi Y, Thrippleton MJ, Marshall I, Wardlaw JM. Intracranial pulsatility in patients with cerebral small vessel disease: a systematic review. Clin Sci. 2018;132(1):157-171. doi:10.1042/CS20171280
12. van den Brink H, Arts T, Kopczak A, et al. Novel 7T Markers of Small Vessel Function in CADASIL. Manuscript in preparation.
13. Pantoni L. Cerebral small vessel disease: from pathogenesis and clinical characteristics to therapeutic challenges. Lancet Neurol. 2010;9(7):689-701.
Figures