0277
Multifrequency MR elastography for time-resolved shear wave speed quantification of the in-vivo human heart.1Charité Universitätsmedizin Berlin, Berlin, Germany, 2Physikalisch-Technische Bundesanstalt(PTB), Braunschweig and Berlin, Berlin, Germany, 3Experimentaland Clinical Research Center (ECRC), DZHK partner site Berlin, Berlin, Germany, 4HELIOS Klinikum Berlin Buch, Berlin, Germany
Synopsis
Cardiac MR elastography (MRE) has the potential to noninvasively characterize the underlying pathophysiology in heart failure with preserved ejection fraction based on abnormal stiffness values. However, the need for synchronizing MRE with cardiac motion, breathing and harmonic vibrations continues to be a challenge. We have developed a single-shot, spin-echo cardiac MRE sequence, which continuously acquires wave images at multiple frequencies with retrospective gating of wave phases relative to the cardiac phase to cover the propagation of shear waves over the full cardiac cycle. Our preliminary data show the dispersion of myocardial stiffness over frequency in systole and diastole.
Introduction
During the cardiac cycle, the forces exerted by the heart muscle onto the ventricular lumen are proportional to the change in myocardial shear modulus1,2. Accordingly, luminal radial stresses generated by myocardial shear modulus explain the sensitivity of MR elastography (MRE) to ventricular pressure. Diastolic dysfunction is relevant in many cardiac diseases and is accompanied with abnormally altered ventricular pressure which could be detected noninvasively by MRE3,4,5. Furthermore, regional stiffening of the myocardium potentially detected by MRE might reveal fibrosis and scar e.g. in case of myocardial infarction6. The aim of this work was to develop MRE for time-resolved stiffness mapping of the myocardium in-vivo.Methods
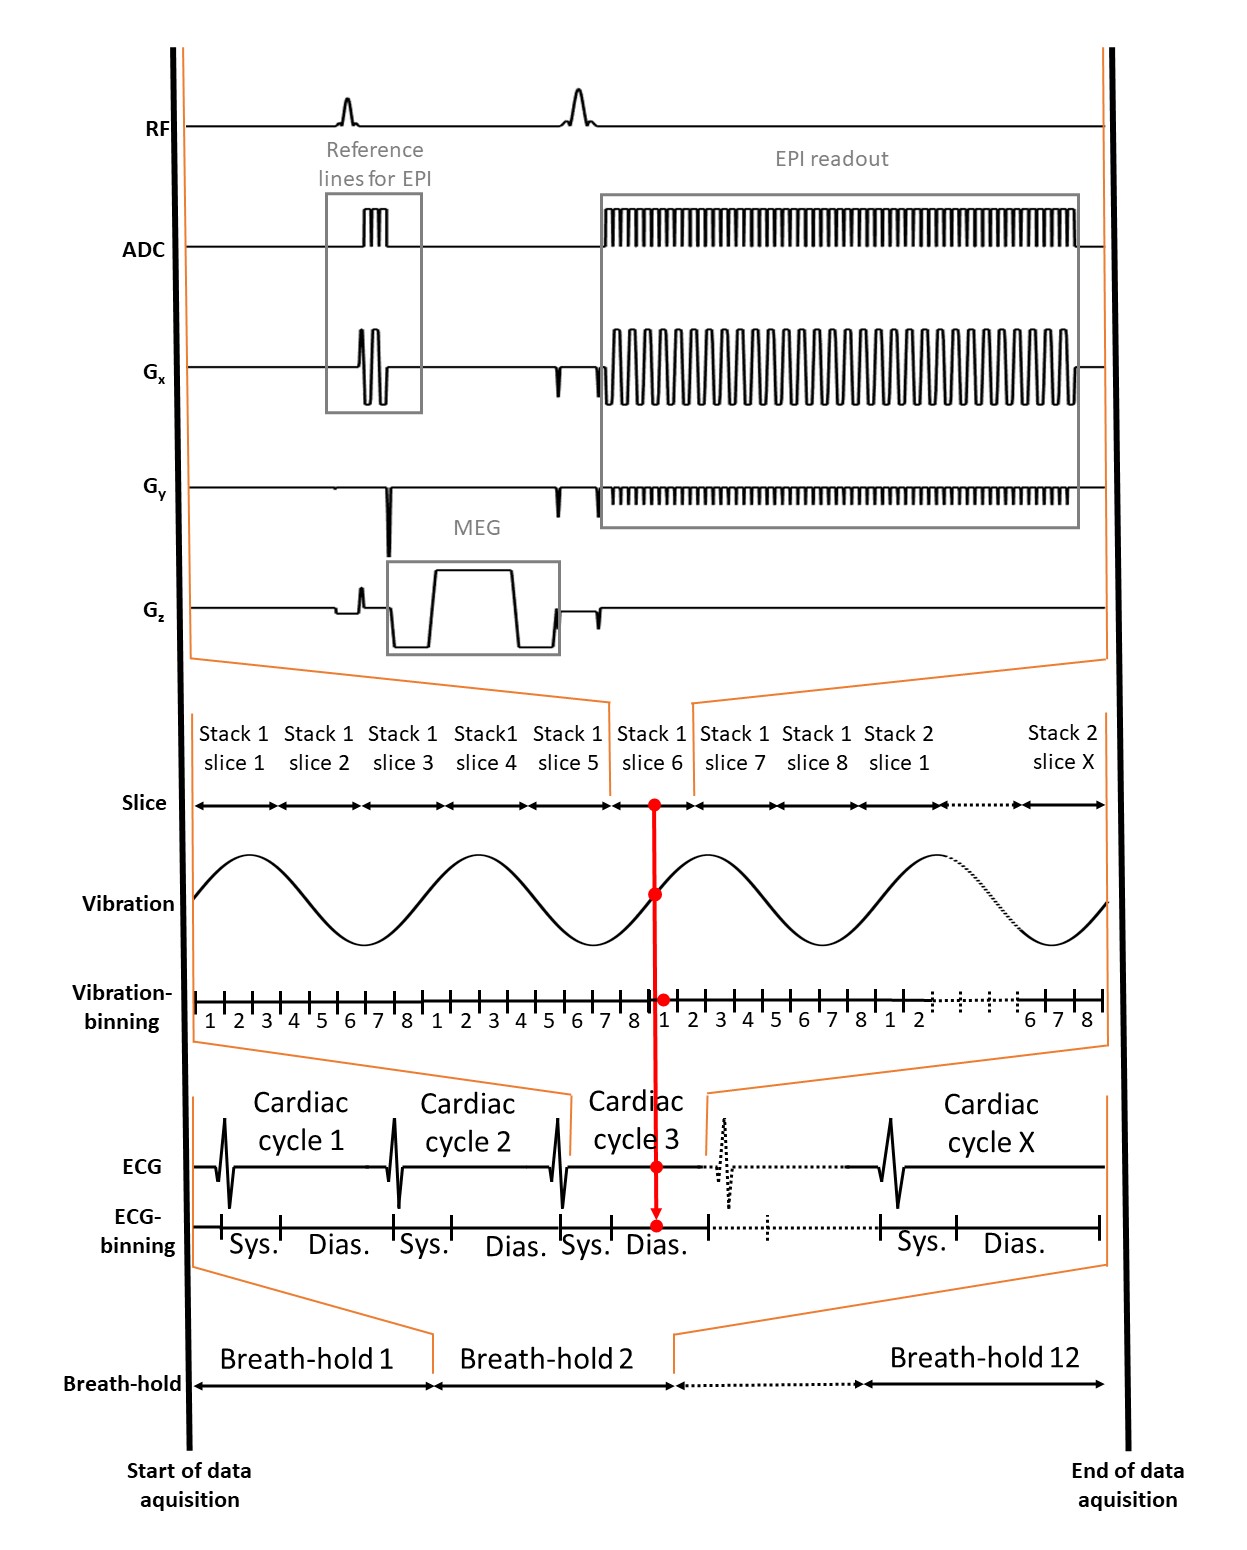
Five healthy volunteers (38±13years) were investigated. The setup of our cardiac MRE is shown in Figure 1. Four pneumatic actuators (two anterior, two posterior) were attached to the thorax of the subject with a Velcro belt. Compressed air pulses were fed into these actuators resulting in their periodic de- and inflation with controlled frequency. Experiments were run in a 3-Tesla Siemens MRI scanner (Magnetom Lumina) using a 12-channel receiver coil. Figure 2 shows the cardiac MRE sequence scheme. Data were acquired in a short-axis view with a single-shot, spin-echo EPI sequence during breath-holds in expiration of 26s (FOV 400×350mm², 2.5×2.5×6.0mm³ voxel size, TR=703ms, TE=42ms). Within a single breath-hold 30 stacks, each containing 8 image slices have been acquired, according to the principle of stroboscopic wave sampling7. The sequences logged the instances of motion encoding relative the R-wave as well as the wave phase for each wave image to facilitate retrospective gating. The experiment was then repeated for another motion encoding direction and frequency. In total, three wave components and four frequencies (50,60,70 and 80Hz) were acquired within seven minutes total acquisition time.The k-MDEV pipeline was used for the reconstruction of stiffness maps in terms of shear wave speed (in m/s). Before inversion, slices were reordered and binned into eight wave phases over a full vibration cycle in synchrony to the cardiac phase by considering systole and diastole. For both subgroups, all sampled data were used to create an artificially fully sampled shear wave by interpolating the mixed bins into eight instances over a wave cycle. This set of data was then processed by k-MDEV inversion8.
Results
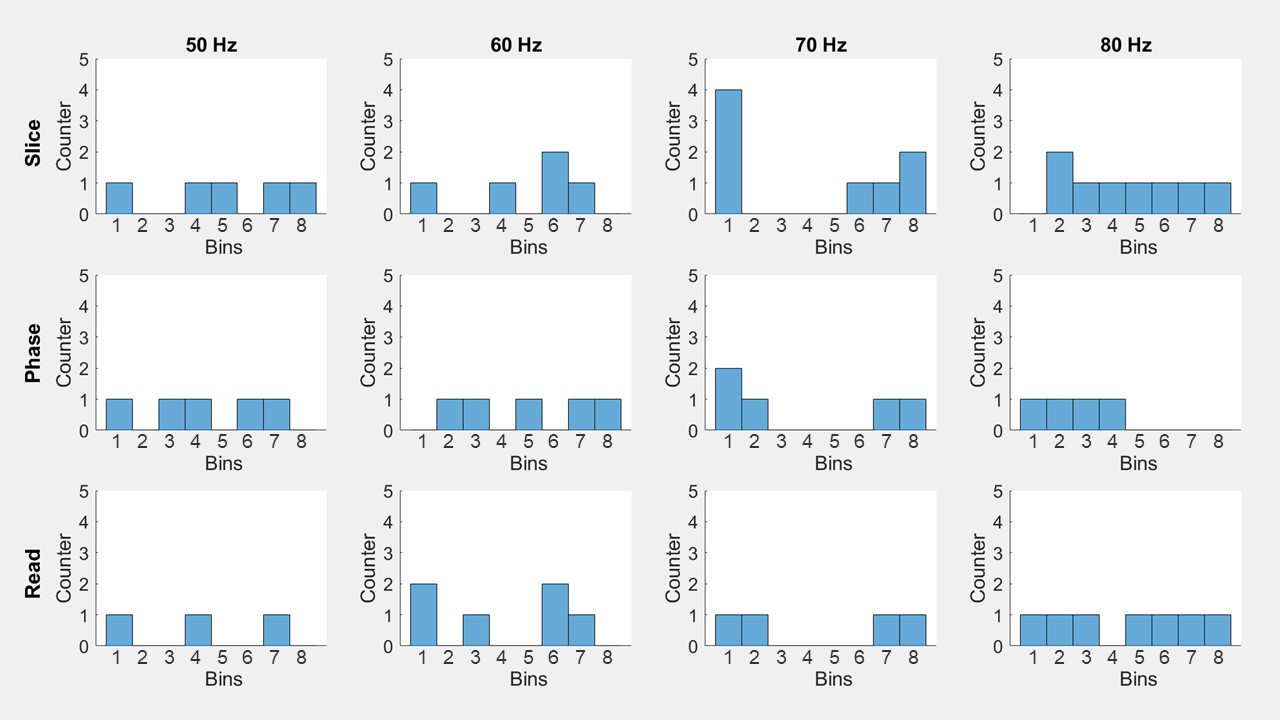
Figure 3 shows the temporal distribution of acquired data after binning over a wave period. Due to the longer duration, more data points were obtained for diastole than for systole. Bins containing more than one wave image were further processed by averaging the phase data of that bin. Empty bins were filled by interpolation of wave data from the other bins.Figure 4 shows a representative stiffness map (SWS) from the center of the slice block, in systole (a) and diastole (b). In systole, the myocardium had a mean SWS of 2.59±0.2m/s, with wall thickness of 11.6±0.8mm and left ventricular diameter of 52.1±0.7mm. In diastole, mean SWS was 2.31±0.16m/s, wall thickness 9.5±0.5mm, and ventricular diameter 55.8±0.9mm.
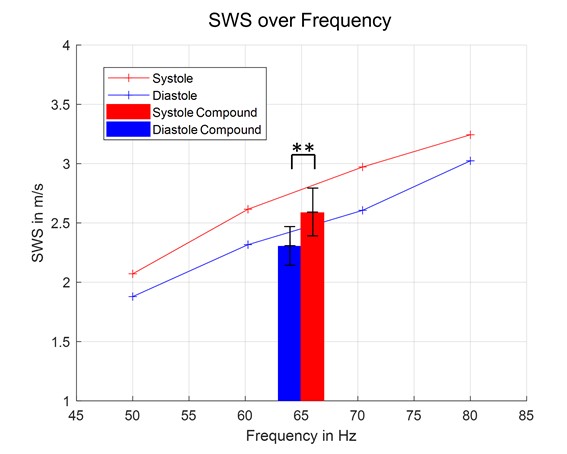
The dispersion curve, averaged over our cohort, is shown in Figure 5, showing that for all measured frequencies SWS was higher in systole than diastole. The mean values of the frequency-combined SWS maps showed the same effect, which was significant (p<0.01).
Discussion
This work presents preliminary data on cardiac MRE using stroboscopic sampling by single-shot, spin-echo EPI. The advantage of our method above existing approaches is the time efficient sampling scheme of continuous shear vibrations, incorporating retrospective gating to resolve cardiac motion. Our method allows continuous acquisition of wave images, including different wave components and frequencies, which can be used for stabilizing wave inversion. Recording the encoding time of wave phases relative to the R-wave with the raw data ensures that every wave image can be assigned to a heart phase retrospectively. Higher temporal resolutions are possible if more data is acquired. This would exceed the breath-hold capabilities of most subjects, but could be overcome by tracking also breathing motion and do the binning or interpolation for this dimension as well. Furthermore, it remains to be determined if multiple frequencies provide more information than running the MRE experiment at a single frequency but over longer time providing higher temporal resolution. Our study is a starting point towards high-resolution, time-resolved cardiac MRE, which is expected to benefit from motion-insensitive readout schemes such as spiral MRE. Nonetheless, the presented data are encouraging since the dispersion of SWS over frequency has been resolved for in-vivo myocardial tissue for the first time. The observation of higher stiffness values in systole than diastole agrees with previous results9,10 but needs further validation with regard to absolute values. More subjects need to be scanned to increase the statistical power.Conclusion
This work presents time-resolved SWS maps of the in-vivo human heart using multifrequency MRE. Higher SWS values were obtained in systole than diastole over the full range of frequencies used in this study. Further improvement is necessary with regard to data acquisition. In particular, continuous data acquisition without breath-holding would allow increasing the density of data towards better temporal resolution and improve patient tolerance. Then, our method has the potential to advance cardiac MRE into clinical applications.Acknowledgements
The authors
gratefully acknowledge funding from the German Research Foundation (GRK2260,
BIOQIC).
References
1 Hirsch, S., Braun, J., & Sack, I. (2017). Magnetic resonance elastography: physical background and medical applications. John Wiley & Sons.
2 Elgeti, T., Rump, J., Hamhaber, U., Papazoglou, S., Hamm, B., Braun, J. & Sack, I. (2008). Cardiac magnetic resonance elastography: initial results. Investigative radiology, 43(11), 762-772.
3 Mazumder, R., Schroeder, S., Clymer, B.D. et al. (2016). Quantification of myocardial stiffness in heart failure with preserved ejection fraction porcine model using magnetic resonance elastography. J Cardiovasc Magn Reson, 18, P29.
4 Elgeti, T., Knebel, F., Hattasch, R., Hamm, B., Braun, J. & Sack, I. (2014). Shear-wave Amplitudes Measured with Cardiac MR Elastography for Diagnosis of Diastolic Dysfunction. Radiology, 271, 681-687.
5 Arani, A., Arunachalam, S. P., Chang, I. C., Baffour, F., Rossman, P. J., Glaser, K. J., & Araoz, P. A. (2017). Cardiac MR elastography for quantitative assessment of elevated myocardial stiffness in cardiac amyloidosis. Journal of Magnetic Resonance Imaging, 46(5), 1361-1367.
6 Finn JP, Nael K, Deshpande V, Ratib O, Laub G. (2006). Cardiac MR imaging: state of the technology. Radiology, 241(2):338-54.
7 Schrank, F., Warmuth, C., Tzschatzsch, H., Kreft, B., Hirsch, S., Braun, J. & Sack, I. (2020). Cardiac-gated steady-state multifrequency magnetic resonance elastography of the brain: Effect of cerebral arterial pulsation on brain viscoelasticity. Journal of Cerebral Blood Flow & Metabolism, 40(5), 991-1001.
8 Tzschatzsch, H., Guo, J., Dittmann, F., Hirsch, S., Barnhill, E., Johrens, K., Braun, J. & Sack, I. (2016). Tomoelastography by multifrequency wave number recovery from time-harmonic propagating shear waves. Med Image Anal, 30, 1-10.
9 Urban, M. W., Pislaru, C., Nenadic, I. Z., Kinnick, R. R., & Greenleaf, J. F. (2012). Measurement of viscoelastic properties of in vivo swine myocardium using lamb wave dispersion ultrasound vibrometry (LDUV). IEEE transactions on medical imaging, 32(2), 247-261.
10 Pislaru, C., Urban, M. W., Pislaru, S. V., Kinnick, R. R., & Greenleaf, J. F. (2014). Viscoelastic properties of normal and infarcted myocardium measured by a multifrequency shear wave method: comparison with pressure-segment length method. Ultrasound in medicine & biology, 40(8), 1785-1795.
Figures

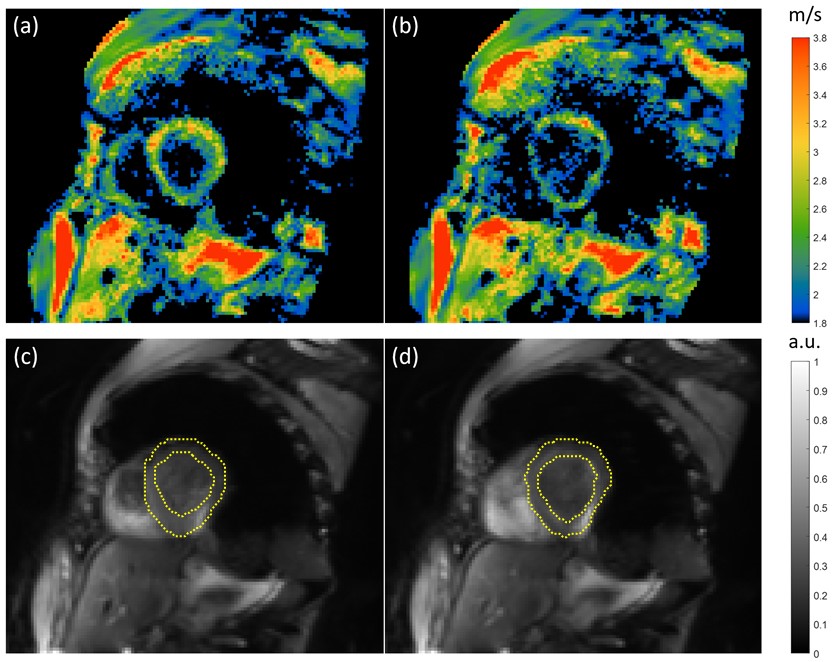
Representative SWS maps (2.5x2.5x6mm3 voxel size) of one slice in the short axis view of the human heart in systole (a) and diastole (b) and corresponding anatomical images (c) and (d) respectively. In (c) and (d), the myocardium surrounding the left ventricle is highlighted in yellow. Parameters quantified in systole of the myocardium are a mean SWS of 2.59±0.2m/s, a wall thickness of 11.6±0.8mm and left ventricular diameter of 52.1±0.7mm. In the diastole the parameters change to a mean SWS of 2.31±0.16 m/s, a wall thickness of 9.5±0.5mm, and ventricular diameter of 55.8±0.9mm.