0275
Synthetic Multi-Contrast Late Gadolinium Enhancement Using Post-Contrast Cardiac MR Fingerprinting
Imran Rashid1,2, Varun Rajagopalan1,2, Sadeer Al-Kindi1,2, Sanjay Rajagopalan1,2, Nicole Seiberlich3,4, and Jesse Ian Hamilton3,4
1Cardiology, University Hospitals Cleveland Medical Center, Cleveland, OH, United States, 2Medicine, Case Western Reserve University, Cleveland, OH, United States, 3Radiology, University of Michigan, Ann Arbor, MI, United States, 4Biomedical Engineering, University of Michigan, Ann Arbor, MI, United States
1Cardiology, University Hospitals Cleveland Medical Center, Cleveland, OH, United States, 2Medicine, Case Western Reserve University, Cleveland, OH, United States, 3Radiology, University of Michigan, Ann Arbor, MI, United States, 4Biomedical Engineering, University of Michigan, Ann Arbor, MI, United States
Synopsis
A technique is introduced using post-contrast cardiac Magnetic Resonance Fingerprinting (MRF) T1 and T2 maps to calculate synthetic late gadolinium enhancement (LGE) images with multiple contrast weightings, including bright-blood magnitude inversion recovery images, dark-blood T2-prepared inversion recovery images, and a novel contrast weighting (optimized for each patient) designed to improve differentiation among viable myocardium, blood, and scar based on measured T1 and T2 values. Initial results are presented in fifteen patients with ischemic cardiomyopathy scanned at 1.5T using conventional LGE and MRF-derived multi-contrast LGE images.
Introduction
Image quality in late gadolinium enhancement (LGE) MRI is operator-dependent, with suboptimal TI selection leading to poor nulling of viable myocardium and lower sensitivity for scar1–4. Synthetic LGE images can be calculated from post-contrast MOLLI T1 maps having comparable accuracy as conventional LGE for scar detection5. However, synthetic LGE has thus far been limited to bright-blood imaging, where it can be difficult to identify subendocardial scar, although dark-blood sequences can improve the differentiation between blood and scar6,7. In this work, a synthetic multi-contrast LGE technique is introduced that uses post-contrast Magnetic Resonance Fingerprinting (MRF)8 T1 and T2 maps to generate synthetic images with multiple contrast weightings, including bright-blood, dark-blood, and optimized patient-specific contrasts.Methods
Data were acquired in fifteen ischemic cardiomyopathy patients at 1.5T (Aera, Siemens Healthineers). Conventional magnitude LGE scans (IR-bSSFP, 1.4x1.4x8 mm3) were performed 10 minutes after injection of gadolinium contrast following a TI scout. Data were also acquired at a mid-ventricular slice using 2D cardiac MRF (15-heartbeat breathhold, 1.6x1.6x8mm3, golden angle spiral sampling)9,10. MRF data were reconstructed using a low-rank method with cardiac motion correction11, where images acquired during a 254ms diastolic acquisition window were binned into 4 phases, non-rigidly registered to the end-diastolic phase, and matched to a dictionary to obtain T1 and T2 maps.Multi-contrast LGE images were generated from MRF maps using Bloch equation simulations (Figure 1). For each patient, personalized scan parameters were selected using T1 and T2 values measured in blood, viable myocardium, and scar. Four types of images were generated. (1) MagIR: Magnitude bright-blood images were generated using the T1 map to simulate an inversion recovery sequence (Figure 2a), with automated TI selection to null viable myocardium. (2,3) Dark-Blood/Gray-Blood T2IR: Dark-blood images were generated using T1 and T2 maps to simulate a T2-prepared inversion recovery sequence (Figure 2b). A tunable parameter δ controlled the amount of blood suppression6, with δ<0 causing blood to have lower signal than viable myocardium (dark-blood T2IR), and vice versa for δ>0 (gray-blood T2IR). The TI and T2 prep were selected that maximized the quantity $$|M_z^{myo}-M_z^{scar}|+|M_z^{blood}-M_z^{scar}|$$ subject to the following constraint, where Mz denotes longitudinal magnetization and ε was set to 0.001. $$M_z^{blood}-M_z^{myo}-\delta<\epsilon$$ (4) Optimized: A novel optimized contrast weighting was developed to improve differentiation among blood, viable myocardium, and scar using both T1 and T2 maps (Figure 2c). A sequence of n variable RF excitations and TRs was optimized (this study uses n=5) that minimized the following: $$-A-B-C+D$$ where $$A=|M_z^{scar}-M_z^{myo}|$$ $$B=|M_z^{scar}-M_z^{blood}|$$ $$C=|M_z^{myo}-M_z^{blood}|$$ $$D=|A-B|+|B-C|+|C-A|$$This cost function was designed to produce a large and equal separation among the three tissues. An additional constraint ensured scar and viable myocardium had the highest and lowest signal intensities, respectively. Post-contrast T1 and T2 values were measured in viable myocardium, blood, and (if applicable) scar for all patients. Using Bloch simulations, the absolute difference in longitudinal magnetization between blood, viable myocardium, and scar was calculated for each synthetic contrast. One blinded cardiologist reader rated conventional and synthetic multi-contrast LGE images on a 5-point Likert scale for overall diagnostic confidence. The same reader identified the presence of scar, and sensitivity was calculated on a per-image basis.
Results
Post-contrast relaxation times averaged over all patients were: viable myocardium T1 295±35ms, T2 37±6ms; blood T1 187±32ms, T2 66±7ms; scar T1 187±26ms, T2 40±7ms. Examples of reference and synthetic multi-contrast LGE images in four patients are shown in Figure 3. Figure 4 shows one example where residual cardiac motion during the long ~250ms acquisition window resulted in a bright blood pool artifact on the synthetic images, which was resolved after including motion-correction in the MRF reconstruction. Differences in signal intensities between tissues for each synthetic contrast, derived using Bloch simulations, are shown in Figure 5a. Synthetic MagIR images had excellent blood/myocardium contrast but poor blood/scar contrast; dark-blood and gray-blood T2IR had excellent blood/scar contrast but poor blood/myocardium contrast; while the optimized method achieved a balance of good contrast among all tissues. MagIR and optimized images received equivalent ratings (Figure 4b) compared to reference images, while T2IR images received significantly lower ratings. Scar was identified for 13/15 patients using reference LGE. Of these patients, the sensitivity for scar using each synthetic contrast was 0.77 (10/13) MagIR, 0.62 (8/13) dark-blood T2IR, 0.69 (9/13) gray-blood T2IR, and 0.92 (12/13) optimized contrast. Reference LGE failed to identify subendocardial anteroseptal scar that was correctly identified with synthetic optimized contrast for one patient.Discussion
A method was introduced that uses post-contrast MRF maps to derive synthetic LGE images with multiple contrast weightings. In addition to bright-blood and dark-blood contrasts, a novel contrast mechanism was proposed using sequence parameters that are optimized on a per-patient basis to enhance contrast between specific tissues. Synthetic multi-contrast LGE has the potential to reduce operator dependence on image quality by selecting imaging settings based on quantitative T1 and T2 measurements. This approach could streamline cardiac MRI exams by yielding post-contrast maps and multi-contrast LGE images from one acquisition. Future work will evaluate this technique in prospective cohorts and non-ischemic cardiomyopathy patients.Conclusion
Post-contrast MRF T1 and T2 maps can be used to derive synthetic LGE images with multiple contrast weightings, including bright-blood, dark-blood, and patient-specific optimized contrasts.Acknowledgements
NSF/CBET 1553441; NIH/NHLBI R01HL094557; Siemens HealthineersReferences
- Kim RJ, Chen EL, Lima JA, Judd RM. Myocardial Gd-DTPA kinetics determine MRI contrast enhancement and reflect the extent and severity of myocardial injury after acute reperfused infarction. Circulation. 1996;94(12):3318-3326.
- Simonetti OP, Kim RJ, Fieno DS, et al. An improved MR imaging technique for the visualization of myocardial infarction. Radiology. 2001;218(1):215-223.
- Kellman P, Arai AE, McVeigh ER, Aletras AH. Phase-sensitive inversion recovery for detecting myocardial infarction using gadolinium-delayed hyperenhancement. Magn Reson Med. 2002;47(2):372-383.
- Kim RJ, Shah DJ, Judd RM. How we perform delayed enhancement imaging. J Cardiovasc Magn Reson. 2003;5(3):505-514.
- Varga-Szemes A, van der Geest RJ, Spottiswoode BS, et al. Myocardial Late Gadolinium Enhancement: Accuracy of T1 Mapping-based Synthetic Inversion-Recovery Imaging. Radiology. 2016;278(2):374-382.
- Kellman P, Xue H, Olivieri LJ, et al. Dark blood late enhancement imaging. J Cardiovasc Magn Reson. 2016;18(1):77.
- Basha T, Roujol S, Kissinger K V, Goddu B, Manning WJ, Nezafat R. Black blood late gadolinium enhancement using combined T2 magnetization preparation and inversion recovery. Journal of Cardiovascular Magnetic Resonance. Vol 17; 2015:O14.
- Ma D, Gulani V, Seiberlich N, et al. Magnetic resonance fingerprinting. Nature. 2013;495(7440):187-192.
- Hamilton JI, Jiang Y, Chen Y, et al. MR fingerprinting for rapid quantification of myocardial T1, T2, and proton spin density. Magn Reson Med. 2017;77(4):1446-1458.
- Hamilton JI, Pahwa S, Adedigba J, et al. Simultaneous Mapping of T1 and T2 Using Cardiac Magnetic Resonance Fingerprinting in a Cohort of Healthy Subjects at 1.5T. J Magn Reson Imaging. 2020;52(4):1044-1052.
- Cruz G, Qi H, Jaubert O, et al. Generalized low-rank nonrigid motion-corrected reconstruction for MR fingerprinting. Magn Reson Med. Early View. October 2021. doi: 10.1002/mrm.29027.
Figures

Figure 1: Post-contrast T1 and T2 maps are acquired simultaneously using cardiac MRF. Bloch equation simulations are performed using the maps to generate synthetic LGE images with multiple contrast weighting, including a magnitude inversion recovery (MagIR) bright-blood image, two T2-prepared inversion recovery (T2IR) images with dark-blood and gray-blood contrast, and an image with a novel contrast weighting that is numerically optimized to separate signal intensities among blood, viable myocardium, and scar.
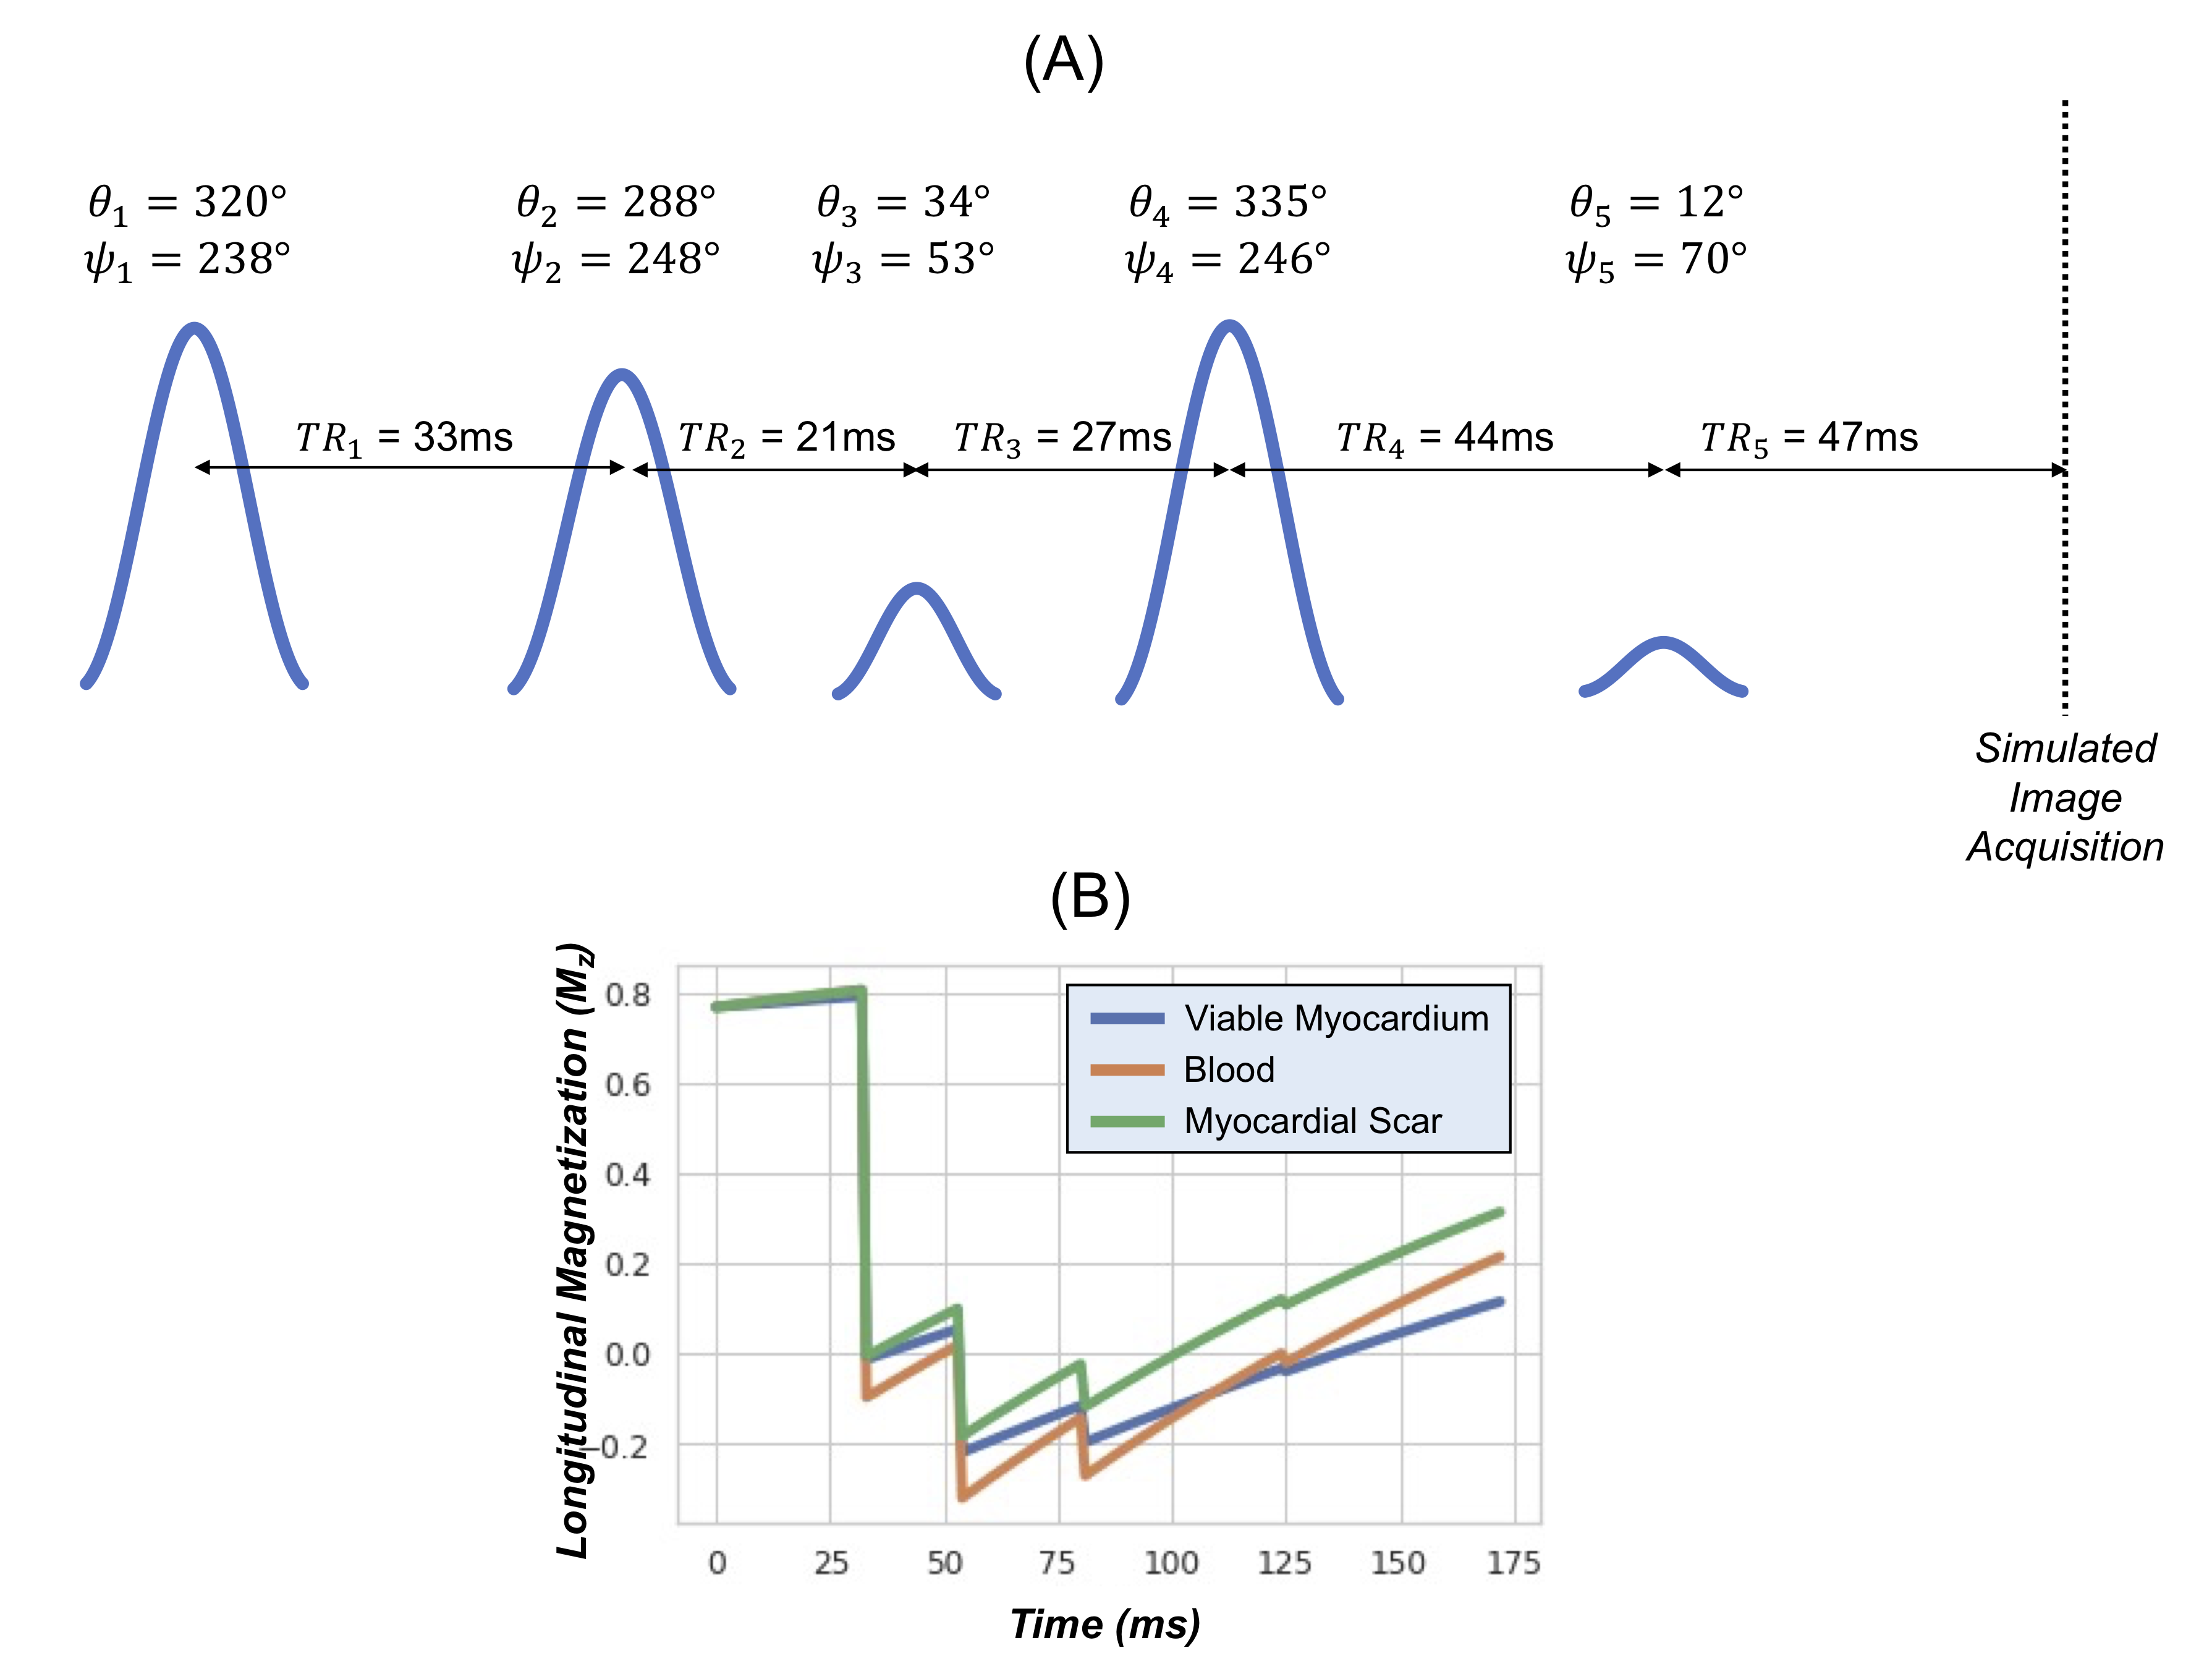
Figure 2: (a) An example is shown of a patient-specific “optimized contrast” LGE sequence, with optimized TRs, flip angles θ, and RF phase φ designed to achieve a large and equal separation in longitudinal magnetization among viable myocardium, blood, and scar based on T1 and T2 values measured with MRF. (b) Plots of the longitudinal magnetization using a Bloch equation simulation; the synthetic image acquisition is simulated to occur instantaneously at the end of the sequence.
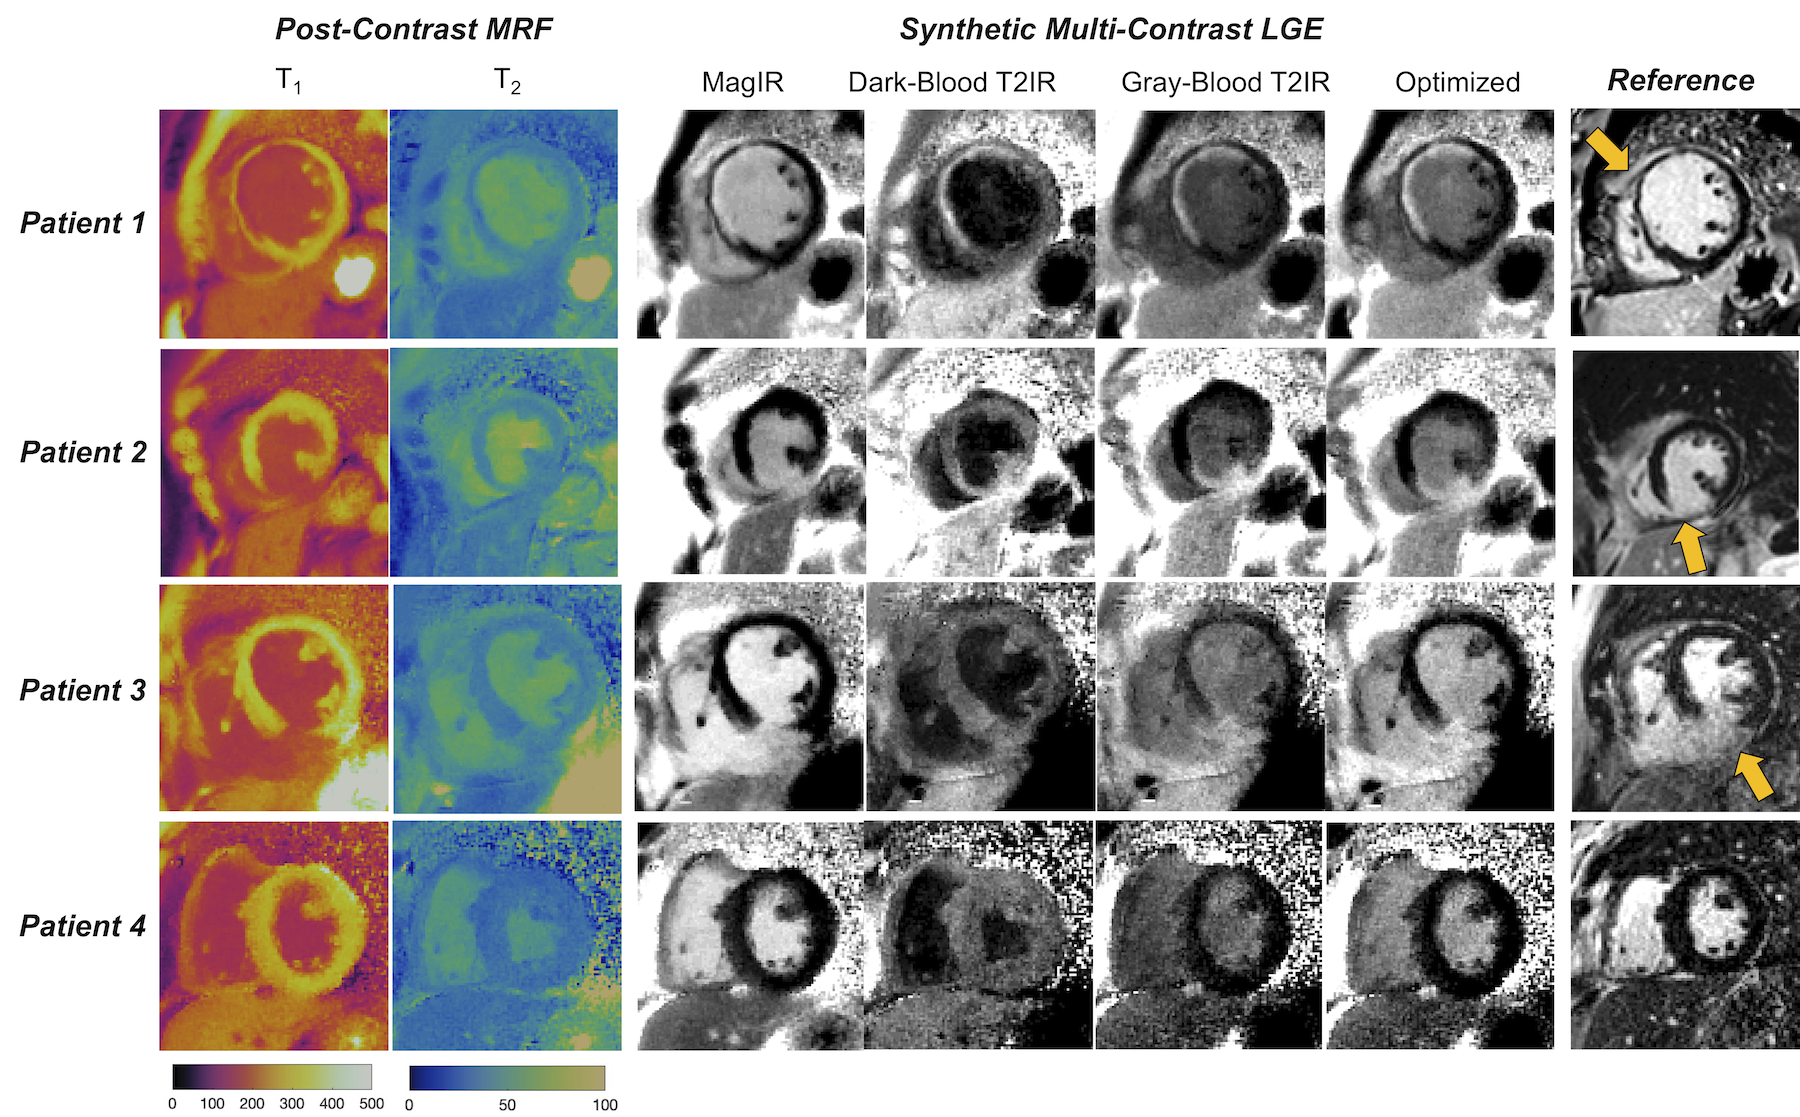
Figure 3: Representative images from four patients showing (left panel) post-contrast MRF T1 and T2 maps, (middle panel) synthetic multi-contrast LGE images derived from the MRF maps, and reference LGE images. Arrows on the reference LGE images indicate myocardial scar; patient 4 is included as an example with negative LGE findings on both reference and synthetic images.
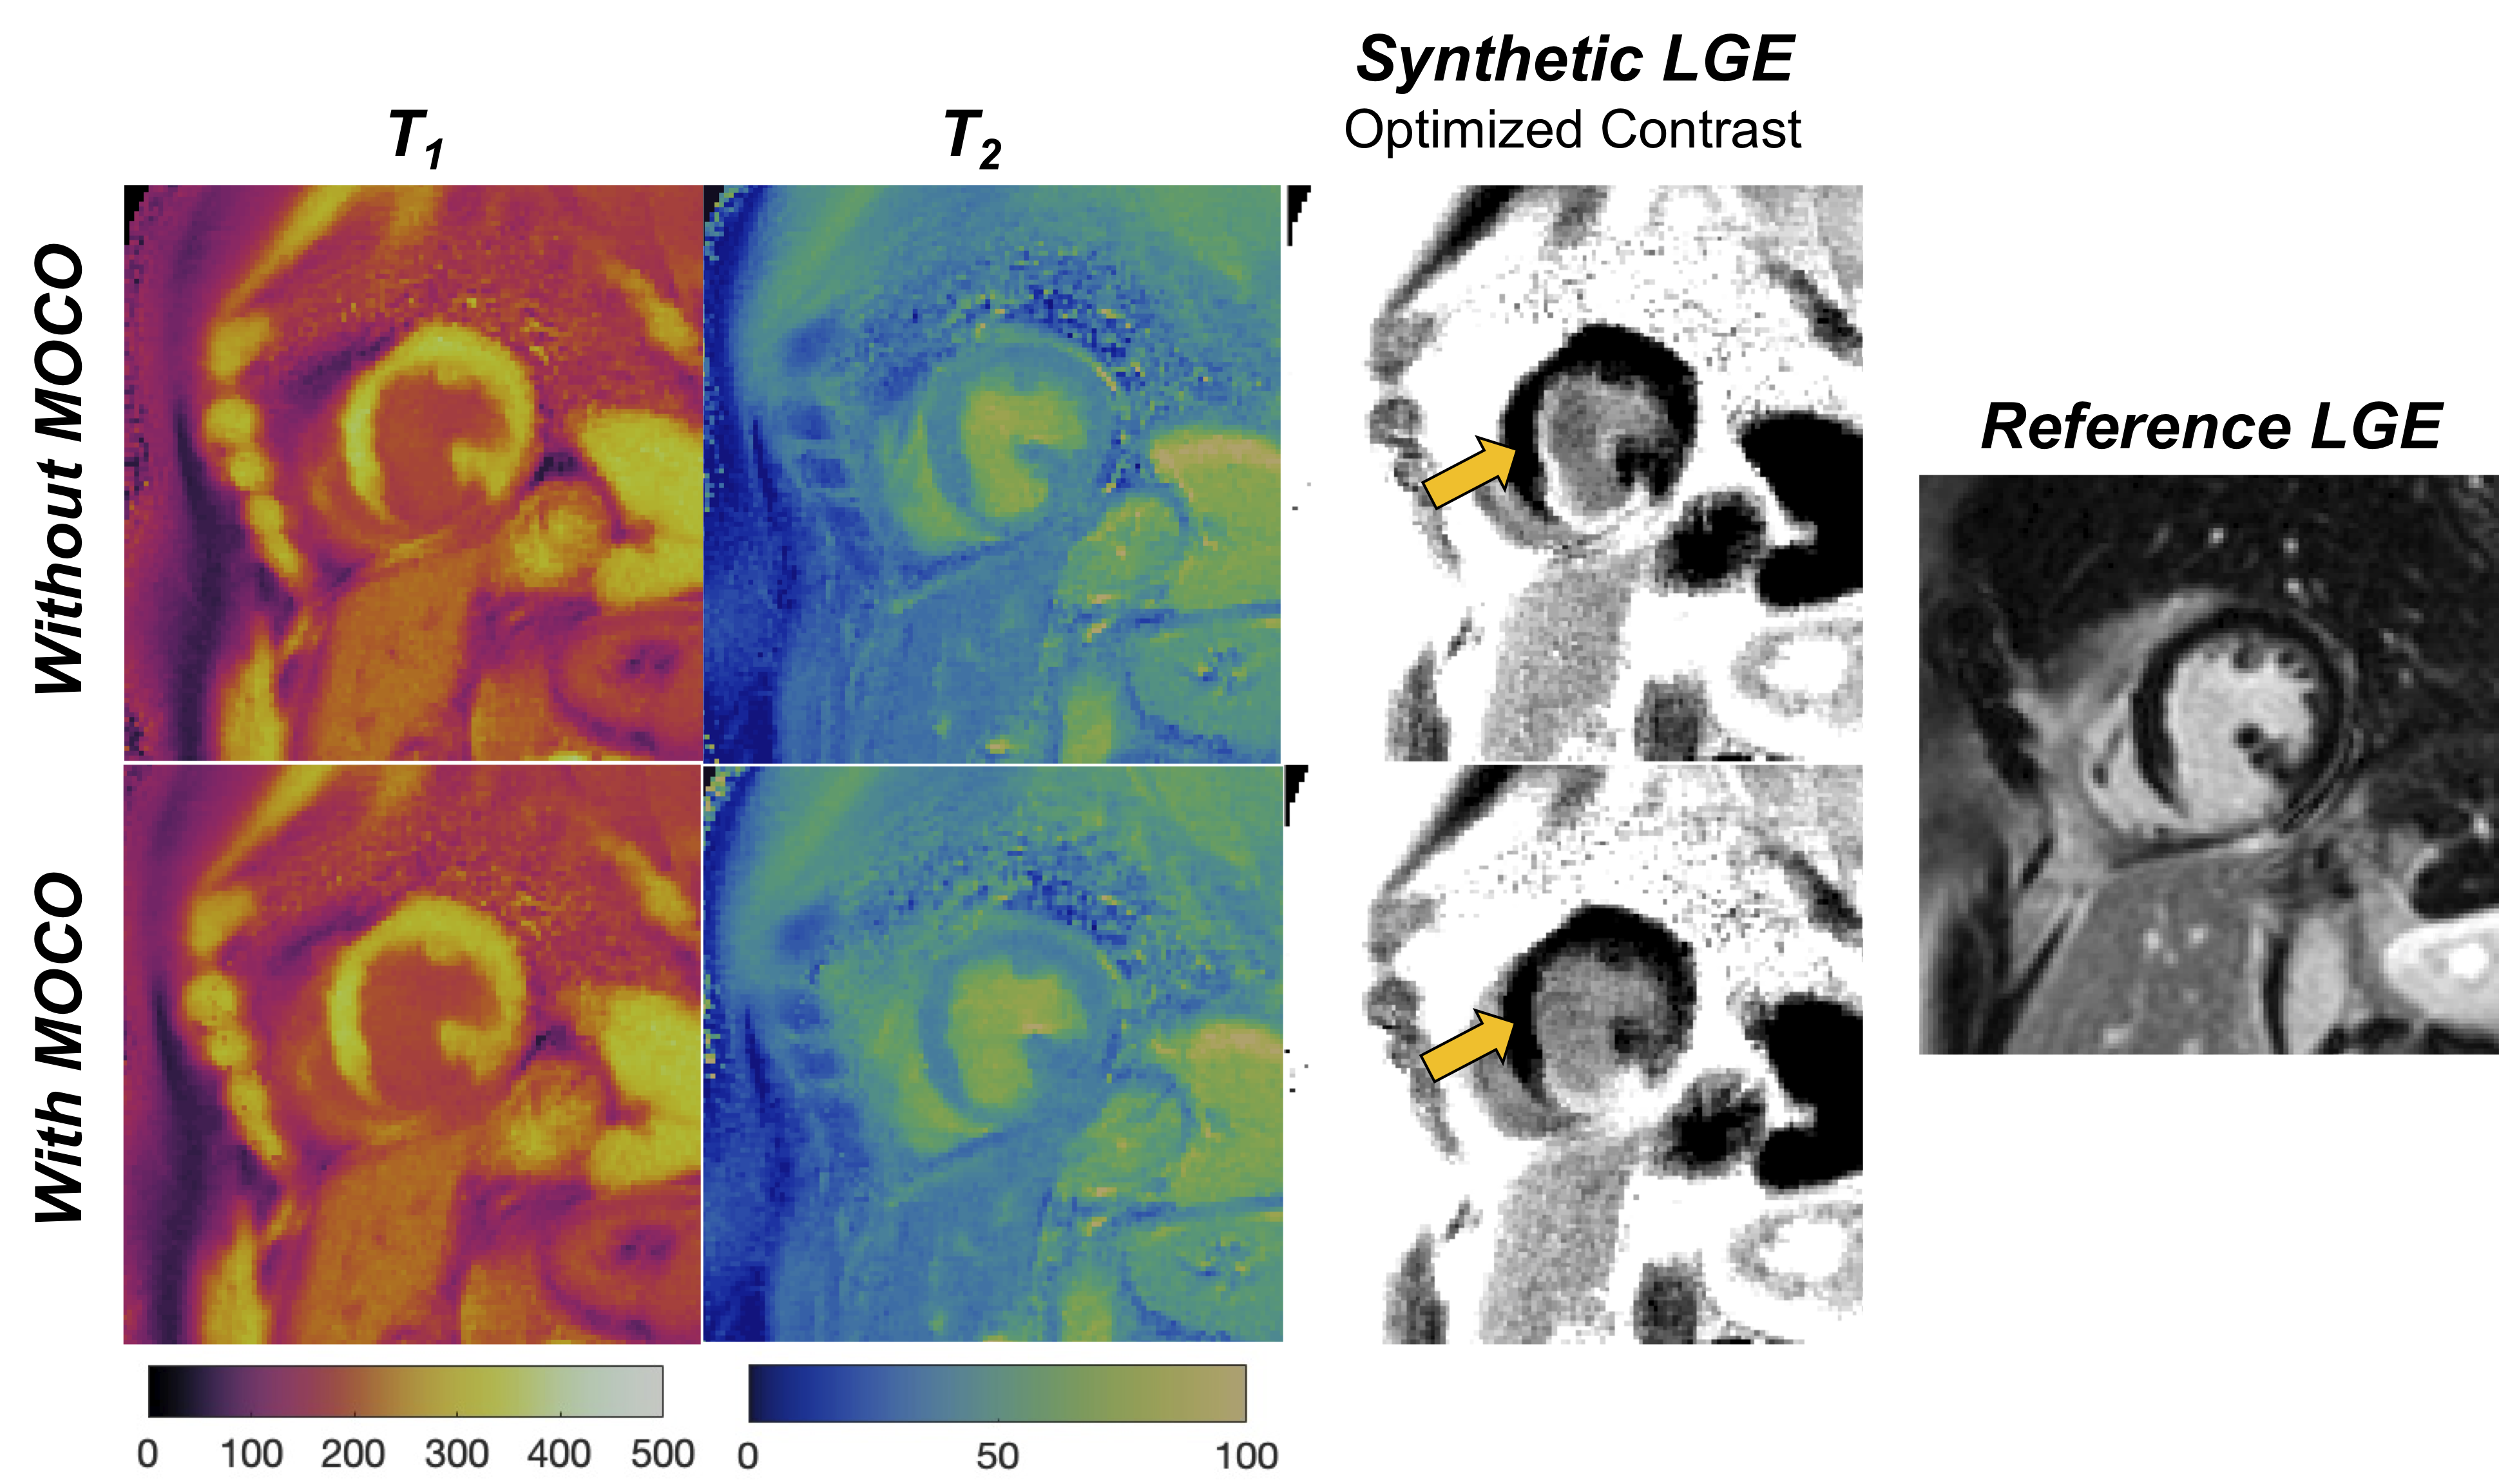
Figure 4: Post-contrast MRF T1 and T2 maps and synthetic LGE images with optimized contrast weighting are shown with and without including non-rigid cardiac motion correction in the low-rank MRF reconstruction. In this patient, residual cardiac motion during the long ~254ms acquisition window resulted in a slight misregistration between the T1 and T2 maps (since different parts of the MRF sequence are more sensitive to either T1 or T2), resulting in a bright artifact on the synthetic image at the subendocardial border that is reduced after motion correction.
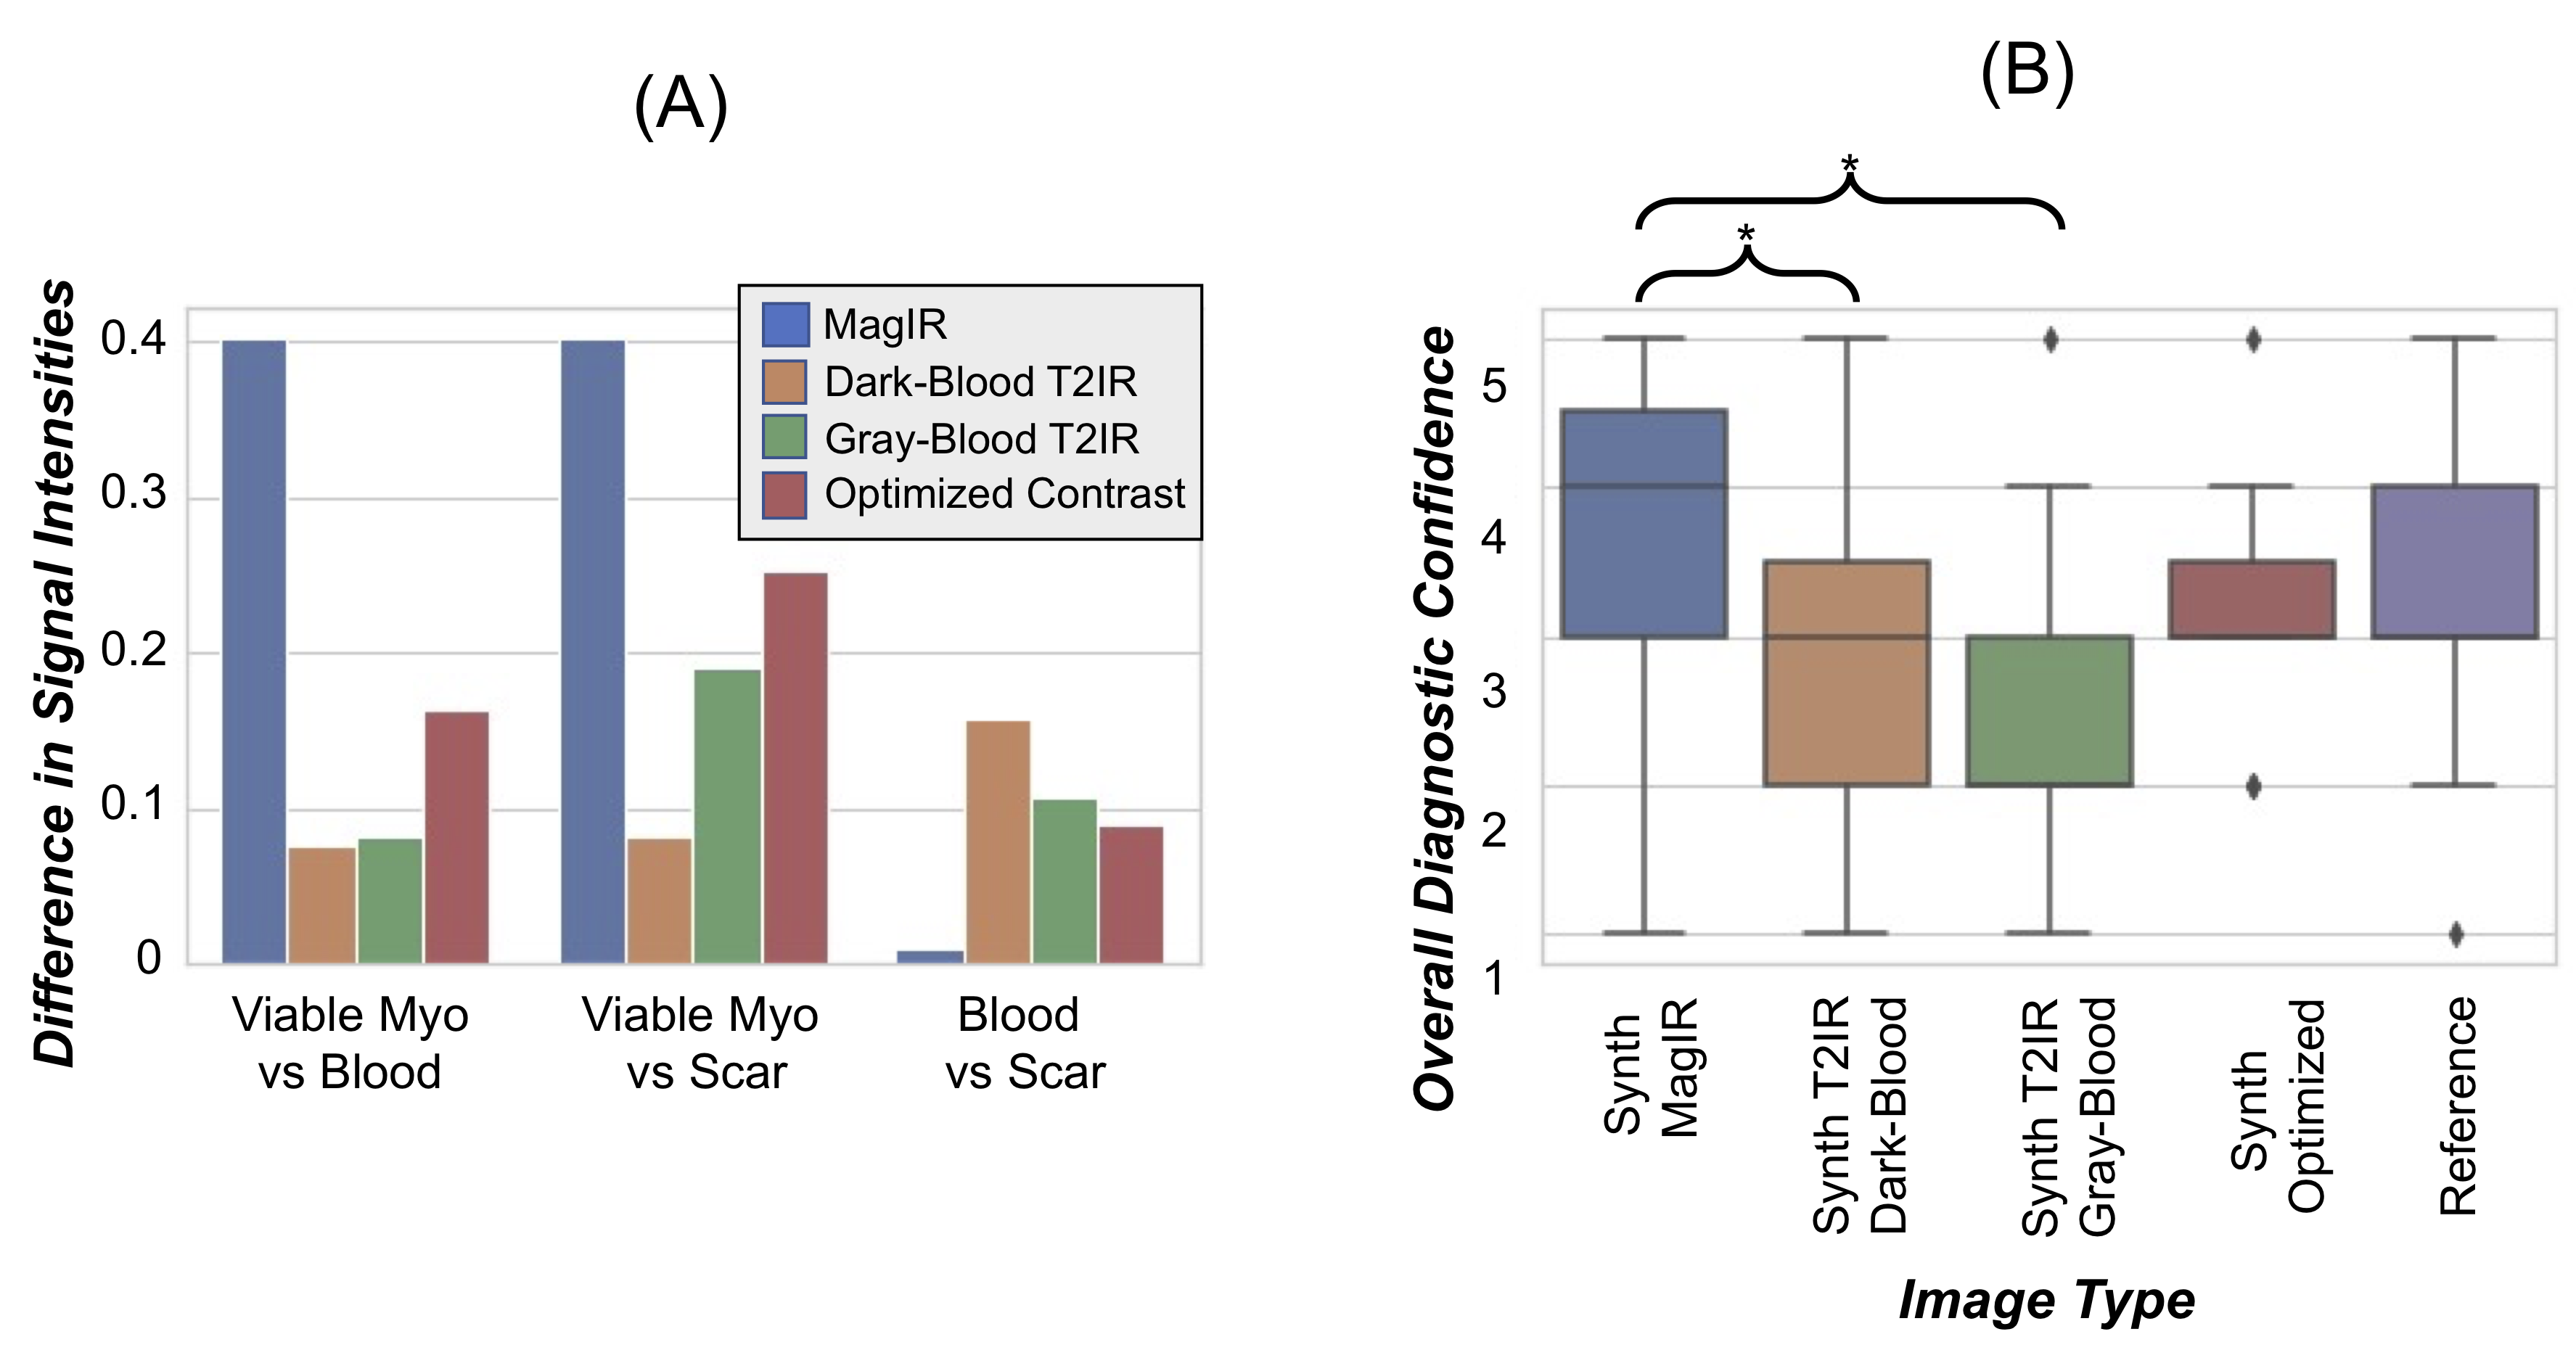
Figure 5: (a) Bloch simulations were used to calculate expected differences in signal intensities between remote viable myocardium, blood, and scar based on patient-averaged T1 and T2 values for each synthetic image contrast. The y-axis shows the absolute difference in longitudinal magnetization between tissues. (b) Image quality ratings of reference LGE images and synthetic bright-blood (MagIR), T2-prepared inversion recovery (T2IR) with dark-blood/gray-myocardium and dark-myocardium/gray-blood contrast, and optimized contrast.
DOI: https://doi.org/10.58530/2022/0275