0272
Validation of Automated Topological LGE Thresholding for Peri-Infarct Substrate Characterization1Medical Biophysics, University of Toronto, Toronto, ON, Canada, 2Schulich Heart Centre, Sunnybrook Research Institute, Toronto, ON, Canada
Synopsis
High-resolution late gadolinium enhancement imaging is a powerful tool for arrhythmia risk assessment post-myocardial infarction, but requires substantial operator time and expertise to analyze. To address this challenge, automated analysis is introduced to isolate and depict relevant image features corresponding to healthy myocardium, peri-infarct gray zone, and dense scar. Using two sets of manual epicardial and endocardial contours, weighted total variation denoising is used to correct for statistical noise, and persistent homology is used to stratify topological features of the image. K-means clustering was used to generate remote myocardium and dense scar signal intensities for automated FWHM thresholding.
Introduction
After a myocardial infarction (MI), patients are at a higher risk for ventricular arrhythmia1. Late gadolinium enhancement (LGE) MRI is used to visualize fibrosis in regions of myocardial scar, aiding clinicians in assessing this risk and planning procedures in this patient population. Biomarkers describing regions of heterogeneous peri-infarct gray zone interdigitated with both scar tissue and healthy myocardium are most predictive of arrhythmia risk and all-cause cardiac mortality2.Pixel signal intensity (SI) thresholding techniques are used to classify tissue into three classes -- myocardium, gray zone, and dense scar -- and full-width half-maximum (FWHM) SI thresholding has been shown to be the most repeatable thresholding method3. High-resolution LGE requires a high degree of manual operator intervention both in the contouring and thresholding stages, which leads to inter-observer variability, particularly in heterogeneity analysis. Automated approaches are desired to repeatably and robustly delineate arrhythmia substrate across multiple users’ contouring sets while reducing operator interaction time. To this end, we propose an approach using edge-preserving denoising and persistent homology to isolate and accurately depict relevant arrhythmogenic tissue substrates.
Methods
Weighted Total Variation (wTV) denoising was used to isolate physiological edges in the LGE images while reducing statistical noise4. wTV denoising builds on traditional total variation denoising by adding a weight function$$\alpha(s) = {1 \over \sqrt{1 + \left(\| \nabla X(s) \| \over \beta\right)^2}}$$
that dictates the image regularization as a function of the magnitude of the signal’s spatial gradient magnitude. In particular, regularizing small edges corresponding to noise, while preserving image edges around regions of dense scar helps accurately depict regions of peri-infarct gray zone.
Persistent Homology is a statistical learning method that applies techniques from mathematical topology to real-world datasets: topological features of an image are calculated and sorted to create a multiscale decomposition at any input dimension5,6. In this application, we interpret zero-dimensional connected components and one-dimensional simple closed curves as corresponding to regions of scar and electrical conduction pathways, respectively, implying physiological relevance to the problem of arrhythmia substrate mapping. For a complete overview of the pipeline, see Fig. 1.
Experiments
A porcine model of myocardial infarction was used for this experiment. Animals were anesthetized, and 100 minute occlusions were performed with a balloon catheter on the left anterior descending artery. After reperfusion, animals were allowed to recover for 5 weeks before LGE imaging. 3D LGE images were acquired on a 3T MR system (MR750, GE Healthcare) 15 minutes post-gadolinium injection; 1D respiratory navigators were used to acquire images at 1.4mm isotropic resolution in a scan time of 8-10 minutes.Five LGE volumes from distinct animals were used for this experiment, and two sets of manual epicardial contours, endocardial contours, and FWHM segmentations were performed for each LGE volume, here and throughout denoted by observer 1 and observer 2 respectively. These segmentations will be compared against those generated by automated thresholding, Auto 1 and Auto 2, using the manual epicardial and endocardial contours from observers 1 and 2, respectively.
Results
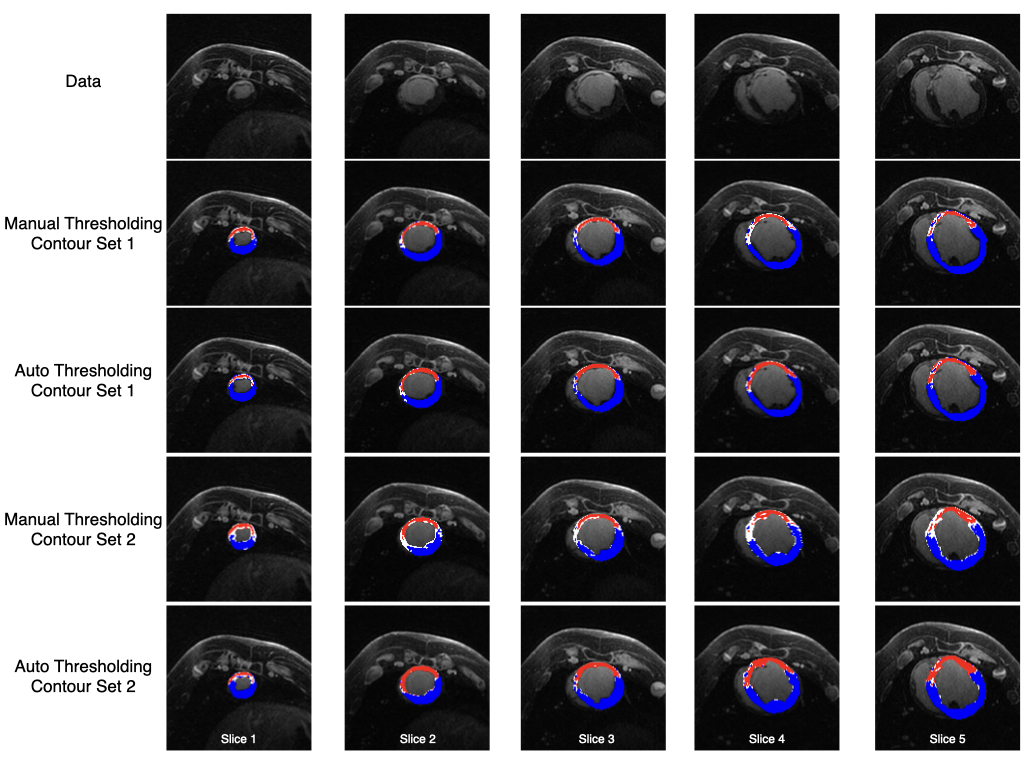
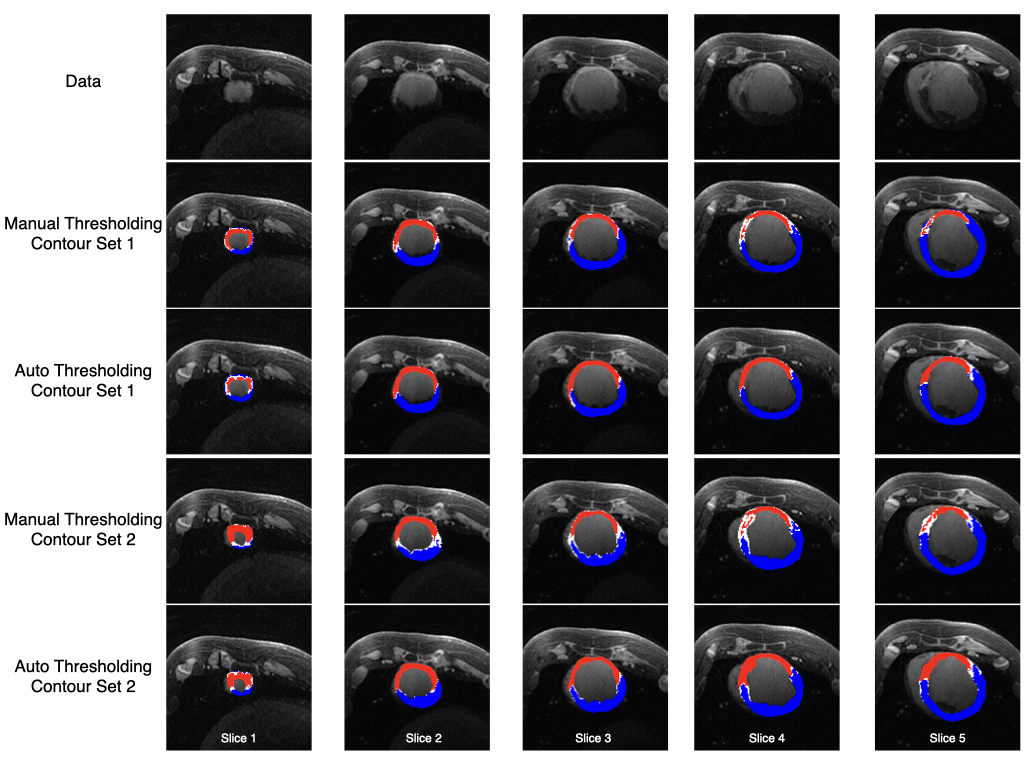
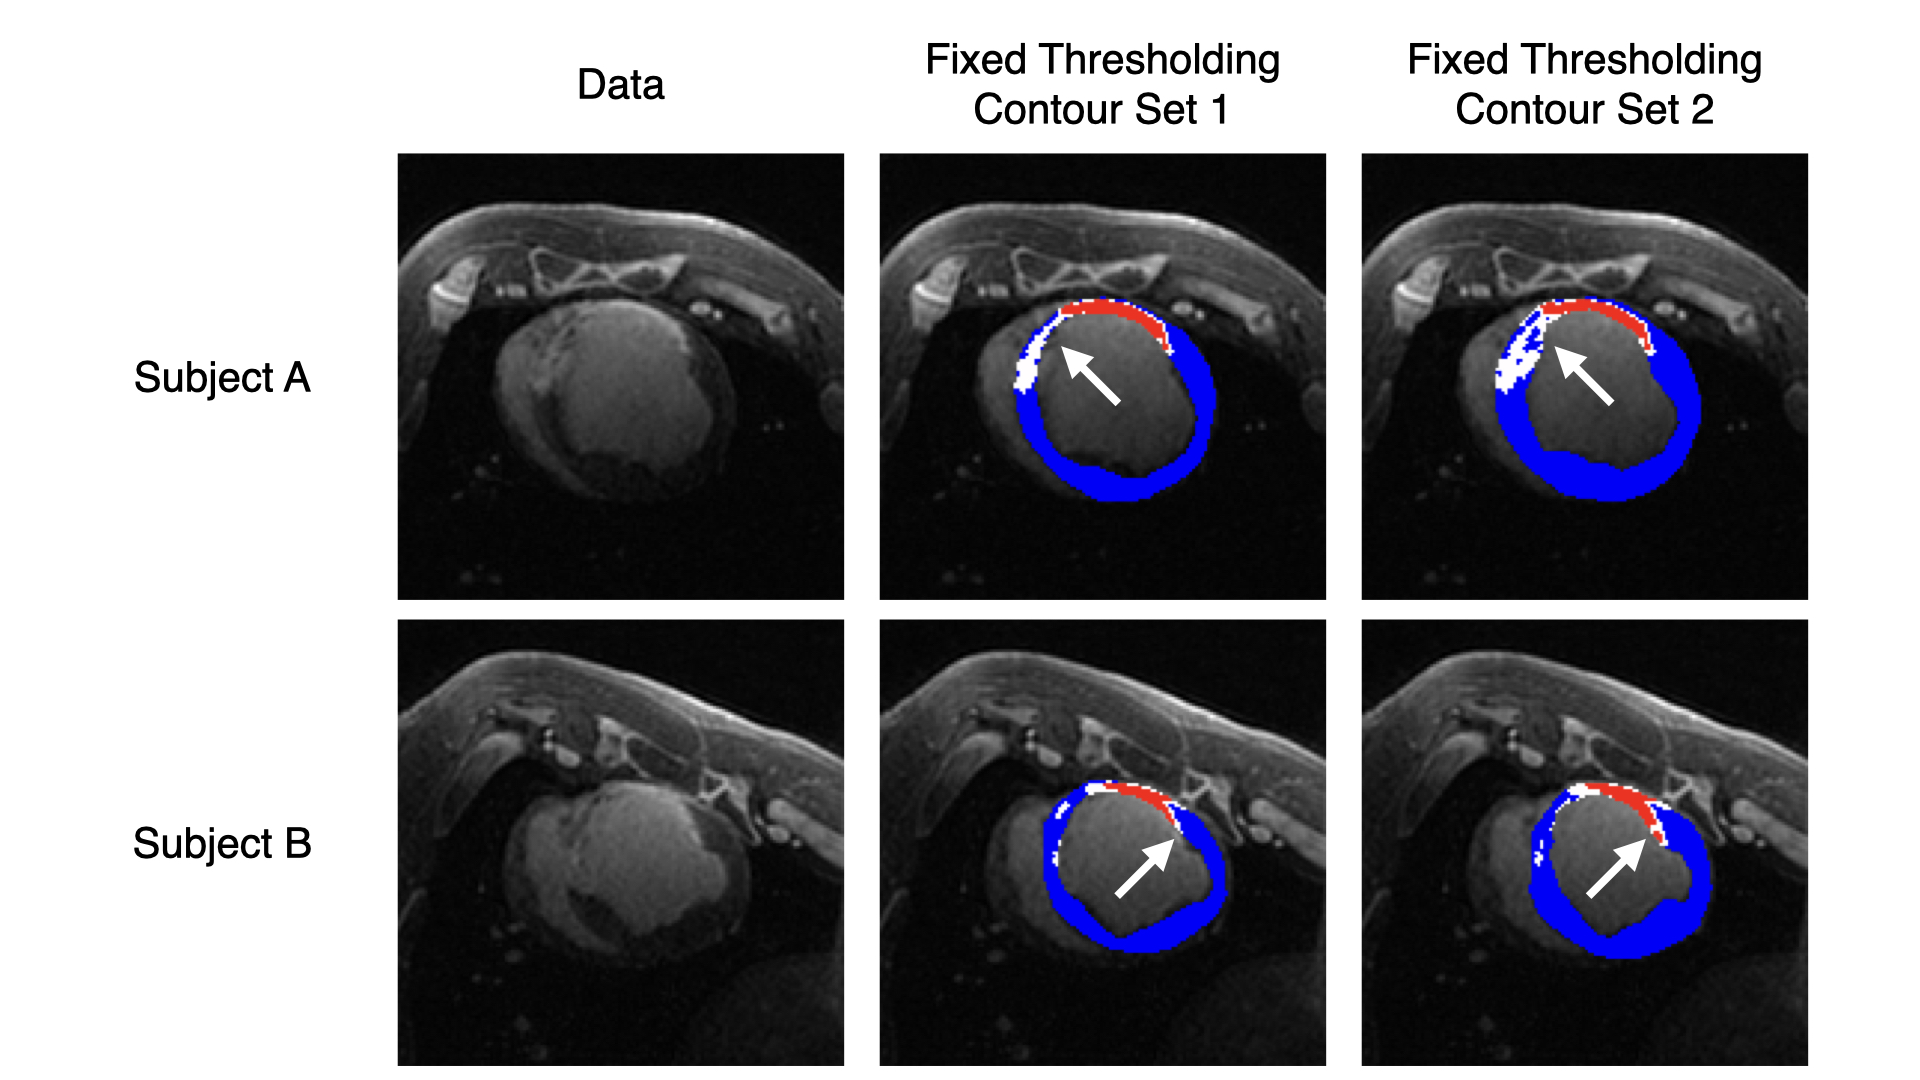
Scar maps generated with automated analysis are visually similar to those generated with manual analysis and are consistent across contours from different observers (Figs. 2, 3). Dice overlap is generally high for myocardium and scar, whereas gray zone overlap is lower due to the inherent inter-observer subjectivity (Fig. 4). Mean and median gray zone dice coefficients are highest for Auto 1 - Auto 2 correlation, but no statistically significant difference exists between Auto 1 - Auto 2 and observer 1 - observer 2 correlation. Finally, variability in scar maps and infarct heterogeneity due to differences in contours is shown in Fig. 5.Discussion
We have proposed an automated three-class thresholding method that uses direct calculation to estimate remote myocardium, gray zone, and dense scar signal intensities without operator intervention. Denoising and thresholding calculations take 55 ms and 270 ms, respectively, on a workstation laptop with the following specifications: intel i7-9750H CPU, Quadro T1000 GPU, maximum RAM usage 2.7GB. As such, an operator can vary parameters and recalculate threshold maps as needed during usage.The use of persistent homology in MR is limited, but growing in recent years7,8. In particular, we can extend the SI histogram to a 2D representation of the SI patterns, similar to fuzzy clustering used in multicontrast imaging9. However, one limitation of this topological method is that thresholding calculations require many features present to accurately generate clusters. In particular, topological thresholding cannot be performed in a slice-by-slice manner, as opposed to manual FWHM thresholding.
Finally, as Figs. 4 and 5 show, optimizing tissue threshold values does not solve the problem of inter-observer variability on its own: differences in manual contours herald differences in the threshold maps. For, the differences in tissue volume created by differing contours not only affect the tissue morphology, but potentially the maximum SI as well. To overcome this challenge, automatic contouring of the LGE images can be used to standardize the tissue volume across observers10.
Acknowledgements
This research was funded by CIHR Grant Number MOP-93531 and the Ontario Research Fund, and we acknowledge research support from GE Healthcare and Circle Cardiovascular Imaging.References
1. Andrew T. Yan, Adolphe J. Shayne, Kenneth A. Brown, Sandeep N. Gupta, Carmen W. Chan, Tuan M. Luu, Marcelo F. Di Carli, H. Glenn Reynolds, William G. Stevenson, and Raymond Y. Kwong. Characterization of the Peri-Infarct Zone by Contrast-Enhanced Cardiac Magnetic Resonance Imaging Is a Powerful Predictor of Post-Myocardial Infarction Mortality. Circulation, 114(1):32–39, 2006.
2. André Schmidt, Clerio F. Azevedo, Alan Cheng, Sandeep N. Gupta, David A. Bluemke, Thomas K. Foo, Gary Gerstenblith, Robert G. Weiss, Eduardo Marbán, Gordon F. Tomaselli, João A.C. Lima, and Katherine C. Wu. Infarct Tissue Heterogeneity by Magnetic Resonance Imaging Identifies Enhanced Cardiac Arrhythmia Susceptibility in Patients With Left Ventricular Dysfunction. Circulation, 115(15):2006–2014, 2007.
3. Andrew S. Flett, Jonathan Hasleton, Christopher Cook, Derek Hausenloy, Giovanni Quarta, Cono Ariti, Vivek Muthurangu, and James C. Moon. Evaluation of Techniques for the Quantification of Myocardial Scar of Differing Etiology Using Cardiac Magnetic Resonance. JACC: Cardiovascular Imaging, 4(2):150–156, 2011.
4. Prashant Athavale, Robert Xu, Perry Radau, Adrian Nachman, and Graham A. Wright. Multiscale properties of weighted total variation flow with applications to denoising and registration. Medical Image Analysis, 23(1):28–42, 2015.
5. Shizuo Kaji, Takeki Sudo, and Kazushi Ahara. Cubical Ripser: Software for computing persistent homology of image and volume data, 2020.
6. P. Bubenik. Statistical Topological Data Analysis using Persistence Landscapes. Journal of Machine Learning Research, 16(3):77–102, 2015.
7. B. Rieck, T. Yates, C. Bock, K. Borgwardt, G. Wolf, N. Turk-Browne, and S. Krishnaswamy. Topological methods for fMRI data. In Preceedings of ICML 2020 Workshop on Computational Biology, 2020.
8. N. Byrne, J. R. Clough, G. Montana, and A. P. King. A Persistent Homology-Based Topological Loss Function for Multi-class CNN Segmentation of Cardiac MRI. In E. Puyol Anton, M. Pop, M. Sermesant, V. Campello, A. Lalande, K. Lekadir, A. Suinesiaputra, O. Camara, and A. Young, editors, Statistical Atlases and Computational Models of the Heart. M&Ms and EMIDEC Challenges, pages 3–13, Cham, 2021. Springer International Publishing.
9. F. Guo, M. Li, M. Ng, G. Wright, and M. Pop. Cine and Multicontrast Late Enhanced MRI Registration for 3D Heart Model Construction. In M. Pop, M. Sermesant, J. Zhao, S. Li, K. McLeod, A. Young, K. Rhode, and T. Mansi, editors, Statistical Atlases and Computational Models of the Heart. Atrial Segmentation and LV Quantification Challenges, pages 49–57, Cham, 2019. Springer International Publishing.
10. F. Guo, P. R. P. Krahn, T. Escartin, I. Roifman, and G. Wright. Cine and late gadolinium enhancement MRI registration and automated myocardial infarct heterogeneity quantification. Magnetic Resonance inMedicine, 85(5):2842–2855, 2021.
Figures