0267
Multimodal brain MRI characterization of a mouse model of Down syndrome and evaluation of a pharmacological treatment.1ICube, University of Strasbourg-CNRS, Strasbourg, France, 2IGBMC, University of Strasbourg-CNRS-INSERM, Illkirch-Graffenstaden, France, 3Perha Pharmaceuticals, Perharidy Peninsula, Roscoff, France, 4Department of Biophysics and Nuclear Medicine, University Hospital of Strasbourg, Strasbourg, France
Synopsis
DYRK1A protein-kinase overexpression was identified as key player in cognitive impairments observed in Down syndrome (DS) patients and in animal models. Inhibition of this kinase rescued cognitive deficits in the Dp1Yey mouse model of DS, but the associated mechanisms remain unknown. Here we used multimodal brain MRI and characterized the morphology, microstructure and functional connectivity (FC) of Dp1Yey mice. Voxel-based morphometry revealed brain-wide morphological alterations in Dp1Yey mice, while DTI analysis revealed white matter changes. Further, rsfMRI showed that pharmacologic DYRK1A inhibition modifies the functional connectivity for memory related nodes, synergistic with cognitive improvements observed in behavioral tests.
Introduction
Down syndrome (DS), caused by trisomy of chromosome 21, is the main genetic cause of intellectual disability, characterized by memory, language, and attention deficits1. Candidate genes explaining cognitive deficits in DS people were identified and among them Dyrk1a gene, located in the DS chromosome 21 region, which encodes the DYRK1A kinase, was demonstrated to be critical2. A complete DS model - the Dp1Yey mouse - was produced3 and Dyrk1a triplication in this model lead to memory and context-associated learning deficits3. The administration of EMD92 (a DYRK1A inhibitor) in the Dp1Yey mice induced an improvement in performance in the object recognition test. Some of the molecular and cellular mechanisms that are targeted by the inhibition of DYRK1A are identified but the circuitry-based mechanisms of action are still unknown. In this context, the aims of our study are: 1) to characterize the brain morphology and microstructure as well as the functional connectivity (FC) features underlying cognitive deficits in the Dp1Yey DS model; 2) to investigate via resting state functional MRI (rsfMRI) if/how brain functional network patterns are remodeled by EMD92 drug that improved the cognitive scores in Dp1Yey mice. To achieve this, we combined anatomical MRI, diffusion tensor imaging (DTI) and rsfMRI in mice.Methods
Animals and treatment: 28 Dp1Yey mice (C57Bl6J aged of 9 to 14 weeks) were used as a model of DS and 28 wildtype (wt) mice were used as controls. Four experimental groups were created: Group 1: control mice receiving vehicle solution (wt-Veh); Group 2: Dp1Yey mice receiving vehicle solution (Dp1Yey-Veh); Group 3: wildtype mice receiving EMD92 (wt-EMD92); Group 4: Dp1Yey mice that received EMD92 treatment (Dp1Yey-EMD92). EMD92 treatment was performed by daily oral (gavage) administration for 11 days. During this period the animals were tested for cognitive performance (fig.1A). Brain MRI data was acquired at the day 11. The last administration of EMD92 was performed 1 hour before rsfMRI acquisition (fig.1B).Data acquisition: Brain imaging was performed using a 7T MRI scanner (Biospec70/30, Bruker) and a 1H four-channels phased array receive-only CryoProbe. Anatomical images were acquired with a Turbo RARE T2-weighted sequence (TE/TR=50ms/5863ms; resolution=0.07x0.07x0.35mm3), rsfMRI images with a GE-EPI sequence (TE/TR=15ms/2137ms; resolution=0.14x0.18x0.35mm3; 500 volumes/16min), and diffusion data using a DTI-EPI sequence (TE/TR=28.57ms/3000ms; [δ]=5ms; [Δ]=11ms; b=1000s/mm2; 45 diffusion directions) (fig.1C). During fMRI acquisitions, mice were anesthetized by a combination of isoflurane (0.5%) and medetomidine (0.1mg.kg-1 bolus sc). DTI and anatomical data were collected under isoflurane anesthesia (1,5%)() (fig.1D).
Data analysis: (i) Voxel Based Morphometry (VBM): T2-weighted images were corrected for bias signal intensity and spatially normalized onto Allen mouse brain atlas with ANTs5. Jacobian maps were computed for each estimated deformation field and a logarithmic transformation was applied so that dilation (jacobian>1) and contraction (jacobian between 0 and 1) are mapped. Inter-groups comparisons (Dp1Yey-Veh vs. wt-Veh group) were conducted at voxel level (p<0.05, FDR cluster corr.) using the general linear model with SPM126. Results were superimposed on the average brain T2-weighted image (fig.2).
(ii) DTI images were preprocessed using MRtrix7 for denoising, unringing, motion and distortion corrections. Preprocessed data was used to generate parametric maps (FA, RD, AD and MD) that were co-registered using ANTs. Inter-groups (Dp1Yey-Veh vs. wt-Veh) voxel-vise statistics were performed (SPM12; two-sample t-test; p<0.01 uncorr.).
(iii) RsfMRI data was corrected for motion and for distortions using the B0 acquired maps. A high-pass filter (0.01Hz) was applied to select BOLD frequencies. Additionally, 24 motion parameters and ventricles signal were regressed out. For each subject, the Allen Brain Atlas was deformed on individual brain to accurately extract subject specific ROIs (38 ROIs covering major brain areas). From each ROIs, the average BOLD time-course was extracted and correlation matrices were created (at subject level and group level). Graph theory was applied to map the FC features for each group.
Results and discussion
1) Characterization of Dp1Yey mouse model of DS (Dp1Yey-Veh vs. wt-Veh group). VBM analysis revealed significant brain-wide cortical and subcortical volume alterations in the Dp1Yey model, involving frontal and sensory cortices and striatal, hippocampic and thalamic regions (fig.2). Dp1Yey model showed significant ventricles enlargement (z score=7) and decrease in hippocampal volume. The DYRK1A kinase overexpression could explain at least in part these morphological modifications as it plays a crucial role during neurodevelopment2. Inter-group comparison of parametric diffusion maps showed significant decrease of FA along white matter tracts including corpus callosum, external capsule and cingulum bundle (fig.3) in Dp1Yey mice. This suggest DS specific microstructural alterations that will be further tested in correlation with behavior scores.2) Effect of the EMD92-treatment on rsfMRI networks. Graph theory was applied to identify the hub "nodes" of each experimental group. We used Stouffer method8,9 taking is account the number of significant connections for each node and the connection strength. Dp1Yey mice treated with EMD92, show decreased Stouffer coefficient/node (brain area) compared to the Dp1Yey-Veh group (fig.4), suggesting overall decrease of FC. Several areas involved in memory and cognitive processing are highlighted (frontal cortices, hippocampus). The general decrease in FC caused by the treatment can be compared to improved behavioral scores obtained by the same mice. Further studies will allow to better understand these functional changes and to extract networks specifically modified by treatment.
Acknowledgements
The authors would like to acknowledge the High Performance Computing Center of the University of Strasbourg for supporting this work by providing scientific support and access to computing resources. Part of the computing resources were funded by the Equipex Equip@Meso project (Programme Investissements d'Avenir) and the CPER Alsacalcul/Big Data.References
1. Lukowski, A. F., Milojevich, H. M., & Eales, L. (2019). Cognitive Functioning in Children with Down Syndrome: Current Knowledge and Future Directions. Adv. Child. Dev. Behav., 56 (1), 257-289.
2. Arbones, M. L., Thomazeau, A., Nakano-Kobayashi, A., Hagiwara, M., & Delabar, J. M. (2019). DYRK1A and cognition: A lifelong relationship. Pharmacol. Ther., 194(1), 199-221.
3. Herault, Y., Delabar, J. M., Fisher, E. M. C., Tybulewicz, V. L. J., Yu, E., & Brault, V. (2017). Rodent models in Down syndrome research: Impact and future opportunities. Dis. Model. Mech., 10(10), 1165-1186.
4. Grandjean, J., Canella, C., Anckaerts, C., Ayrancı, G., Bougacha, S., Bienert, T., Buehlmann, D., Coletta, L., Gallino, D., Gass, N., Garin, C. M., Nadkarni, N. A., Hübner, N. S., Karatas, M., Komaki, Y., Kreitz, S., Mandino, F., Mechling, A. E., Sato, C., … Gozzi, A. (2020). Common functional networks in the mouse brain revealed by multi-centre resting-state fMRI analysis. NeuroImage, 205 (1), 1-24.
5. http://stnava.github.io/ANTs/
6 . http://www.fil.ion.ucl.ac.uk/spm/
7. Tournier, J.-D., Smith, R., Raffelt, D., Tabbara, R., Dhollander, T., Pietsch, M., Christiaens, D., Jeurissen, B., Yeh, C.-H., & Connelly, A. (2019). MRtrix3: A fast, flexible and open software framework for medical image processing and visualisation. NeuroImage, 202, 116137.
8. Stouffer SA (1949) A study of attitudes. Sci Am 180(5):11–1.
9. Karatas, M., Noblet, V., Nasseef, M. T., Bienert, T., Reisert, M., Hennig, J., Yalcin, I., Kieffer, B. L., von Elverfeldt, D., & Harsan, L.-A. (2021). Mapping the living mouse brain neural architecture: Strain-specific patterns of brain structural and functional connectivity. Brain Structure and Function, 226(3), 647‑669.
Figures
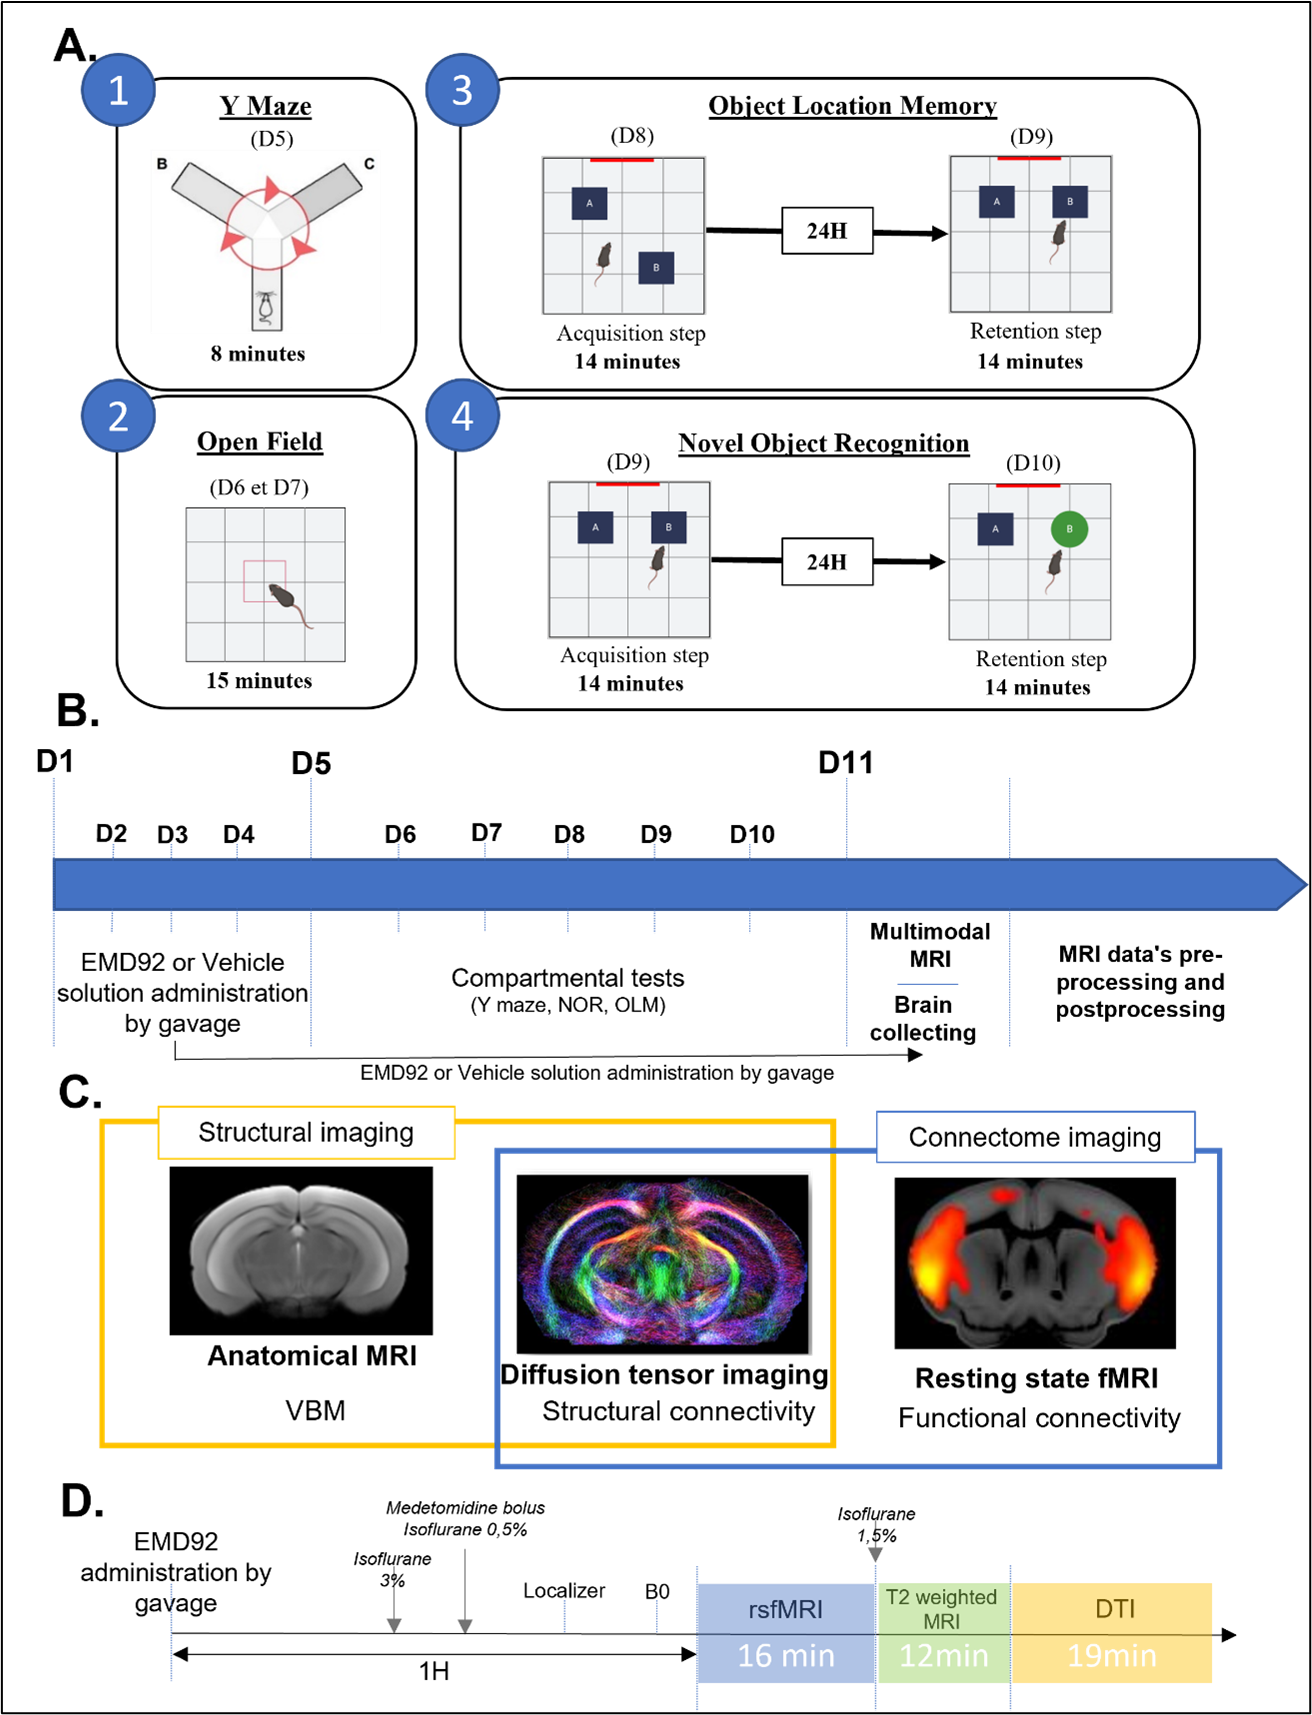
Figure 1: Experimental design showing (A) the set-up for behavioral tests. The open field (2) assess motor skills, the Y maze (1), the OLM (3) and the NOR (4) assess different memories respectively : short terme mermory, object location memory and object recognition memory. (B) Chronology of the experiments. (C) MRI modalities used for In-vivo brain imaging. (D) MRI acquisitions protocol showing the times at which the acquisitions are made and the anesthesia parameters.
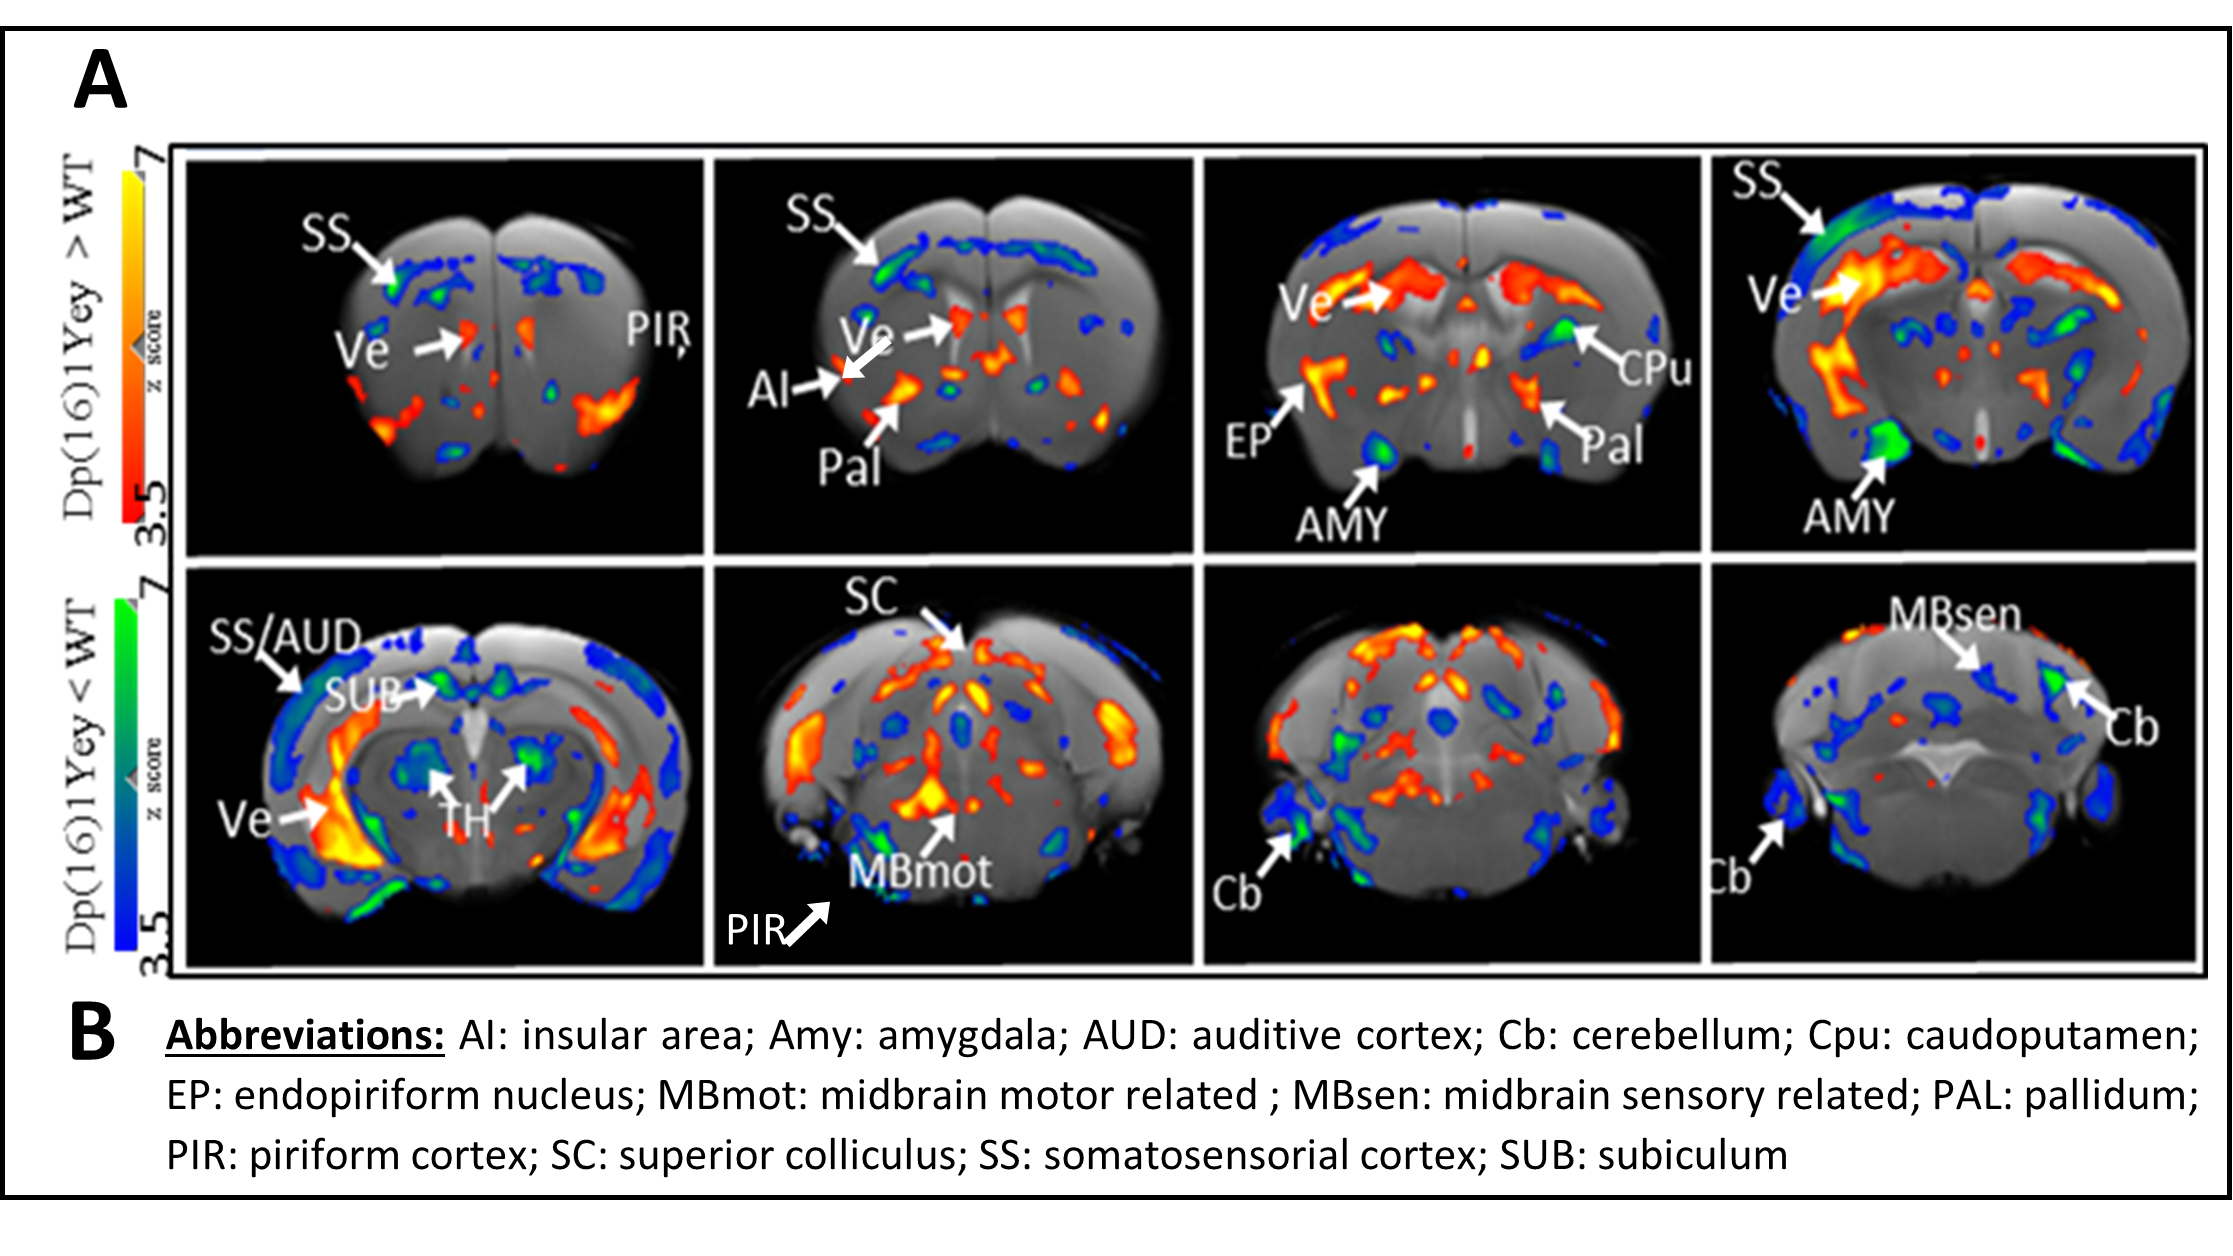
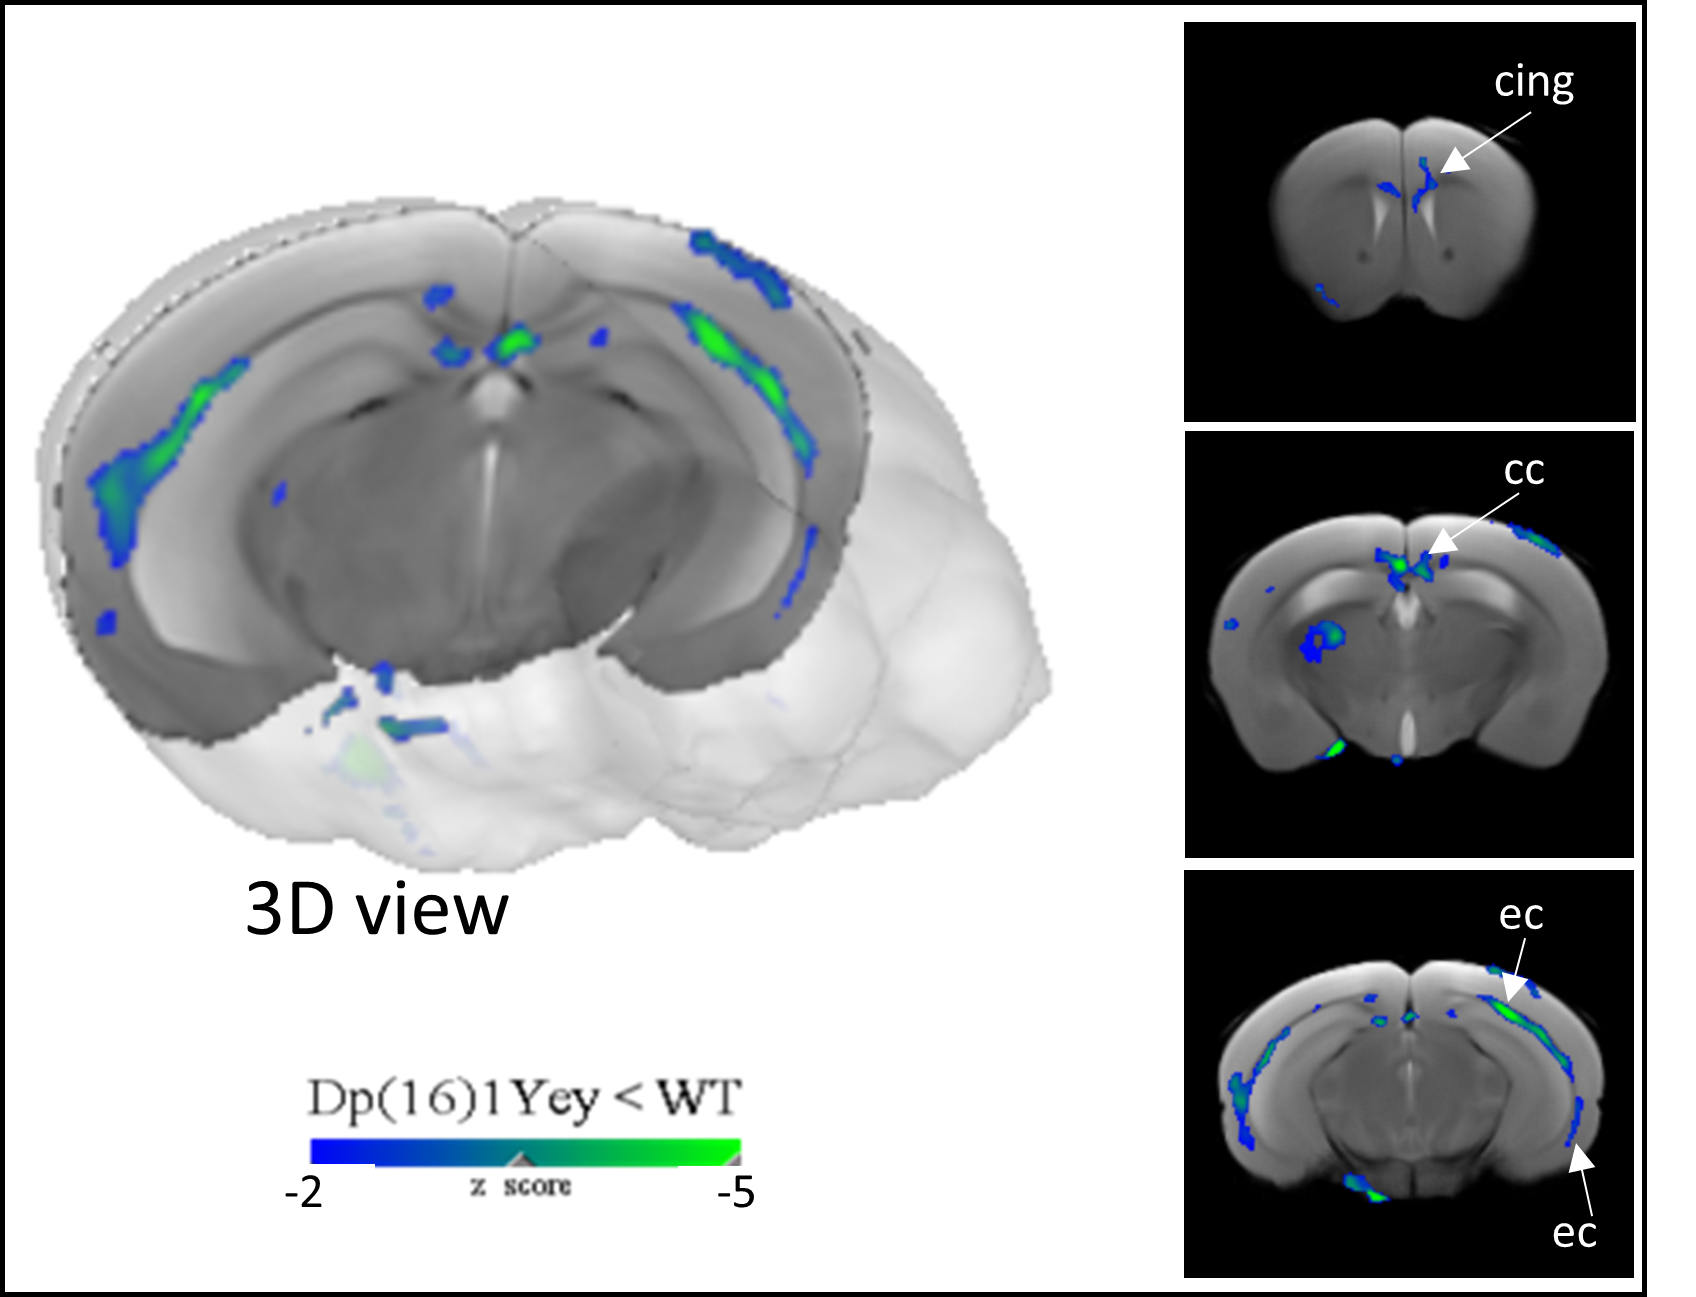
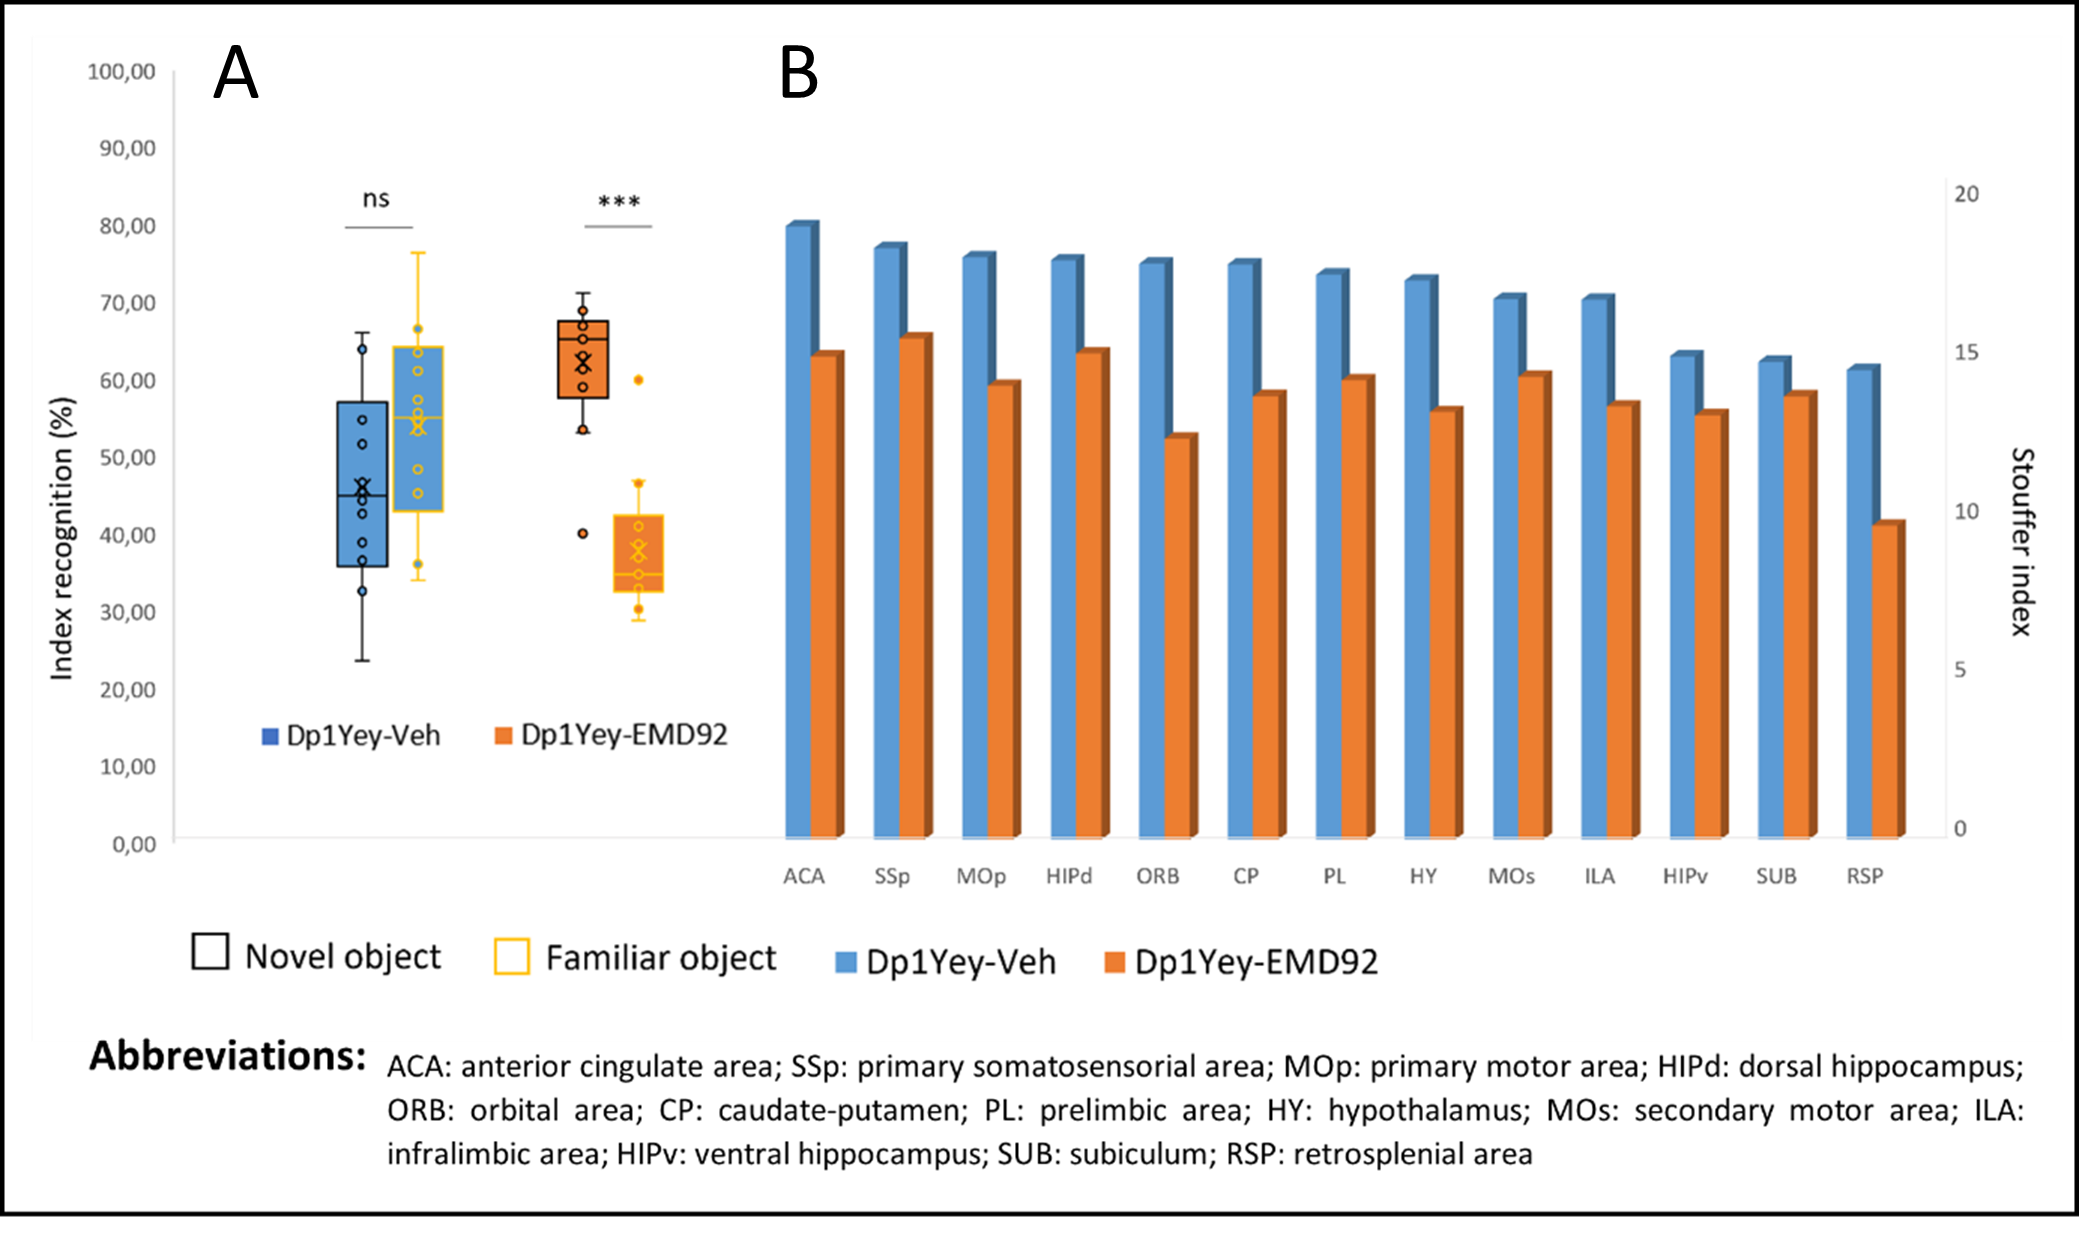
Figure 4: A. Behavioral results: the box plots show the percentage of time the mouse spent exploring the familiar object (yellow contours) and the new object (black contours) 24 hours after the acquisition step. A significantly longer exploration time of the new object than the exploration of the familiar object shows a recognition of the new object in the mouse. (ns :not significant; *** : p<0.001). B. The stouffer index shows the most significantly connected nodes (by number and strength of their connections) in each group: Dp1Yey-Veh and Dp1Yey-EMD92 (FDR corrected p<0.01).