0265
Type 2 diabetes mellitus and obesity are associated with altered T2* and resting-state brain activity: a UK Biobank study1Department of Medical Biophysics, University of Toronto, Toronto, ON, Canada, 2Hurvitz Brain Sciences, Sunnybrook Research Institute, Toronto, ON, Canada, 3Department of Pharmacology and Toxicology, University of Toronto, Toronto, ON, Canada, 4Department of Psychiatry, Kuwait University, Kuwait City, Kuwait, 5Dasman Diabetes Institute, Kuwait City, Kuwait, 6Department of Medicine, University of Toronto, Toronto, ON, Canada
Synopsis
T2*-weighted image is a versatile and common MR imaging readout. We studied anatomical and functional brain features in three groups: Type 2 diabetes mellitus (T2DM), obese, and healthy adults. We observed that T2DM and obese adults are associated with lower regional T2* relative to healthy adults. We further found that an adverse lipid profile in obese adults was associated with decreased regional brain intrinsic activity. This work helps to characterize how T2DM and obesity affects brain using susceptibility-weighted and resting-state functional MRI approaches.
Introduction
T2*-weighted MRI pulse sequences such as Susceptibility-Weighed Imaging (SWI) and Blood Oxygenation Level Dependent (BOLD) imaging are commonly used to study the brain. SWI provides high spatial resolution to visualize veins, microbleeds, and/or iron deposition. Whereas BOLD resting-state functional MRI (rs-fMRI) provides dynamic information with good temporal resolutions to study intrinsic brain activity. 1-2Type 2 diabetes mellitus (T2DM) and obesity are two common metabolic diseases; yet current neuroimaging of T2DM and obesity remains relatively limited.3-5 This study investigated whether aspects of T2DM and obesity will be associated with SWI and rs-fMRI features. In Aim-1, we used two-echo SWI to compare T2* among T2DM, obesity, and healthy adults. In Aim-2 we developed a lipid profile to investigate rs-fMRI in T2DM, obesity, and control groups. Lipid profiles include high low-density lipoprotein (LDL), high triglyceride (TGs), and low high-density lipoprotein (HDL) level from blood samples. 6 Such abnormal lipid metabolism may affect normal cerebral vascular function. 5 Thus, we are interested in whether plasma LDL, TGs, and HDL levels play roles in neuroimaging readouts in T2DM, obese, and healthy adults. We studied the associations among plasma LDL, TGs, and HDL levels and the within-group variance of intrinsic brain activity in the three groups that were accessed from the UK biobank.
Method
Aim-1: SWI images from 40 T2DM, 62 obese, and 150 healthy adults were accessed from UK Biobank (voxel resolution = 0.8x0.8x3 mm, FOV=204.8x230.4 mm, TE1=9.42 ms, TE2 = 20ms). Anatomical MR images were segmented using the ‘FIRST’ command from the FMRIB Software Library (FSL), from which median T2* (ms) in thalamus, caudate, putamen, hippocampus, amygdala, accumbens, and pallidum were estimated.Aim-2: rs-fMRI data from 129 T2DM, 188 obese, and 187 healthy adults that were accessed from UK Biobank, of which case n=252 of these participants overlapped with the SWI data in Aim-1 (FOV=211.2 x 211.2 mm, Flip angle = 52, TR/TE=735ms/39ms, 590 frames). For each voxel, the fractional amplitude of low-frequency fluctuation (fALFF) value was obtained by dividing the amplitude of the low-frequency band (0.01Hz – 0.1Hz) by the amplitude of the entire frequency range in that voxel. For each participant, we compiled demographic data and lipid data. Factor analyses were carried out using the ‘psych’ library in R to create a single lipid profile by combining HDL, LDL, and TGs variables. Eigenvalues were calculated to assess the contribution of each of the lipid variable, and a larger factor score corresponded to higher lipid risk. Multivariable regressions were then carried out with covariates described in Equation 1 to analyse the association between fALFF and the lipid factor.
fALFF ~ Age + Sex + Waist-to-hip ratio + Brain volume + HbA1c + Lipid Factor [1]
The brain volume covariate was the sum of total grey and white matter volumes. Non-parametric permutation voxel-wise statistics from FSL ‘randomise’ were carried out to test for an effect of lipid factor on within-group regional fALFF. We then used threshold-free cluster enhancement (H=2, E=5, C=6) to identify significant clusters that account for family-wise error.
Results
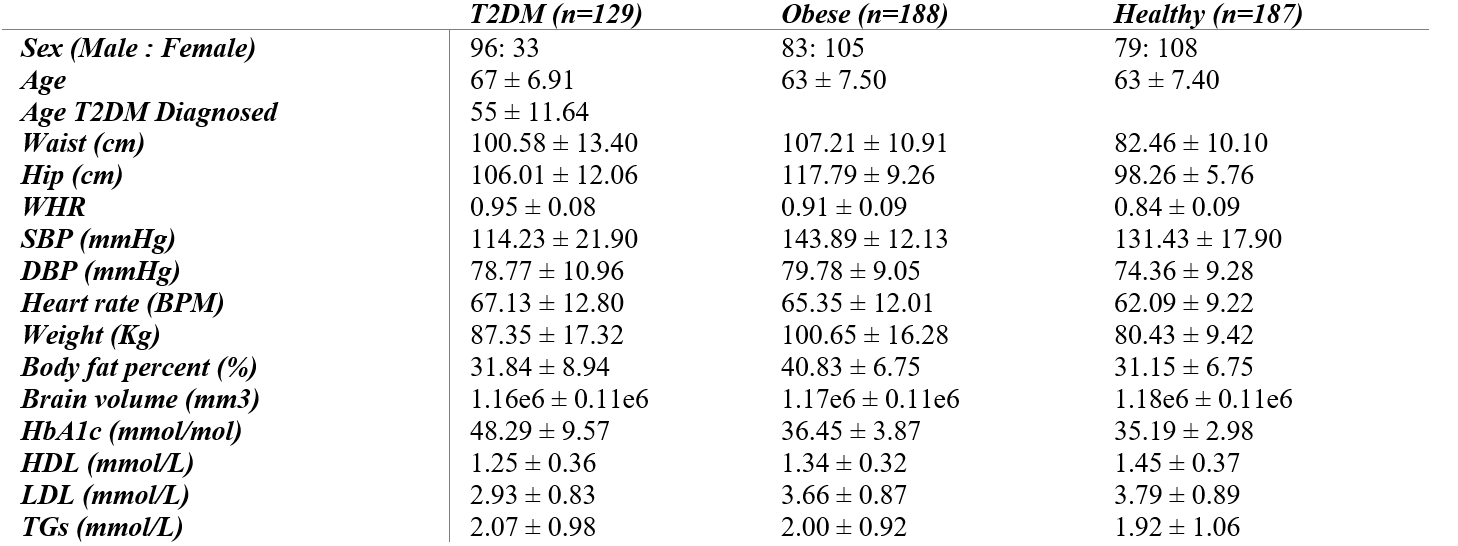
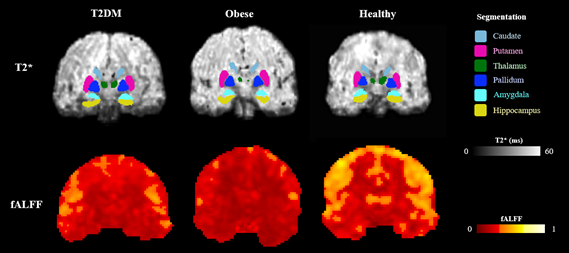
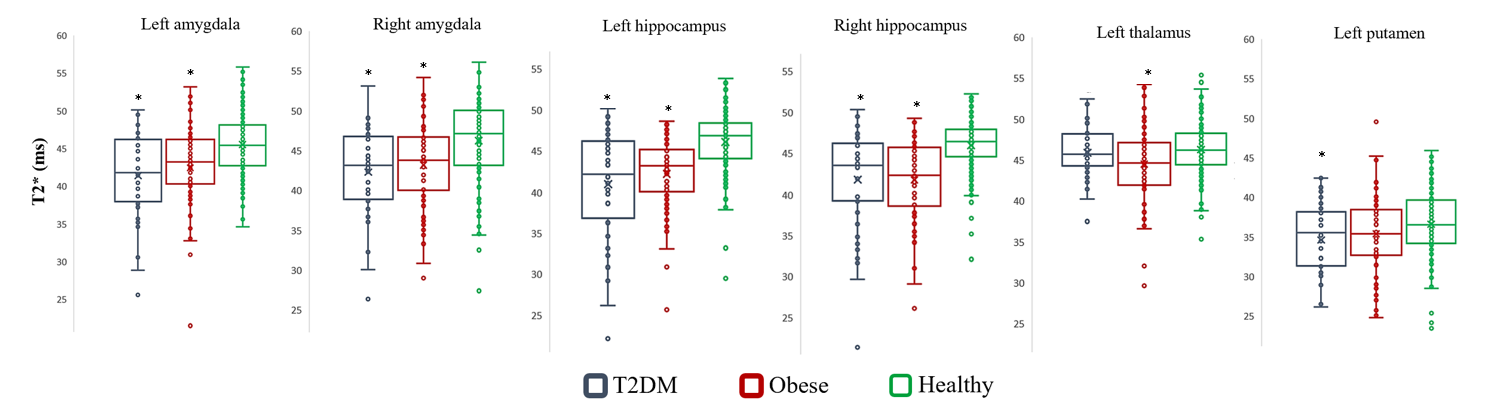
Participant characteristics are listed in Table 1. Examples of MR images are presented in Figure 1. The lipid factors had eigenvalues of 1.40, 1.42, and 1.48 for T2DM, obese, and healthy adults, respectively. According to the Kaiser-Guttman rule of eigenvalues, all lipid factors from factor analysis can be retained.Figure 2 summarises the findings in Aim-1. We found T2DM adults had significantly lower median T2* (P<0.05) in left putamen, left/right hippocampus, left/right amygdala comparing to control. We also found obese non-T2DM adults had significantly lower median T2* (P<0.05) in left thalamus, left/right hippocampus, and left/right amygdala comparing to control.
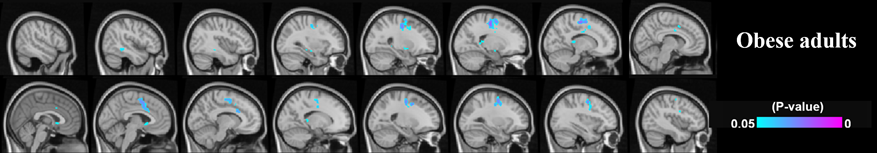
Figure 3 summarises the findings in Aim-2. The T2DM and the healthy adults showed no fALFF associations with the lipid profile. The obese group showed significant clusters (P < 0.05) illustrating negative associations between fALFF and the lipid factor at the right hippocampus and right amygdala, left/right premotor cortex, left/right thalamus, and subcallosal regions.
Discussions
The lowered regional T2* estimate in putamen, hippocampus, amygdala, and thalamus in the T2DM / obese group relative to healthy control may indicate increased dispersion of the transverse MR signal in relation to oxygenation status, presence of microbleeds or iron depositions. In the obese group, we demonstrated that the lipid factor was associated with lower intrinsic brain activity. The lipid factor did not show any significance in the T2DM group. Since not all T2DM participants in the study are obese, the impaired lipid profile from obese adults may become an independent risk factor of the reduced intrinsic brain activity. Future studies will separate obese T2DM and non-obese T2DM adults to further justify these findings.Conclusion
Our study demonstrated the associations among T2DM, obesity, and regional T2* changes. We also showed that abnormal plasma HDL, LDL, and TGs are associated with decreased regional intrinsic brain activities in obese adults. Our study expands the current understanding of how T2DM and obesity may affect brain MRI measurements. The large sample size in our study was a strength of this study. This research helps to advance understanding of lipid risk factors of brain functional alterations in T2DM and obese patients.Acknowledgements
This project was part of a collaborative project with funding from the Kuwait Ministry of HealthReferences
1. Meoded, A., Poretti, A., Northington, F. ., Tekes, A., Intrapiromkul, J., & Huisman, T. A. G. . (2012). Susceptibility weighted imaging of the neonatal brain. Clinical Radiology, 67(8), 793–801. https://doi.org/10.1016/j.crad.2011.12.004
2. Biswal, B. B. (2012). Resting state fMRI: A personal history. NeuroImage (Orlando, Fla.), 62(2), 938–944. https://doi.org/10.1016/j.neuroimage.2012.01.090
3. Pruzin, J. J., Nelson, P. T., Abner, E. L., & Arvanitakis, Z. (2018). Review: Relationship of type 2 diabetes to human brain pathology. Neuropathology and Applied Neurobiology, 44(4), 347–362. https://doi.org/10.1111/nan.12476
4. Yao, L., Yang, C., Zhang, W., Li, S., Li, Q., Chen, L., Lui, S., Kemp, G. J., Biswal, B. B., Shah, N. J., Li, F., & Gong, Q. (2021). A multimodal meta-analysis of regional structural and functional brain alterations in type 2 diabetes. Frontiers in Neuroendocrinology, 62, 100915–100915. https://doi.org/10.1016/j.yfrne.2021.100915
5. Abranches, M. V., Oliveira, F. C. E. de, Conceição, L. L. da, & Peluzio, M. do C. G. (2015). Obesity and diabetes: the link between adipose tissue dysfunction and glucose homeostasis. Nutrition Research Reviews, 28(2), 121–132. https://doi.org/10.1017/S0954422415000098
6. März, W., Kleber, M. E., Scharnagl, H., Speer, T., Zewinger, S., Ritsch, A., Parhofer, K. G., von Eckardstein, A., Landmesser, U., & Laufs, U. (2017). HDL cholesterol: reappraisal of its clinical relevance. Clinical Research in Cardiology, 106(9), 663–675. https://doi.org/10.1007/s00392-017-1106-1
Figures