0264
Investigating structural and functional connectivity of human entorhinal subregions using DTI and fMRI1Kavli Institute for Systems Neuroscience, NTNU - Norwegian University of Science and Technology, Trondheim, Norway, 2Department of Diagnostic Imaging, Akershus University Hospital, Lørenskog, Norway, 3Max Planck Institute for Human Cognitive and Brain Sciences, Leipzig, Germany, 4Institute of Psychology, Leipzig University, Leipzig, Germany
Synopsis
Despite previous attempts to localize the human homologues of the medial (MEC) and lateral entorhinal cortex (LEC) using fMRI and DTI separately, there are still uncertainties related to the choice of imaging modality and seed regions used. In this study, we investigated both structural connectivity from DTI and functional connectivity from fMRI between the EC and associated brain regions. Differential EC connectivity to these regions was then used to predict the locations of the human homologues of MEC and LEC. Our results from both DTI and fMRI showed a qualitatively similar subdivision into posteromedial and anterolateral EC, supporting previous studies.
Introduction
The entorhinal cortex (EC), a part of the hippocampal formation in the medial temporal lobe of the brain, is central in cognitive processes such as memory formation, spatial navigation and time perception1-4. Its two main subregions – the ‘medial’ (MEC) and ‘lateral’ entorhinal cortex (LEC) – differ in both functional properties and connectivity to other brain regions5-7. However, while the locations of MEC and LEC have been identified in other species such as rodents, their human homologues remain unclear. Despite previous studies using functional magnetic resonance imaging (fMRI) and diffusion tensor imaging (DTI) to investigate this, there are still uncertainties related to the choice of imaging modality and seed regions for connectivity analysis8-12. Identifying the locations of MEC and LEC in humans has importance both in cognitive neuroscience and in translational studies on e.g. Alzheimer’s disease, which partially starts in the EC13. The purpose of this study was to compare using structural connectivity from DTI with functional connectivity from fMRI for predicting the locations of the human homologues of MEC and LEC.Methods
T1-weighted, diffusion-weighted and resting-state functional MRI data from 81 participants were obtained from the WU-Minn Human Connectome Project (http://db.humanconnectome.org)14,15, acquired on a 3T Siemens Connectome Skyra scanner and a 7T Siemens Magnetom scanner (Siemens Medical Systems, Erlangen, Germany). Diffusion-weighted images were acquired at 3T and 7T, respectively, using spin-echo EPI sequences with 1.25 and 1.05 mm isotropic resolution, and with b-values of 1000, 2000, 3000 s/mm2 and 1000, 2000 s/mm2 in addition to a set of b = 0 images16,17. fMRI data were acquired at 7T using a gradient-echo EPI sequence with 1.6 mm isotropic resolution18-20. There were two resting-state runs with posterior-anterior (PA) and two runs with anterior-posterior (AP) phase encoding direction, and in each run 900 image volumes were acquired over 16 minutes.Regions of interest (ROIs) of the EC, presubiculum, distal CA1 + proximal subiculum (dCA1pSub), retrosplenial cortex (RSC) and posterolateral orbitofrontal cortex (OFC) were obtained from automated cortical parcellation12,21,22. Probabilistic tractography between the EC and the other four ROIs was then performed on the 3T and 7T DTI data23-27. From this, structural connectivity maps representing the probability of each voxel in the EC to be connected to the other ROIs were created. Seed-based functional connectivity analysis was performed on the PA and AP fMRI data, by calculating the Pearson correlation between the time series of each voxel in the EC and the four other ROIs – creating functional connectivity maps as well.
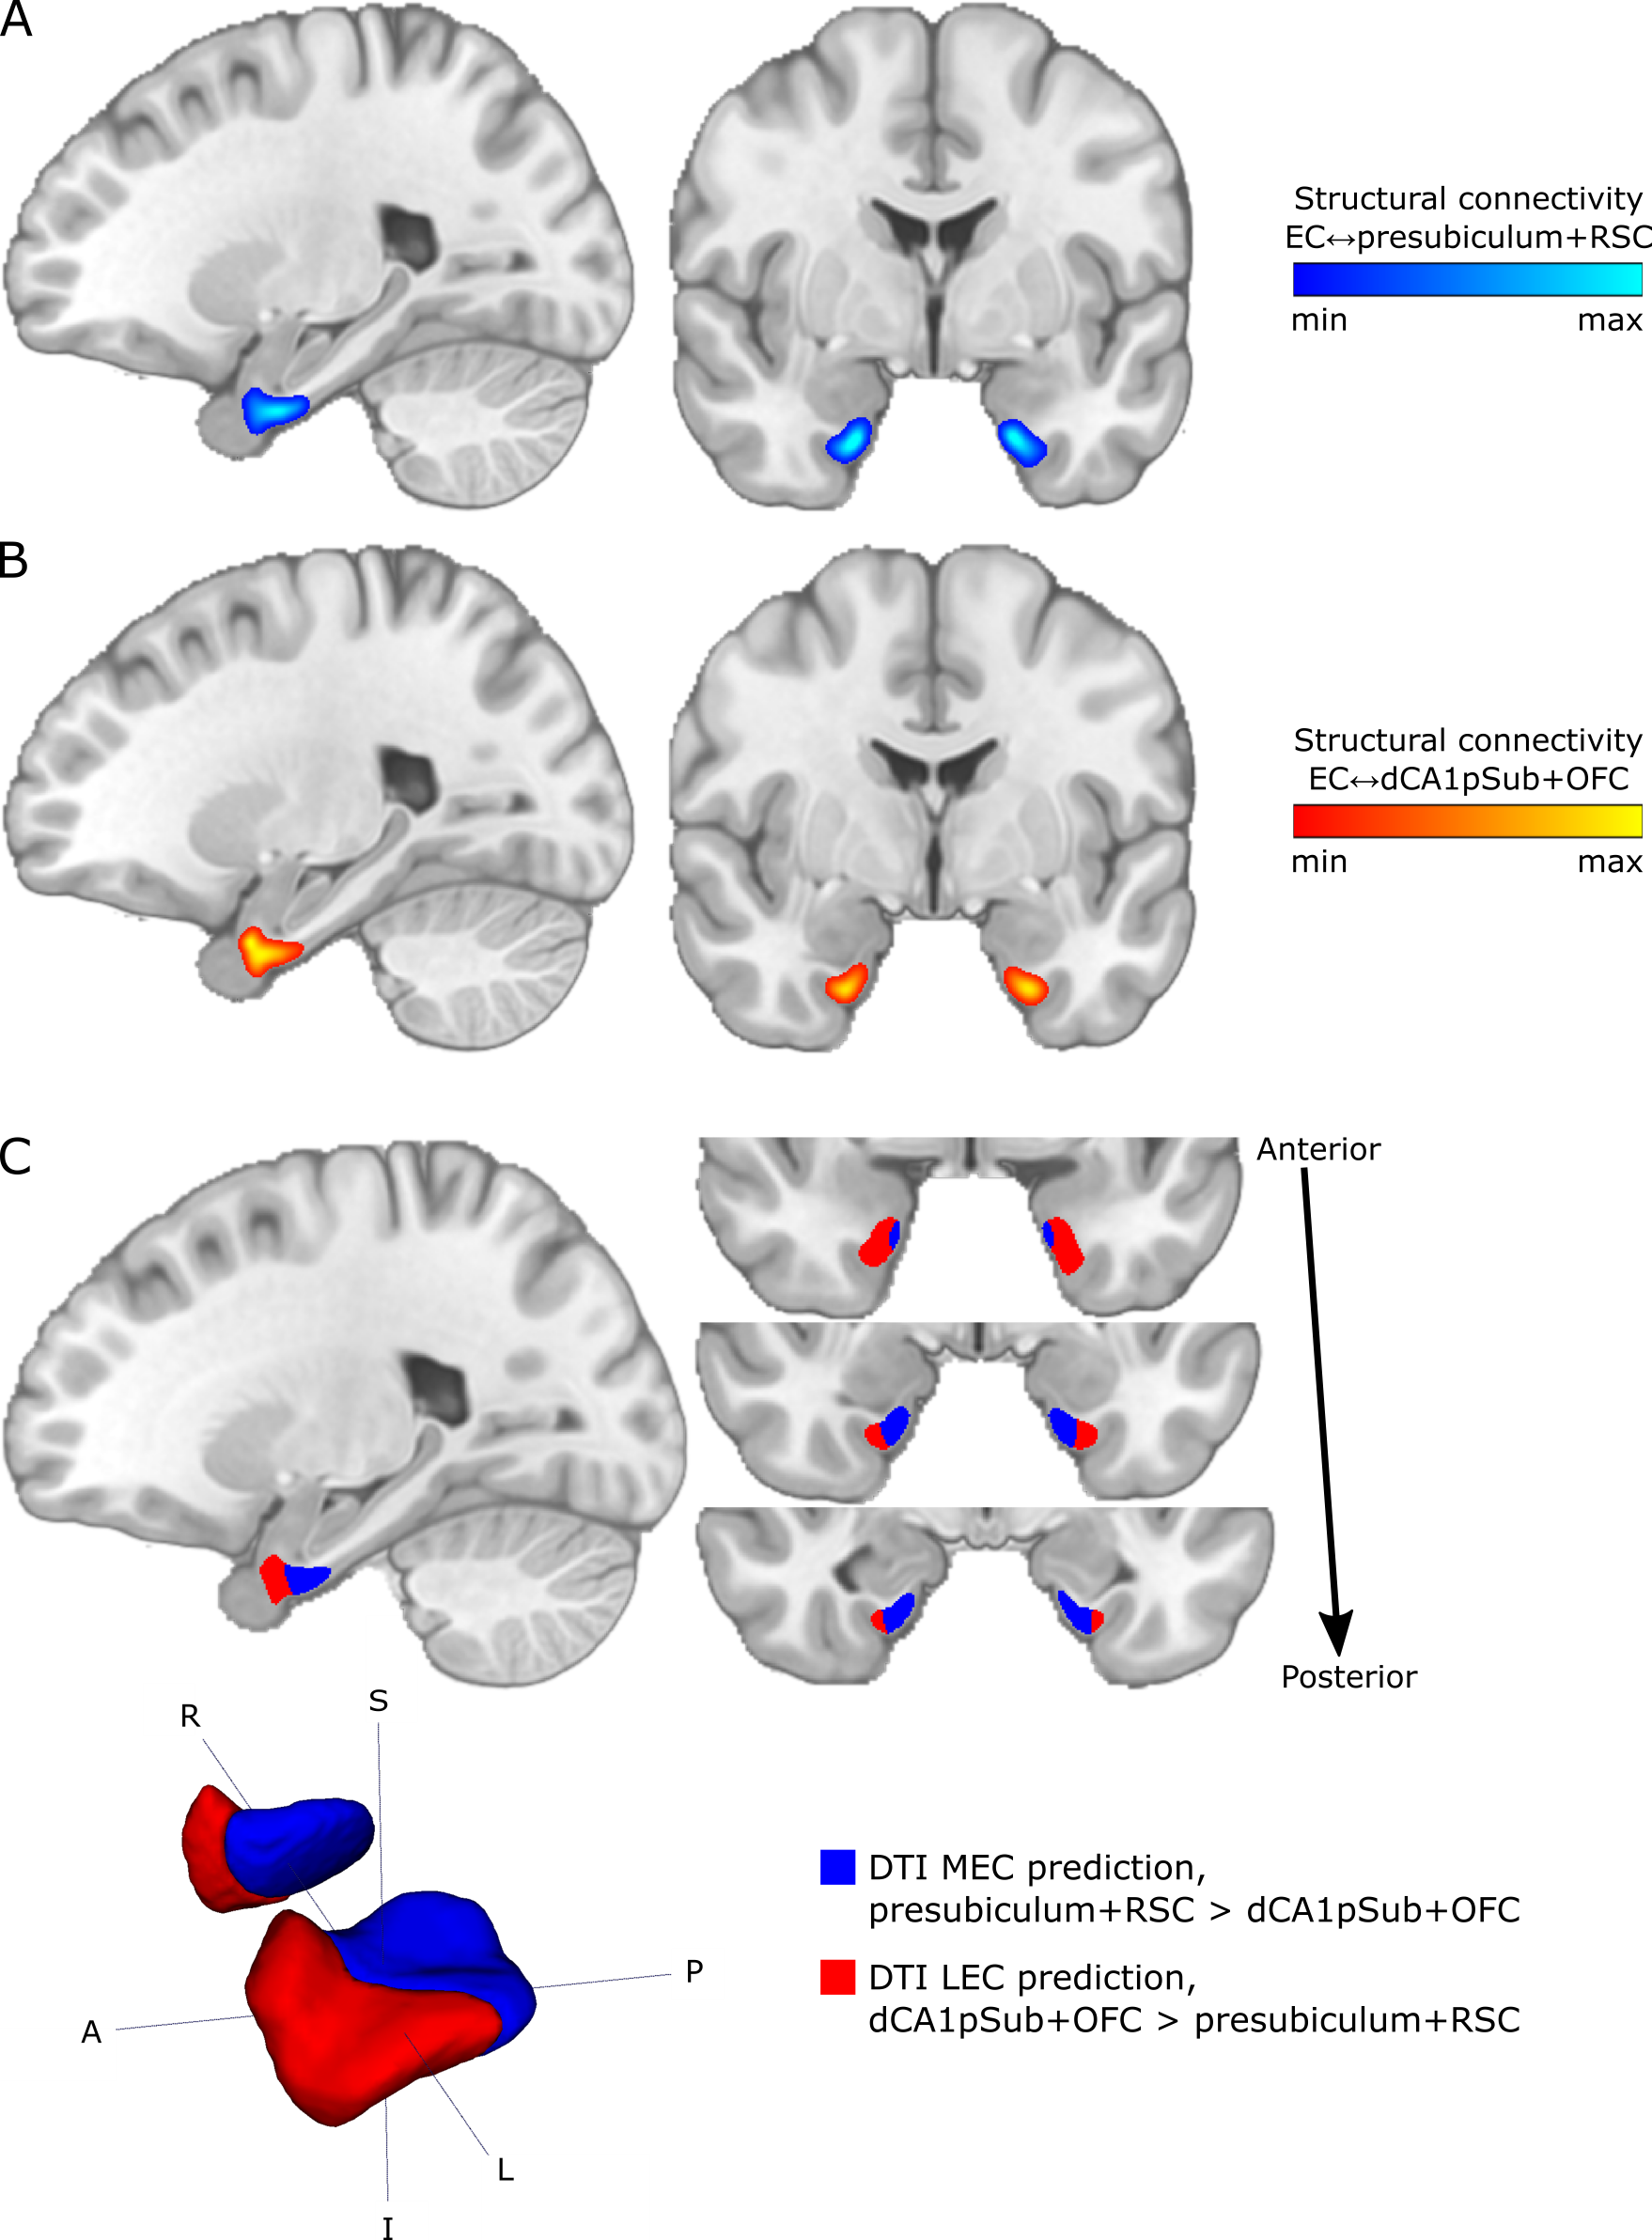
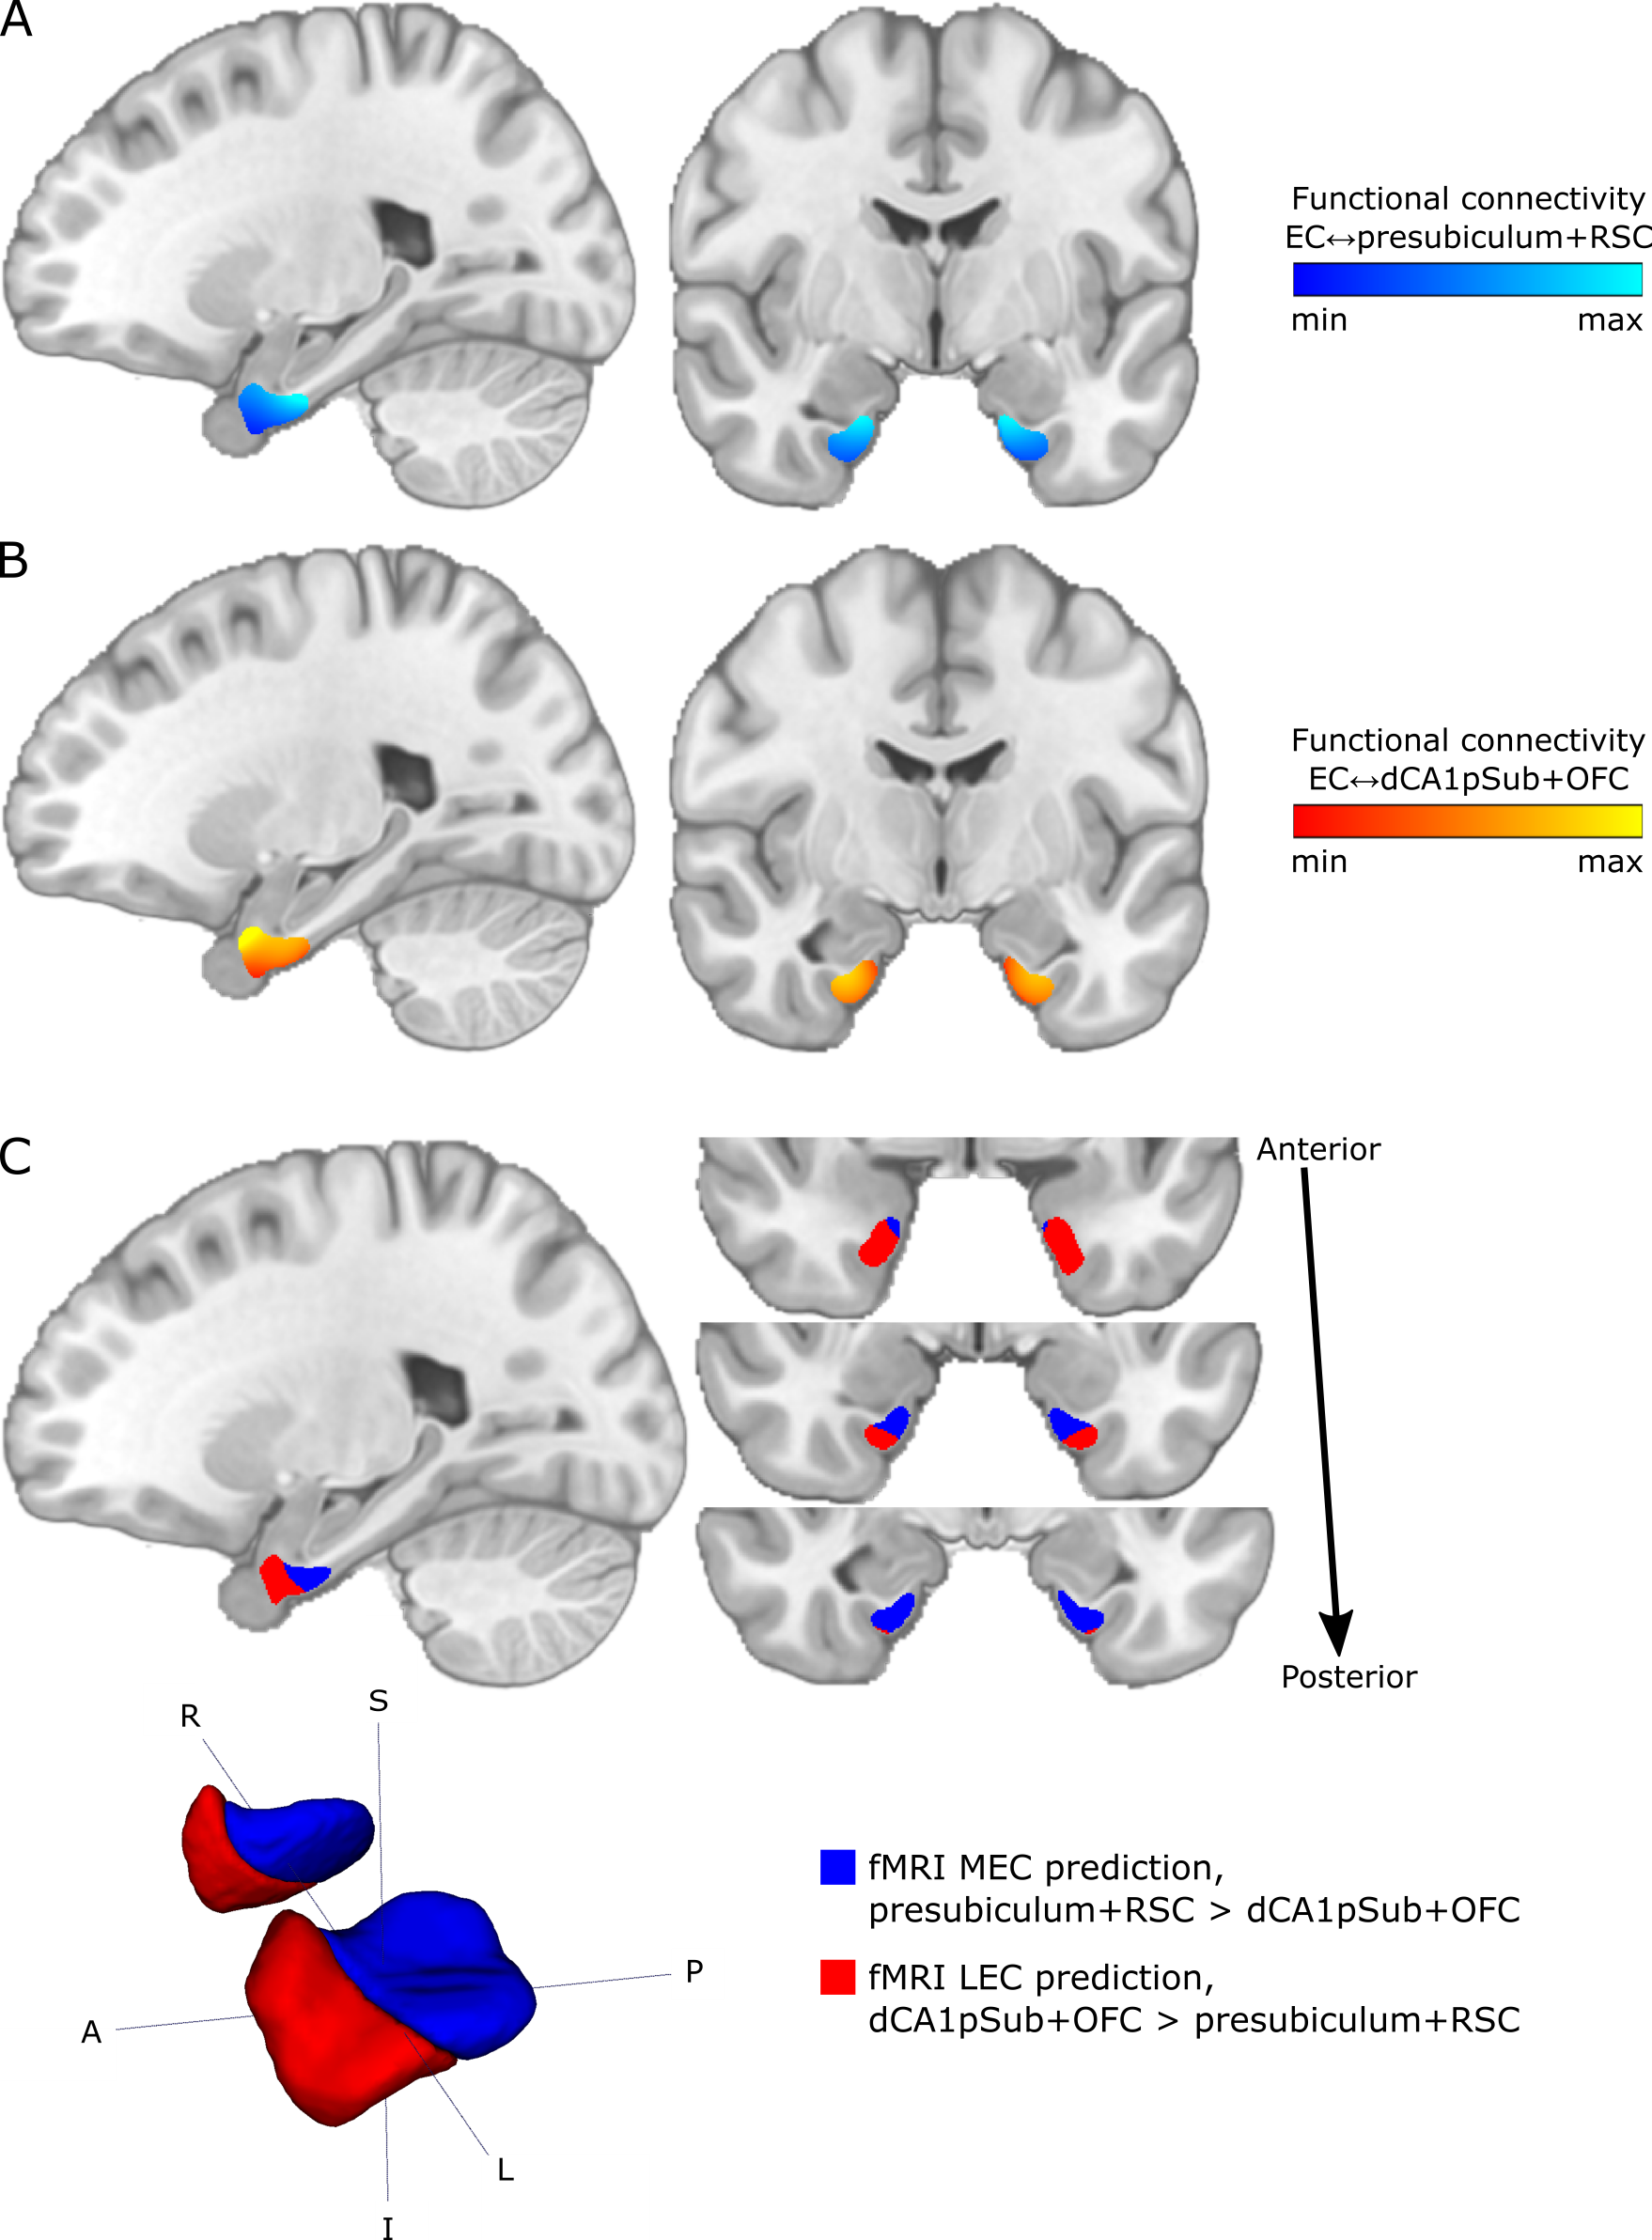
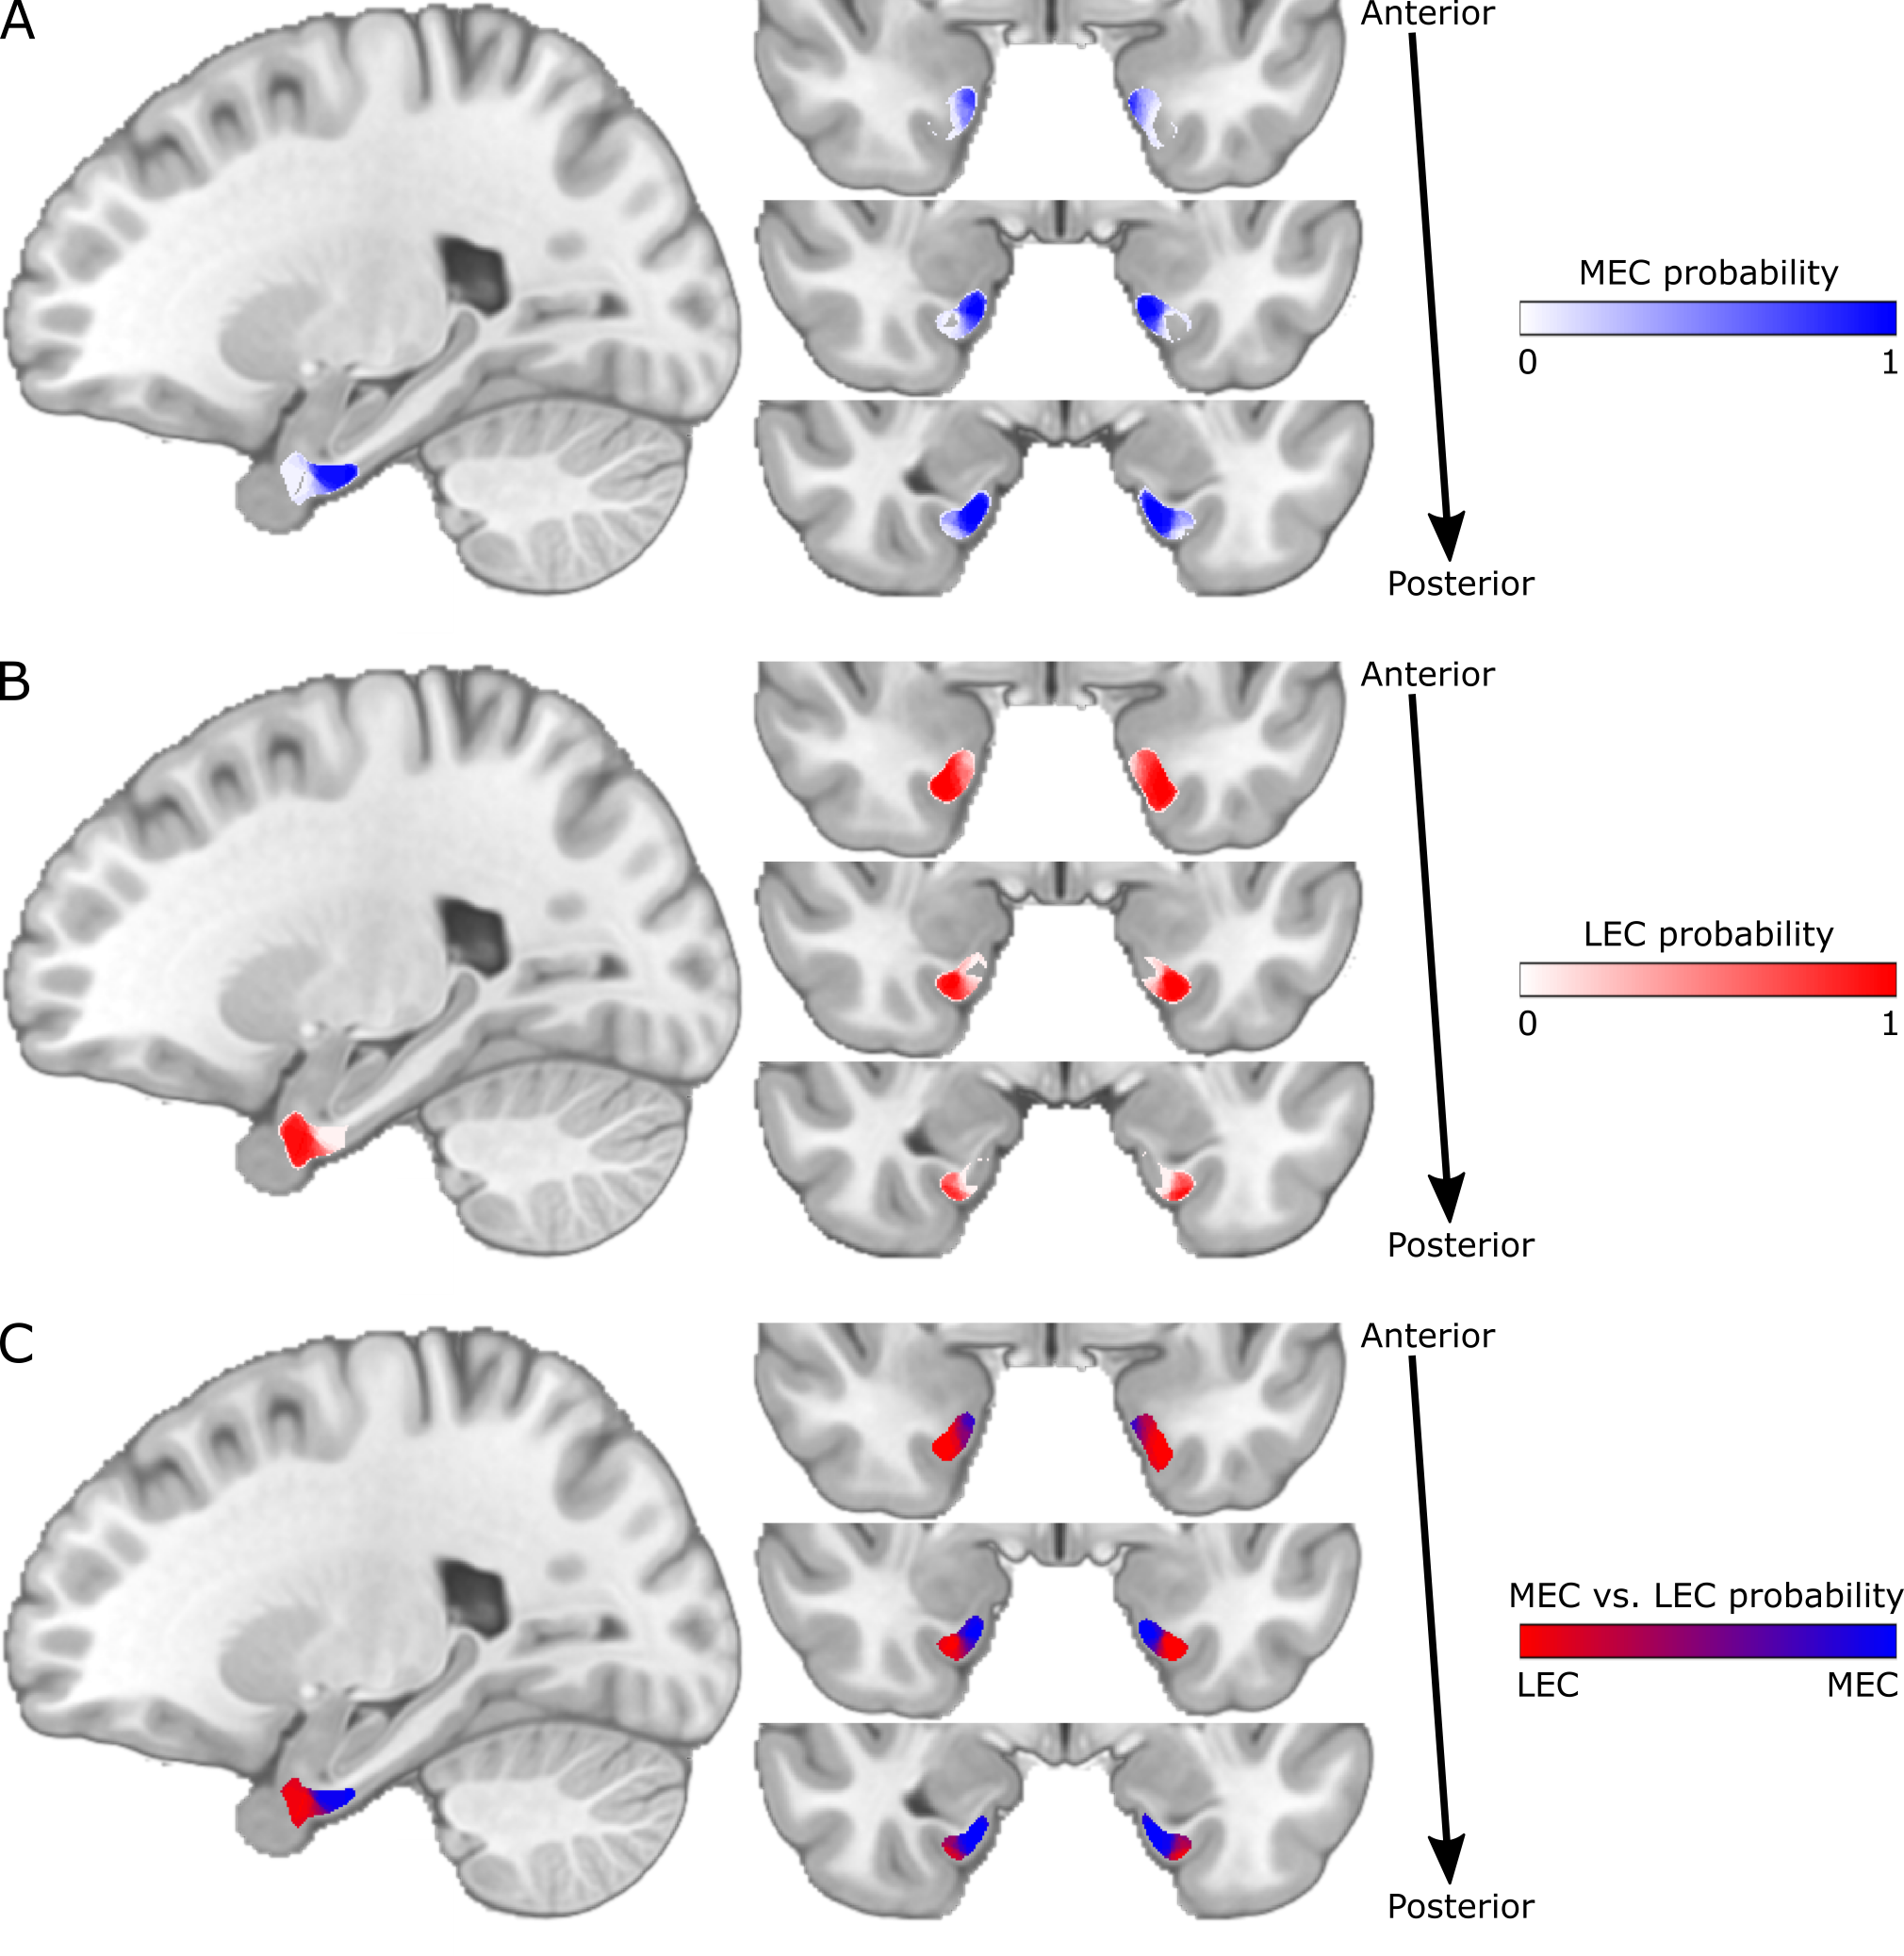
The structural and functional connectivity maps were used separately to segment the EC into the human MEC and LEC homologues. We defined MEC as being more strongly connected to presubiculum and RSC, whereas LEC was defined as being more strongly connected to dCA1pSub and OFC12,28-36. The segmentation was performed as a “hard segmentation”37,38 based on numerical preference to the connectivity maps, although while scaling the maps iteratively until the sizes of the resulting MEC and LEC were approximately equal. At last, total MEC and LEC probability maps were created by combining the structural and functional segmentation results.
Results
The structural connectivity maps and segmentation from using DTI are shown in Figure 1, while the functional connectivity maps and segmentation from using fMRI are shown in Figure 2. Figure 3 shows the total combined probability of MEC and LEC locations. Both the structural and functional connectivity approaches show relatively distinguishable differences between posteromedial and anterolateral parts of the EC.Discussion
Structural and functional connectivity analyses resulted in qualitatively similar patterns of connectivity to the other ROIs within the EC. While presubiculum and RSC were more strongly connected to posterior and medial EC, dCA1pSub and OFC were more strongly connected to anterior and lateral EC. Using DTI and fMRI to segment the EC subregions resulted in similar locations of the MEC and LEC homologues, namely posteromedial (pmEC) and anterolateral EC (alEC), respectively. This is qualitatively similar to the results from previous fMRI and DTI studies10-12.The fMRI-based segmentation showed a slightly higher degree of posterior-anterior subdivision of the EC than the DTI results, and a correspondingly lower degree of medial-lateral subdivision. It is uncertain whether these differences are a result of actual biological differences in structural vs. functional connectivity, or if they are caused by inherent differences or limitations in the modalities and analysis methods. Future studies should map the EC connectivity to even more brain regions, and optimize the DTI and fMRI acquisition protocols and analysis pipelines in order to reduce such uncertainties.
Conclusion
The results from this study show that both DTI and fMRI yield qualitatively similar subdivisions of the EC, and support the subdivision of the human EC into pmEC and alEC as suggested in previous studies. The MEC and LEC homologues defined in this study can be applied to cognitive and translational MRI studies, although they should be further validated across cohorts, imaging modalities and with a larger number of seed regions.Acknowledgements
We want to thank Menno P. Witter and Asgeir Kobro-Flatmoen for anatomical advice regarding the choices and delineations of ROIs, as well as topography of connections. We also want to thank Pål Erik Goa for assistance on MRI physics and image quality.
Data were provided by the Human Connectome Project, WU-Minn Consortium (Principal Investigators: David Van Essen and Kamil Ugurbil; 1U54MH091657) funded by the 16 NIH Institutes and Centers that support the NIH Blueprint for Neuroscience Research; and by the McDonnell Center for Systems Neuroscience at Washington University.
References
- Amaral DG, Insausti R, Cowan WM. The entorhinal cortex of the monkey: I. Cytoarchitectonic organization. J Comp Neurol 1987;264(3):326-355.
- Eichenbaum H, Yonelinas AP, Ranganath C. The Medial Temporal Lobe and Recognition Memory. Annu Rev Neurosci 2007;30(1):123-152.
- Moser Edvard I, Moser M-B. Grid Cells and Neural Coding in High-End Cortices. Neuron 2013;80(3):765-774.
- Tsao A, Sugar J, Lu L, Wang C, Knierim JJ, Moser M-B, Moser EI. Integrating time from experience in the lateral entorhinal cortex. Nature 2018;561(7721):57-62.
- Kerr KM, Agster KL, Furtak SC, Burwell RD. Functional neuroanatomy of the parahippocampal region: The lateral and medial entorhinal areas. Hippocampus 2007;17(9):697-708.
- Canto CB, Wouterlood FG, Witter MP. What Does the Anatomical Organization of the Entorhinal Cortex Tell Us? Neural Plast 2008;2008:381243.
- van Strien NM, Cappaert NLM, Witter MP. The anatomy of memory: an interactive overview of the parahippocampal–hippocampal network. Nature Reviews Neuroscience 2009;10(4):272-282.
- Schultz H, Sommer T, Peters J. Direct Evidence for Domain-Sensitive Functional Subregions in Human Entorhinal Cortex. The Journal of Neuroscience 2012;32(14):4716-4723.
- Reagh ZM, Yassa MA. Object and spatial mnemonic interference differentially engage lateral and medial entorhinal cortex in humans. Proceedings of the National Academy of Sciences 2014;111(40):E4264-E4273.
- Maass A, Berron D, Libby LA, Ranganath C, Düzel E. Functional subregions of the human entorhinal cortex. eLife 2015;4:e06426.
- Navarro Schröder T, Haak KV, Zaragoza Jimenez NI, Beckmann CF, Doeller CF. Functional topography of the human entorhinal cortex. eLife 2015;4:e06738.
- Syversen IF, Witter MP, Kobro-Flatmoen A, Goa PE, Navarro Schröder T, Doeller CF. Structural connectivity-based segmentation of the human entorhinal cortex. bioRxiv 2021:2021.07.16.452500. doi:10.1101/2021.07.16.452500. Accessed November 10, 2021.
- Braak H, Braak E. The human entorhinal cortex: normal morphology and lamina-specific pathology in various diseases. Neurosci Res 1992;15(1):6-31.
- Van Essen DC, Ugurbil K, Auerbach E, Barch D, Behrens TE, Bucholz R, Chang A, Chen L, Corbetta M, Curtiss SW, Della Penna S, Feinberg D, Glasser MF, Harel N, Heath AC, Larson-Prior L, Marcus D, Michalareas G, Moeller S, Oostenveld R, Petersen SE, Prior F, Schlaggar BL, Smith SM, Snyder AZ, Xu J, Yacoub E. The Human Connectome Project: a data acquisition perspective. Neuroimage 2012;62(4):2222-2231.
- Marcus D, Harwell J, Olsen T, Hodge M, Glasser M, Prior F, Jenkinson M, Laumann T, Curtiss S, Van Essen D. Informatics and Data Mining Tools and Strategies for the Human Connectome Project. Front Neuroinform 2011;5(4).
- Feinberg DA, Moeller S, Smith SM, Auerbach E, Ramanna S, Glasser MF, Miller KL, Ugurbil K, Yacoub E. Multiplexed Echo Planar Imaging for Sub-Second Whole Brain FMRI and Fast Diffusion Imaging. PLoS One 2010;5(12):e15710.
- Sotiropoulos SN, Moeller S, Jbabdi S, Xu J, Andersson JL, Auerbach EJ, Yacoub E, Feinberg D, Setsompop K, Wald LL, Behrens TEJ, Ugurbil K, Lenglet C. Effects of image reconstruction on fiber orientation mapping from multichannel diffusion MRI: Reducing the noise floor using SENSE. Magn Reson Med 2013;70(6):1682-1689.
- Moeller S, Yacoub E, Olman CA, Auerbach E, Strupp J, Harel N, Uğurbil K. Multiband multislice GE-EPI at 7 tesla, with 16-fold acceleration using partial parallel imaging with application to high spatial and temporal whole-brain fMRI. Magn Reson Med 2010;63(5):1144-1153.
- Setsompop K, Gagoski BA, Polimeni JR, Witzel T, Wedeen VJ, Wald LL. Blipped-controlled aliasing in parallel imaging for simultaneous multislice echo planar imaging with reduced g-factor penalty. Magn Reson Med 2012;67(5):1210-1224.
- Xu J, Moeller S, Strupp J, Auerbach EJ, Xhen L, Feinberg DA, Ugurbil K, Yacoub E. Highly accelerated whole brain imaging using aligned-blipped-controlled-aliasing multiband EPI. Proc Int Soc Mag Reson Med. Volume 202012. p 2306.
- Glasser MF, Sotiropoulos SN, Wilson JA, Coalson TS, Fischl B, Andersson JL, Xu J, Jbabdi S, Webster M, Polimeni JR, Van Essen DC, Jenkinson M. The minimal preprocessing pipelines for the Human Connectome Project. Neuroimage 2013;80:105-124.
- Iglesias JE, Augustinack JC, Nguyen K, Player CM, Player A, Wright M, Roy N, Frosch MP, McKee AC, Wald LL, Fischl B, Van Leemput K. A computational atlas of the hippocampal formation using ex vivo, ultra-high resolution MRI: Application to adaptive segmentation of in vivo MRI. Neuroimage 2015;115:117-137.
- Sotiropoulos SN, Hernández-Fernández M, Vu AT, Andersson JL, Moeller S, Yacoub E, Lenglet C, Ugurbil K, Behrens TEJ, Jbabdi S. Fusion in diffusion MRI for improved fibre orientation estimation: An application to the 3T and 7T data of the Human Connectome Project. Neuroimage 2016;134:396-409.
- Hernández M, Guerrero GD, Cecilia JM, García JM, Inuggi A, Jbabdi S, Behrens TE, Sotiropoulos SN. Accelerating fibre orientation estimation from diffusion weighted magnetic resonance imaging using GPUs. PLoS One 2013;8(4):e61892.
- Behrens TE, Woolrich MW, Jenkinson M, Johansen-Berg H, Nunes RG, Clare S, Matthews PM, Brady JM, Smith SM. Characterization and propagation of uncertainty in diffusion-weighted MR imaging. Magn Reson Med 2003;50(5):1077-1088.
- Behrens TE, Johansen-Berg H, Jbabdi S, Rushworth MF, Woolrich MW. Probabilistic diffusion tractography with multiple fibre orientations: What can we gain? Neuroimage 2007;34(1):144-155.
- Hernandez-Fernandez M, Reguly I, Jbabdi S, Giles M, Smith S, Sotiropoulos SN. Using GPUs to accelerate computational diffusion MRI: From microstructure estimation to tractography and connectomes. Neuroimage 2019;188:598-615.
- Caballero-Bleda M, Witter MP. Regional and laminar organization of projections from the presubiculum and parasubiculum to the entorhinal cortex: an anterograde tracing study in the rat. J Comp Neurol 1993;328(1):115-129.
- Honda Y, Ishizuka N. Organization of connectivity of the rat presubiculum: I. Efferent projections to the medial entorhinal cortex. J Comp Neurol 2004;473(4):463-484.
- Witter MP, Amaral DG. Entorhinal cortex of the monkey: V. Projections to the dentate gyrus, hippocampus, and subicular complex. J Comp Neurol 1991;307(3):437-459.
- Witter MP, Amaral DG. The entorhinal cortex of the monkey: VI. Organization of projections from the hippocampus, subiculum, presubiculum, and parasubiculum. J Comp Neurol 2021;529(4):828-852.
- Hoover WB, Vertes RP. Anatomical analysis of afferent projections to the medial prefrontal cortex in the rat. Brain Struct Funct 2007;212(2):149-179.
- Jones BF, Witter MP. Cingulate cortex projections to the parahippocampal region and hippocampal formation in the rat. Hippocampus 2007;17(10):957-976.
- Kondo H, Witter MP. Topographic organization of orbitofrontal projections to the parahippocampal region in rats. J Comp Neurol 2014;522(4):772-793.
- Saleem KS, Kondo H, Price JL. Complementary circuits connecting the orbital and medial prefrontal networks with the temporal, insular, and opercular cortex in the macaque monkey. J Comp Neurol 2008;506(4):659-693.
- Wyss JM, Van Groen T. Connections between the retrosplenial cortex and the hippocampal formation in the rat: a review. Hippocampus 1992;2(1):1-11.
- Behrens TE, Johansen-Berg H, Woolrich MW, Smith SM, Wheeler-Kingshott CA, Boulby PA, Barker GJ, Sillery EL, Sheehan K, Ciccarelli O, Thompson AJ, Brady JM, Matthews PM. Non-invasive mapping of connections between human thalamus and cortex using diffusion imaging. Nat Neurosci 2003;6(7):750-757.
- Johansen-Berg H, Behrens TE, Robson MD, Drobnjak I, Rushworth MF, Brady JM, Smith SM, Higham DJ, Matthews PM. Changes in connectivity profiles define functionally distinct regions in human medial frontal cortex. Proc Natl Acad Sci U S A 2004;101(36):13335-13340.
Figures