0262
Normative modelling detects abnormal functional connectivity in schizophrenia1Faculty of Sciences of the University of Lisbon, Lisboa, Portugal
Synopsis
Machine learning (ML) applications on the diagnosis of neuropsychiatric disorders (NPD) have not reached clinical practice yet, as the continuous spectrum of NPD demands more complex, non-binary classification approaches. Herein, a ML-based normative model was created from healthy subjects, which “fails” when tested on schizophrenia patients. In particular, abnormal functional connectivity patterns were found in such patients, in agreement to what has been described in the literature. Moreover, a clustering method and analysis at the individual level indicate that subgroups may exist within the schizophrenia spectrum, suggesting that a personalized and precision-based diagnosis is within reach for such NPD.
Introduction
The diagnosis of neuropsychiatric disorders (NPD), such as schizophrenia, is still exclusively dependent on the clinical evaluation of the patient’s symptoms1,2,3. These disorders are often related, which leads to an unprecise diagnosis, and as a consequence, the therapeutic approaches are not always successful. Researchers have been trying to apply machine learning methods based on binary classification, in order to improve the diagnosis of NPD4. However, to face the continuous spectrum of NPD, broader proposals, such as normative modelling5, should be applied. This emerging method is here used to evaluate how patients deviate from an expected pattern learned from a cohort of healthy subjects.Methods
DataResting-state functional MRI (rs-fMRI) data from three different databases were used to create and evaluate a normative model of healthy subjects. After proceeding with data selection, by restricting scan parameters variations, the selected data was split into three different sets of subjects:
Train set: rs-fMRI data from 366 healthy subjects from the CORR6 and UCLA7 databases
Dependent test set: rs-fMRI data from the UCLA database7, consisting of 39 healthy subjects (H-UCLA) and 47 schizophrenia subjects (S-UCLA).
Independent test set: rs-fMRI data from the COBRE database8, containing 70 healthy subjects (H-COBRE), and 49 schizophrenia subjects (S-COBRE).
Data Processing
First, all rs-fMRI data were trimmed to 150 time points. Then, conventional fMRI preprocessing steps were performed. Afterwards, single-session independent component analysis was run, and the FSL-FIX tool was used to clean noise and artifacts from rs-fMRI data. Each cleaned 4D preprocessed functional image underwent registration to the MNI152 standard space. Finally, the 14 functional brain networks (FBN) identified in the study from Shirer et al9 were used as a template for dual regression, for extracting the Blood Oxygen Level-Dependent (BOLD) time series. The Pearson’s correlation coefficient between the time series of each FBN was calculated. To avoid redundancy, half of each network matrix was discarded, and the matrix was converted into a row vector of 91 elements, corresponding to the correlations between pairs of FBN.
Normative Model
The normative model is here trained only on healthy subjects and is tested in both healthy subjects and schizophrenia patients. The intention is that the model performs worse in reconstructing data from schizophrenia subjects than data from healthy subjects. An autoencoder consisting of 3 hidden layers (91-46-13-46-91) was the selected normative model architecture. The activation function of the hidden layers was the leaky rectified linear unit. L2 regularization parameter of 10-5 and a dropout value of 0.5 were applied. Mean squared error (MSE) was the loss function, the weights were initialized following Xavier initialization, and the model was trained for 1000 epochs, using Adam optimization, with a learning rate of 0.0005.
For each group test, the MSE was calculated for each of the 91 features (correlations between pairs of FBN). A further step was to subtract the MSE calculated vector of the H-UCLA, to each of the other groups of subjects, to evaluate which features were most different when compared to a dependent test set of healthy subjects. Additionally, a difference vector was determined for each subject, by calculating the absolute value of the difference between the reconstruction vector and the vector that was inputted in the autoencoder. The differences vectors were used as input for the fuzzy c-means clustering method.
Discussion and Results
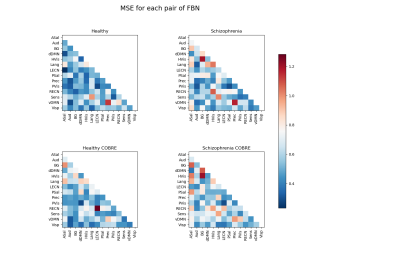
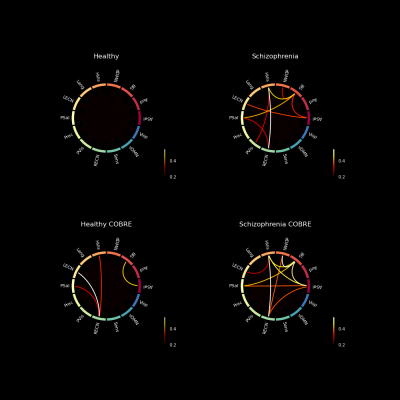
The reconstruction error appears to be higher for the group of schizophrenia patients, than for the healthy subjects. Several features that are worse reconstructed for the S-UCLA, are also evident on S-COBRE (Figure 1). This demonstrates that the normative model can suitably detect abnormal functional connectivity patterns of schizophrenia patients.The subtraction of the H-UCLA vector to the MSE vector S-UCLA highlighted 8 abnormal features that are characteristic of the schizophrenia dependent test set (Figure 2). To perform clustering, several combinations of those features with different numbers of clusters were tested.
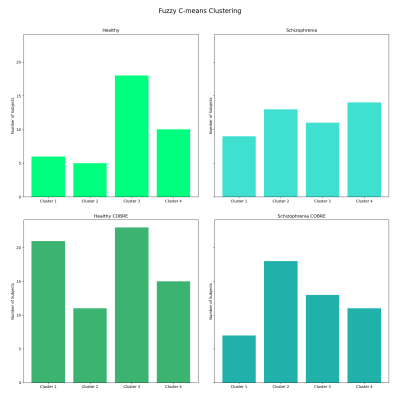
In the end, a model containing 4 clusters, fed by the features 5 (BG-dDMN), 8 (HVis-BG), 23 (BG-PSal), and 49 (HVis-RECN) was selected to be the best in discriminating H-UCLA subjects from S-UCLA patients. In particular, cluster 2 seems to be more schizophrenia-specific and cluster 3 appears to be characteristic of healthy subjects. Nevertheless, the clustering shows that subgroups may exist and that differentiating schizophrenia subjects from healthy subjects is complex (Figure 3).
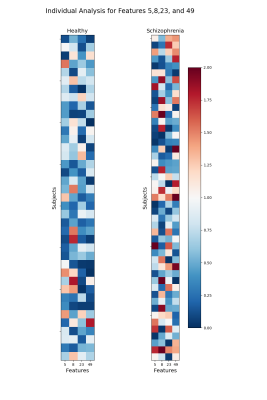
The features that were used for the clustering process were also poorly reconstructed for the S-COBRE, which may explain the performance of the model on the COBRE database. Those correlations of pairs of FBN that appear to be characteristic of schizophrenia patients are in line with previous studies10,11,12.. Moreover, figure 4 shows the intensities of the error reconstruction of those pairs of FBN, for each subject. The results indicate that schizophrenia patients show a higher error of reconstruction and that the pattern is not constant among individuals, which again suggests that subgroups may be present.
Conclusion
Here a promising alternative approach to the common binary-based classification was shown. Considering that NPD develop over a continuous spectrum, a precision-based approached focused on the specific functional network changes of individual patients, could to be more advantageous than a more general group-based diagnostic classification.Acknowledgements
This was work was financially supported by Fundaçao para a Ciência e Tecnologia (FCT) under the projects UID/BIO/00645/2017 and DSAIPA/DS/0065/2018References
1. M. Bajouco, D. Mota, M. Coroa, S. Caldeira, V. Santos, and N. Madeira, “The quest for biomarkers in Schizophrenia: from neuroimaging to machine learning,” International Journal of Clinical Neurosciences and Mental Health, p. S03, 11 2017.
2. R. de Filippis, E. A. Carbone, R. Gaetano, A. Bruni, V. Pugliese, C. Segura-Garcia, and P. De Fazio, “Machine learning techniques in a structural and functional MRI diagnostic approach in schizophrenia: a systematic review,” Neuropsychiatric Disease and Treatment, vol. Volume 15, pp. 1605–1627, 6 2019.
3. M. S. García-Gutíerrez, F. Navarrete, F. Sala, A. Gasparyan, A. Austrich-Olivares, and J. Man-zanares, “Biomarkers in Psychiatry: Concept, Definition, Types and Relevance to the Clinical Reality” 5 2020.
4. S. Vieira, W. H. Pinaya, and A. Mechelli, “Using deep learning to investigate the neuroimaging correlates of psychiatric and neurological disorders: Methods and applications,” 3 2017.
5. W. Pinaya, C. Scarpazza, R. Garcia-Dias, S. Vieira, L. Baecker, P. da Costa, A. Redolfi, G. Frisoni, M. Pievani, V. Calhoun, J. Sato, and A. Mechelli, “Normative modelling using deep autoencoders: a multi-cohort study on mild cognitive impairment and Alzheimer’s disease,”bioRxiv,p. 2020.02.10.931824, 2 2020.
6. “Consortium for Reliability and Reproducibility (CoRR) — Consortium for Reliability and Reproducibility (CoRR) documentation.” Accessed October 10, 2020 http://fcon_1000.projects.nitrc.org/indi/CoRR/html/index.html#
7. “UCLA Consortium for Neuropsychiatric Phenomics LA5c Study.” https://www.openfmri.org/dataset/ds000030/ Accessed January 17, 2021
8. “COBRE Phase 3 — The Mind Research Network (MRN).” https://www.mrn.org/common/cobre-phase-3 Accessed February 8, 2021
9. W. R. Shirer, S. Ryali, E. Rykhlevskaia, V. Menon, and M. D. Greicius, “Decoding subject-driven cognitive states with whole-brain connectivity patterns,” Cerebral Cortex, vol. 22, pp. 158–165, 12012.
10. P. Li, T. T. Fan, R. J. Zhao, Y. Han, L. Shi, H. Q. Sun, S. J. Chen, J. Shi, X. Lin, and L. Lu, “Altered Brain Network Connectivity as a Potential Endophenotype of Schizophrenia,” Scientific Reports 2017 7:1, vol. 7, pp. 1–9, 7 2017.
11. J. A. Bernard, C. E. Russell, R. E. Newberry, J. R. Goen, and V. A. Mittal, “Patients with schizophrenia show aberrant patterns of basal ganglia activation: Evidence from ALE meta-analysis,” NeuroImage: Clinical, vol. 14, pp. 450–463, 1 2017.
12. Y. Wang, W. Tang, X. Fan, J. Zhang, D. Geng, K. Jiang, D. Zhu, Z. Song, Z. Xiao, and D. Liu, “Resting-state functional connectivity changes within the default mode network and the salience network after antipsychotic treatment in early-phase schizophrenia,” Neuropsychiatric disease and treatment, vol. 13, pp. 397–406, 2 2017.
Figures

Figure 1 – MSE vectors of each group reshaped into lower triangular matrices. MSE is predominantly higher on schizophrenia patients than on healthy subjects. A similarity between the S-UCLA and S-COBRE matrices is observed.
Note: ASal-Anterior Salience; Aud-Auditory; BG-Basal Ganglia; dDMN-Dorsal Default Mode; HVis-Higher Visual; Lang-Language; LECN-Left Executive Control; PSal-Posterior Salience; Prec-Precuneus; PVis-Primary Visual; RECN-Right Executive Control; Sens-Sensorimotor; vDMN-Ventral Default Mode; Visp-Visuospatial functional brain networks.


