0259
Spin-echo line-scanning at 7T1Spinoza Centre for Neuroimaging, Amsterdam, Netherlands, 2VU University, Amsterdam, Netherlands, 3Radiology, University Medical Centre, Utrecht, Netherlands
Synopsis
We implemented spin-echo line-scanning (SELINE) fMRI through a simple rotation of the spin-echo refocusing gradient to a plane perpendicular to the excited slice and removing the phase encode gradient. This technique promises a combination of high spatio-temporal resolution and specificity of functional responses to the microvasculature. We compared SELINE data to the corresponding gradient-echo version (GELINE). We demonstrate that SELINE showed much improved line selection compared to GELINE, albeit at the cost of a significant drop in functional sensitivity. The low functional sensitivity needs to be addressed before SELINE can be applied.
Introduction
Neurons cluster into sub-millimeter columnar and laminar structures and neural activity occurs at millisecond resolution. The recently described gradient-echo line-scanning (GELINE) sequence achieved very high resolution in humans1,2 across cortical depth (250μm) and time (~200ms), by sacrificing volume coverage and resolution along the cortical surface. This high spatiotemporal resolution, when combined with a method specific to microvasculature, would allow us to isolate microvessel responses and to characterize the distribution of blood flow and laminar fMRI profiles across cortical depth. Spin-echo (SE) BOLD contrast is ideal for this purpose, since it is the technique that is most dominated by microvasculature signal changes3. Moreover, spin-echo line-scanning (SELINE) offers beam excitation without the outer-volume suppression (OVS) pulses, which are necessary in the case of GELINE, through a simple rotation of the plane for the refocusing gradient, to a perpendicular plane. Here, we present the first implementation of SELINE for BOLD fMRI in humans at 7T. We compared the performance of SELINE with a GELINE acquisition in term of temporal signal-to-noise ratio (tSNR) and BOLD sensitivity.Methods
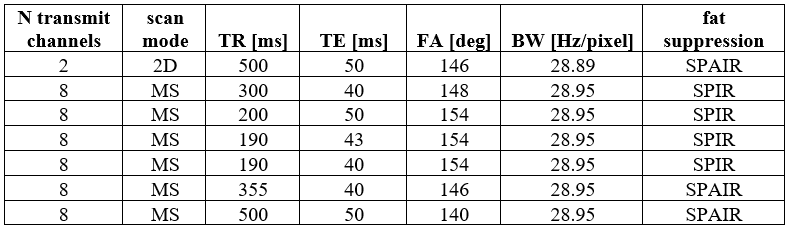
We scanned 4 healthy participants at 7T MRI system (Philips, Netherlands) equipped with a 2Tx/32Rx head coil (Nova Medical, USA) and 1 participant with an 8Tx/32Rx. In addition, multiple pilots were conducted to optimize the parameters used here (Fig.1). We modified a 2D spin-echo sequence for the SELINE data acquisition (Fig.2a) where the phase-encoding in the direction perpendicular to the line was turned off: line resolution=250μm, TR=500ms, TE=50ms, fa=146°, array size=720, line thickness=2.5mm, in-plane line width=5mm, fat suppression using SPAIR. The 180° refocusing pulse was a sinc pulse with duration of 2.8ms and its gradient was moved to the phase encoding direction, to refocus only a single beam of the excited slice (Fig.2b). Pairs of crusher gradients (25mT/m, duration=1.9ms) were added around the refocusing gradient in every direction, to avoid free induction decay artefacts, while spoilers introduced at the end of the sequence eliminated residual transverse magnetization. GELINE data acquisition was based on the method we previously described1, i.e. using OVS pulses for line excitation. A TR of 500ms, however, was used to match the SELINE acquisition. SELINE and GELINE data were reconstructed as described in Raimondo et al1, and we also applied a NORDIC-based denoising step4,5. For both acquisitions, the line was positioned perpendicular to the visual cortex as much as possible. We acquired one run of functional data with each protocol, using a block design visual task consisting of a 20Hz flickering checkerboard, presented for 10s on/off. Runs lasted 6 minutes and 20s, starting with 10s baseline. For one subject 2 GELINE runs and 4 SELINE runs were acquired to increase the SNR. Functional data were analyzed using a general linear model (GLM) approach. We also calculated the tSNR across the line. Additionally, we acquired matched 2D gradient-echo (GE) and SE-EPI image series at lower spatio-temporal resolution (1.5mm isotropic, TR=2.5s), to compare functional runs of single slices and line selection images with the same visual task.Results
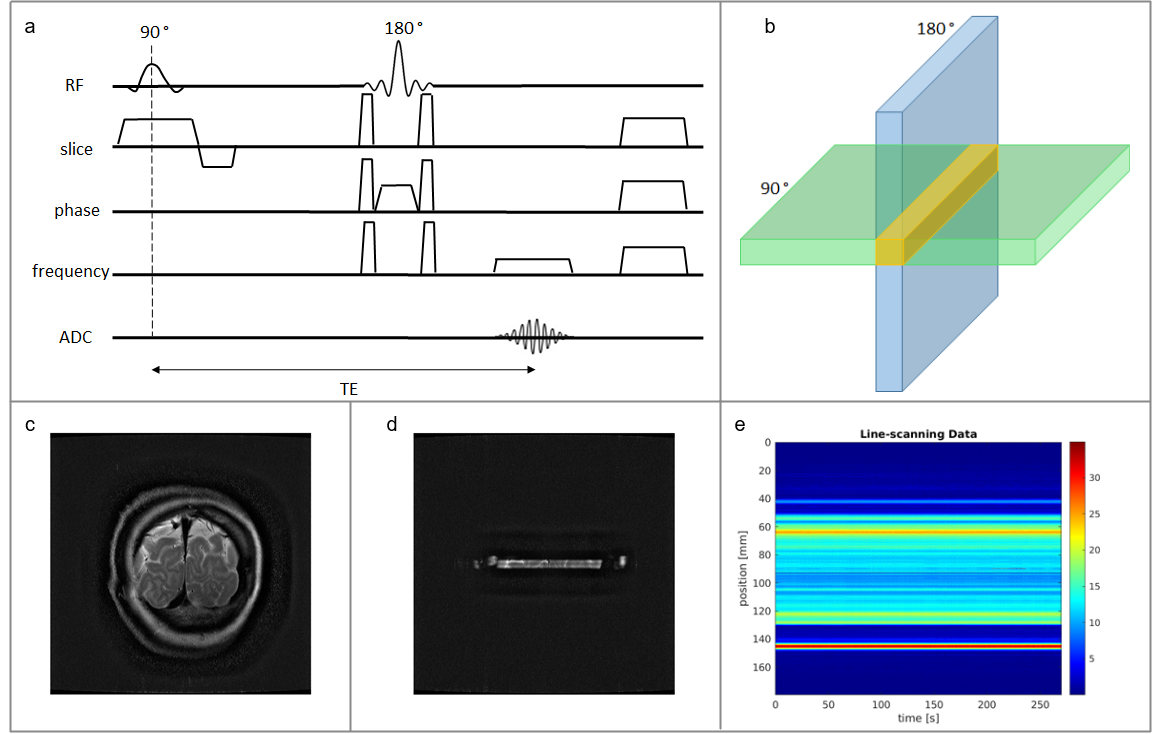
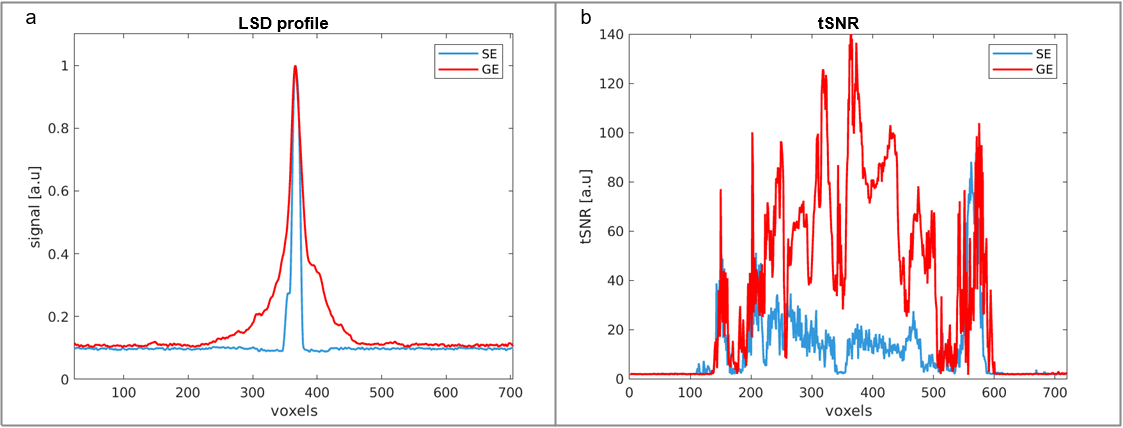
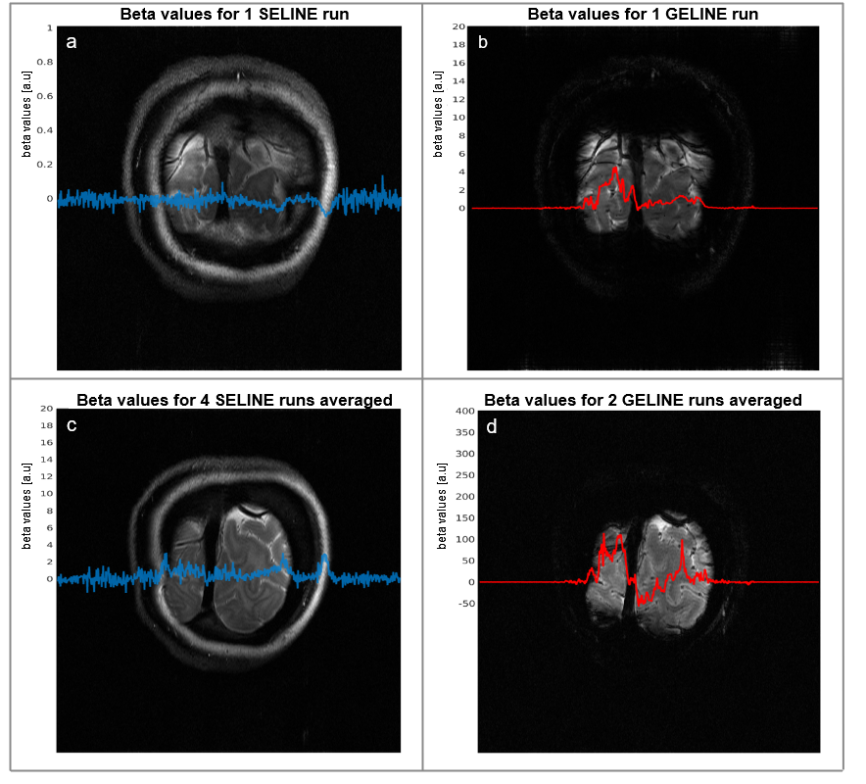
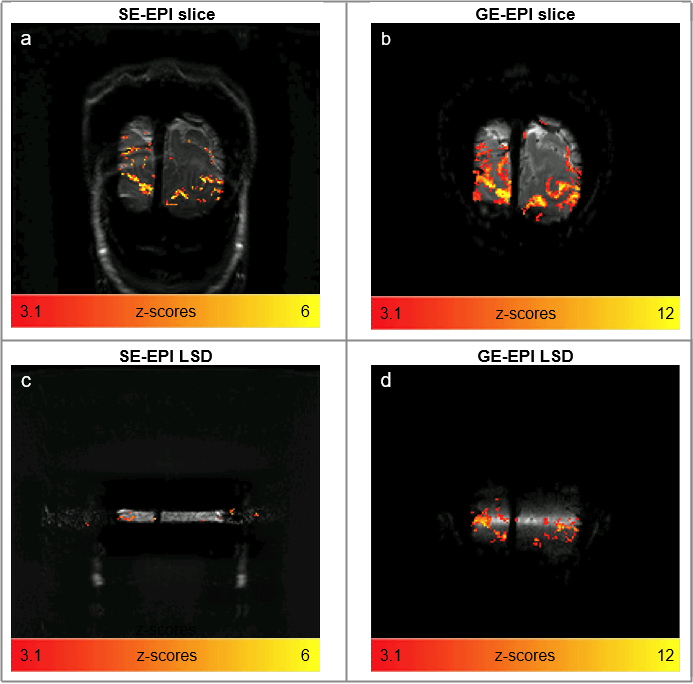
Fig.2 shows the SELINE sequence (a), the signal-yielding area (b), an example coronal slice (c), the line signal distribution (LSD) image (d), with signal coming from the intersection of excited and refocused planes, and an example line-scanning acquisition (e). In Fig.3a, a representative participant’s LSD profile is shown for SE and GE acquisition, obtained by averaging over all the voxels in the read-out direction of an LSD image. Notice the much sharper profile of the SELINE. Fig.3b shows the tSNR for SELINE and GELINE for the same subject. SELINE tSNR values were consistently lower than GELINE tSNR, likely driven by TE as well as differences in the profile area. SELINE acquisitions yielded very low functional responses. Fig.4 shows the beta values obtained from the GLM of 1 run of SELINE (a) and GELINE (b) and for the average of respectively 2 and 4 runs (c and d), overlaid on the acquired slices for SE and GE. Finally, Fig.5 shows the activation maps of the SE and GE-EPI slices and LSD images. SE-EPI showed lower functional responses than GE-EPI, as expected6. LSD functional images confirmed good beam selection, but also highlight the limited available functional signal in SELINE.Discussion & Conclusion
We reported the first implementation of SELINE in humans at 7T and showed improved line selection without the need for OVS pulses. The improved line definition, and also the inherently lower sensitivity of SE-BOLD, led to lower tSNR and beta values compared to GELINE. We could not detect any task-driven activation in the SELINE, while GELINE showed clear activation pattern in visual cortex. In the lower resolution functional images (Fig.5), activation is barely detectable on the SE-LSD images. The SELINE acquisition has even lower SNR due to the smaller voxel volume (1.8 times lower). Hence, we conclude that the implementation of SELINE currently lacks adequate sensitivity for line-scanning fMRI. We argue that SE has a high potential for line-scanning applications due to its innate properties of line selection and microvascular selective functional contrast. Future work will aim at improving the SELINE sensitivity by incorporating a multi-echo readout, high-density surface coils7 and averaging across more than 4 runs.Acknowledgements
This study was supported by the Royal Netherlands Academy of Arts and Sciences Research Fund 2018 (KNAW BDO/3489) and the Visiting Professors Programme 2017 (KNAW WF/RB/3781) granted to the Spinoza Centre for Neuroimaging.References
1. Raimondo L, Knapen T, Oliveira ĺcaro AF, Yu X, Dumoulin SO, van der Zwaag W, et al. A line through the brain: implementation of human line-scanning at 7T for ultra-high spatiotemporal resolution fMRI. J Cereb Blood Flow Metab, 2021
2. Morgan AT, Nothnagel N, Petro LucyS, Goense J, Muckli L. High-resolution line-scanning reveals distinct visual response properties across human cortical layers. bioRxiv, 2020
3. Siero JCW, Ramsey NF, Hoogduin H, Klomp DWJ, Luijten PR, Petridou N. BOLD Specificity and Dynamics Evaluated in Humans at 7 T: Comparing Gradient-Echo and Spin-Echo Hemodynamic Responses. PLoS ONE, 2013
4. Vizioli L, Moeller S, Dowdle L, Akçakaya M, De Martino F, Yacoub E, et al. Lowering the thermal noise barrier in functional brain mapping with magnetic resonance imaging. Nat Commun, 2021
5. Passarinho C, Raimondo L, Heij J, Knapen T, Dumoulin S, Siero JCW, van der Zwaag W. Noise removal in Line-scanning fMRI. ESMRMB, 2021
6. Han S, Eun S, Cho H, Uludaǧ K, Kim S-G. Improvement of sensitivity and specificity for laminar BOLD fMRI with double spin-echo EPI in humans at 7 T. NeuroImage, 2021
7. Petridou N, Italiaander M, van de Bank BL, Siero JCW, Luijten PR, Klomp DWJ. Pushing the limits of high-resolution functional MRI using a simple high-density multi-element coil design. NMR Biomed, 2013
Figures