0257
Diffusion-MRI based Estimation of Cortical Architecture using Machine-learning (DECAM)1Department of Radiology, Children's Hospital of Philadelphia, Philadelphia, PA, United States, 2Department of Bioengineering, University of Pennsylvania, Philadelphia, PA, United States, 3Department of Radiology, University of Pennsylvania, Philadelphia, PA, United States
Synopsis
Advanced diffusion MRI (dMRI) has enabled noninvasive microstructural assessment that can be only conventionally measured with histology1-9. However, analytical dMRI models are limited by their restrictive model assumptions, lack of validation, and biased microstructural measures. We have developed Diffusion-MRI based Estimation of Cortical Architecture using Machine-learning (DECAM), a data-driven dMRI-based method accurately estimating cortical soma and neurite densities (SD and ND) in the cortex10 leveraging a variety of complementary dMRI contrasts. By providing high-fidelity estimated soma and neurite density maps validated with histology, DECAM paves the way for data-driven noninvasive virtual histology for potential applications such as Alzheimer’s diseases.
Purpose
Advanced diffusion MRI (dMRI) has enabled noninvasive assessment of conventional cortical histological measures1-9. However, analytical models are limited by their restrictive model assumptions and lack of validation from quantitative histology, and individual dMRI parameters only characterize limited microstructure information. We have developed Diffusion-MRI based Estimation of Cortical Architecture using Machine-learning (DECAM), a data-driven dMRI-based method accurately estimating cortical soma and neurite densities (SD and ND) in the cortex10 leveraging a variety of complementary dMRI contrasts. By providing high-fidelity estimated SD and ND maps validated with histology, DECAM paves the way for data-driven noninvasive virtual histology for potential applications such as Alzheimer’s diseasesMethods
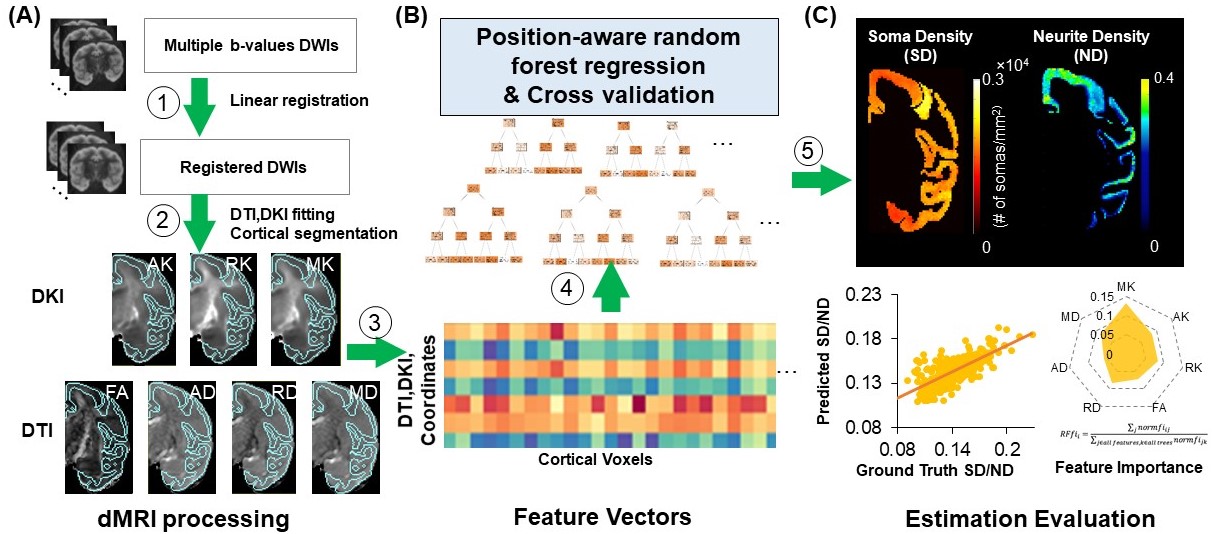
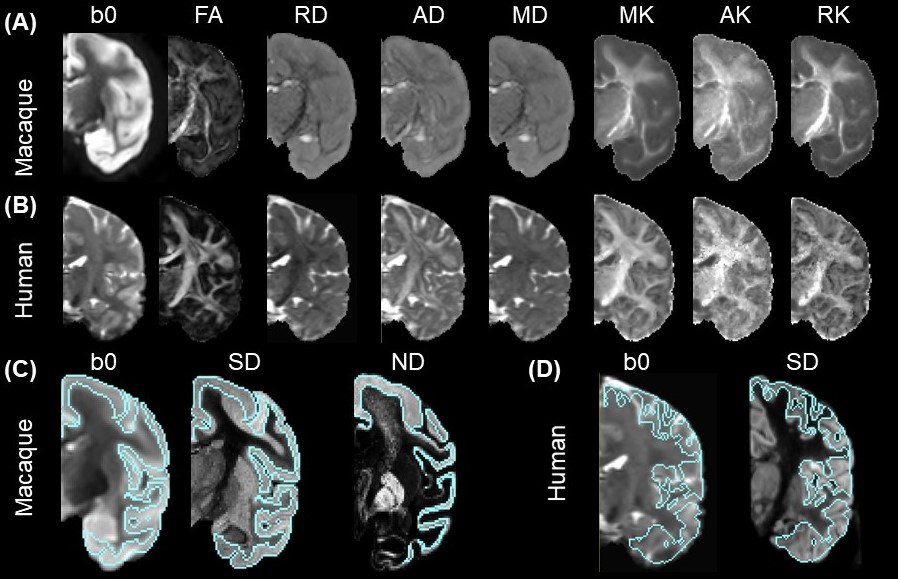
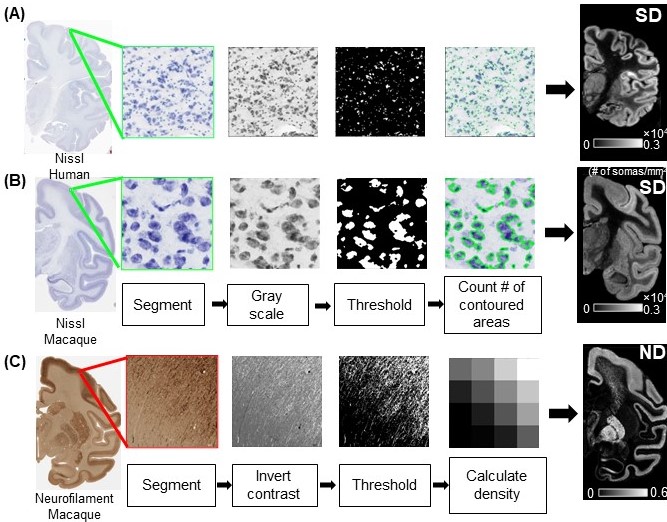
The general method for DECAM is shown in Fig. 1, with panel A showing dMRI data acquisition and processing to prepare inputs for DECAM, panel B showing the DECAM algorithm, and panel C featuring quantitative histology-based validation. Fig. 2 details inputs preparation based on diffusion tensor and kurtosis imaging (DTI and DKI) fitting and cortical segmentation. The quantification of SD and ND from histology for DECAM training and validation are detailed in Fig. 3. Specific acquisition and processing parameters are below.DMRI acquisition parameters for postmortem macaque: b-values =1500, 4500s/mm2, 30 gradient directions, in-plane resolution 0.6×0.6mm2, slice thickness=2mm, 2 repetitions for each b-value. DMRI acquisition parameters for in-vivo human: One Human Connectome Project11 subject with b-values =1000, 2000s/mm2 and 90 gradient directions for each b-value was used. DTI and DKI fitting: After eddy-current correction and registration of diffusion weighted images, DKI and DTI metrics were fitted. Axial (AK), radial (RK) and mean kurtosis (MK) as well as fractional anisotropy (FA), axial (AD), radial (RD) and mean diffusivity (MD) maps were obtained (Fig. 2A-2B). Quantification of SD and ND from histological images: The Nissl-stained human histology of resolution 2 µm/pixel (brainspan.org) were blocked into segments with size of 1×1mm2 (Fig. 3A). The Nissl-stained and neurofilament-stained macaque histology of resolution 0.46µm/pixel12 were blocked into segments with size of 0.24×0.24 mm2 (Fig. 3B-3C). SD is defined the number of contoured areas/ segment area in mm2. The calculated SD maps agrees well with SD from histology13. For measuring ND, a structure tensor was computed for every pixel in the histology14. Pixels with Anisotropy Index (AI) > 0.6 were classified as fiber structure. The area classified as fiber structure divided by the blocked area was defined ND (Fig. 3C). MRI images are up-sampled to identical resolution as blocked histology. Histology-MRI registration and cortical segmentation: Gray-scaled Neurofilament histology slice was affine registered to b010. ND map was registered to b0 using the same transformation. SD map was directly affine registered to b0. Cortical areas were segmented based on intensity and overlapping regions on b0 and histology (Fig. 2C) Position-aware random forest regression to predict SD and ND: The cortical masks were applied to AK, RK, MK, FA, AD, RD, MD, SD, and ND maps, and each cortical voxel along with its spatial coordinates served as a training sample. A random forest regressor with max-depth=7, number of estimators=1000, max-number of features=5, and mean squared error (mse) loss was used to estimate SD and ND. Model performance was evaluated using five-fold cross-validation, and average feature importance were extracted.
Results
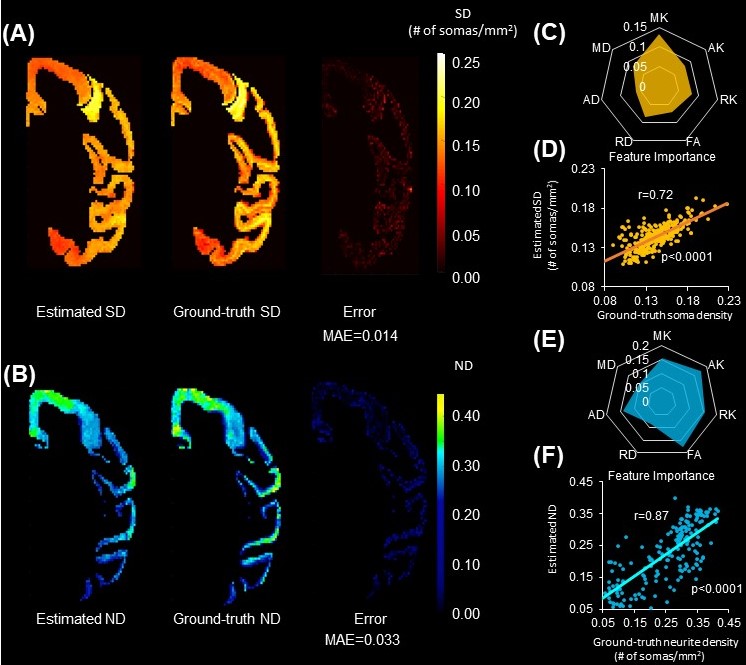
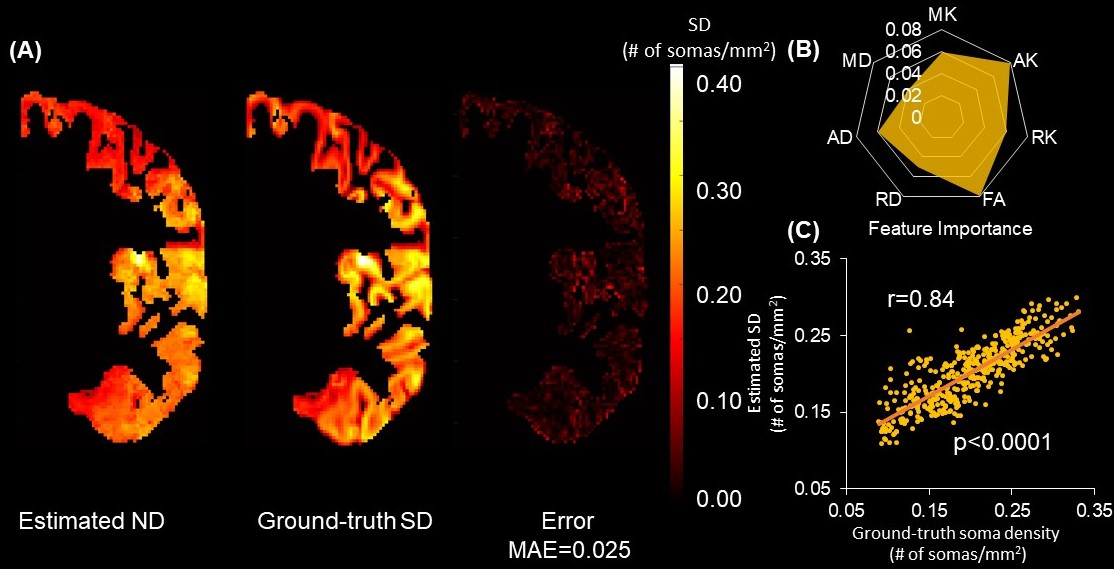
Estimated SD and ND from noninvasive DECAM on macaque brain are shown in Fig. 4A-4B. A high spatial correspondence and a low residual between histology ground-truth and DECAM-derived SD (Fig. 4A) and ND (Fig. 4B) maps can be observed. Moreover, the estimated SD and ND significantly correlate with the ground-truth values (Fig. 4D, 4F) (p<0.0001, Pearson correlation coefficient r=0.72 and 0.87 respectively). Across five-folds, the average mean absolute error (MAE) for predicting SD is 0.014×10⁴ somas/mm2, with averaged r=0.70 for correlation between predicted and ground-truth. The MAE for predicting ND is 0.033, with averaged r=0.84 for the correlation across all folds. Feature importance was extracted from final models to demonstrate the contribution of each dMRI contrasts in DECAM prediction (Fig. 4C, 4E). Specifically, DKI-derived MK ranks the first in feature importance in estimating SD, while DKI-derived AK ranks the first in feature importance in estimating ND. For estimating ND, MK, RK, FA also have high feature importance.Similarly, a high correspondence between the histology ground-truth and DECAM-derived SD map for human brain can be appreciated in Fig. 5A. The estimated SD correlate significantly with the histology ground-truth values (Fig. 5C) (p<0.0001, r=0.72). Across five-folds, the average MAE for predicting SD is 0.025×10⁴ somas/mm2, with r=0.82 for correlation between predicted and ground-truth values. Fig. 5B shows the feature importance with DKI-derived AK ranks the first in feature contribution and MK, RK, AD, FA also achieving high importance.
Discussion and Conclusion
We qualitatively and quantitatively demonstrate high correspondence between the DECAM-estimated SD and ND maps10 and ground-truth in both humans and macaques. The relatively high feature importance of kurtosis measures is consistent with the high sensitivity of kurtosis to the underlying cellular architecture studies9,15-16 and serves as a feature-engineering step for future, more advanced analytical and data-driven models. By providing high-fidelity estimated SD and ND maps validated with histology, DECAM paves the way for paradigm-shifting data-driven noninvasive virtual histology for potential applications such as Alzheimer’s diseases.Acknowledgements
This study is funded by NIH MH092535, MH092535-S1 and HD086984.References
1. Stanisz GJ, Wright GA, Henkelman RM, Szafer A. An analytical model of restricted diffusion in bovine optic nerve Magn Reson Med. . 1997;37:103-111.
2. Jensen JH, Helpern JA, Ramani A, Lu H, Kaczynski K. Diffusional kurtosis imaging: the quantification of non‐gaussian water diffusion by means of magnetic resonance imaging. Magn Reson Med. 2005;53:1432-1440.
3. Zhou XJ, Gao Q, Abdullah O, Magin RL. Studies of anomalous diffusion in the human brain using fractional order calculus. Magn Reson Med. 2010;63:562-569.
4. Jespersen SN, Kroenke CD, Østergaard L, Ackerman JJ, Yablonskiy DA. Modeling dendrite density from magnetic resonance diffusion measurements. NeuroImage. 2007;34:1473-1486.
5. Zhang H, Schneider T, Wheeler-Kingshott CA, Alexander DC. NODDI: practical in vivo neurite orientation dispersion and density imaging of the human brain. NeuroImage. 2012;61:1000-1016.
6. Le Bihan D, Johansen-Berg H. Diffusion MRI at 25: exploring brain tissue structure and function. NeuroImage. 2012;61:324-341.
7. Alexander DC, Dyrby TB, Nilsson M, Zhang H. Imaging brain microstructure with diffusion MRI: practicality and applications. NMR Biomed. 2019;32:e3841.
8. Novikov DS, Fieremans E, Jespersen SN, Kiselev VG. Quantifying brain microstructure with diffusion MRI: Theory and parameter estimation. NMR Biomed. 2019;32:e3998.
9. Zhu T, Peng Q, Ouyang A, Huang H. Neuroanatomical underpinning of diffusion kurtosis measurements in the cerebral cortex of healthy macaque brains. Magn Reason Med. 2021; 85:1895-1908.
10. Zhu T, Ouyang M, Lei N, Wolk D, Yushkevich P, Huang H. Estimating cortical soma and neurite densities from diffusion MRI measures using a machine learning approach. 2021; ISMRM 2021 abstract number: 3423
11. Van Essen DC, Smith SM, Barch DM, Behrens TE, Yacoub E, Ugurbil K, Wu-Minn HCP Consortium.. The WU-Minn human connectome project: an overview. Neuroimage, 2013; 80: 62-79.
12. Mikula S, Trotts I, Stone JM, Jones EG. Internet-enabled high-resolution brain mapping and virtual microscopy. NeuroImage. 2007;35:9-15.
13. Carlo CN, Charles FS. Structural uniformity of neocortex, revisited. PNAS. 2013;110.4: 1488-1493.
14. Budde MD, Frank JA. Examining brain microstructure using structure tensor analysis of histological sections. NeuroImage. 2012;63:1-10.
15. Ouyang M, Jeon T, Sotiras A, Peng Q, Mishra V, Davatzikos C, Huang H. Differential cortical microstructural maturation in the preterm human brain with diffusion kurtosis and tensor imaging. PNAS. 2019; 116.10: 4681-4688.
16. Lee H, Papaioannou A, Novikov DS, Fieremans E, In vivo observation and biophysical interpretation of time-dependent diffusion in human cortical gray matter. NeuroImage. 2020; 222: 117054.
Figures