0256
Correlation of Soma and Neurite Density Imaging (SANDI) metrics with Allen Mouse Brain Atlas1Champalimaud Research, Champalimaud Centre for the Unknown, Lisbon, Portugal, 2Centre for Medical Image Computing (CMIC), Dept of Computer Science, University College London, London, United Kingdom, 3Cardiff University Brain Research Imaging Centre (CUBRIC), School of Psychology, Cardiff University, Cardiff, United Kingdom, 4School of Computer Science and Informatics, Cardiff University, Cardiff, United Kingdom
Synopsis
Cross modal validation of micro-architectural features derived from diffusion MRI with contrast from other imaging modalities is critical for developing reliable imaging biomarkers. Here, we map apparent soma and neurite densities via the SANDI methodology in the in-vivo mouse brain at 9.4T and compared the derived metrics with the contrast from the Allen Mouse Brain Atlas which reflects cell body density in the brain. Our findings suggest that soma signal fraction correlates well with atlas intensities in different parts of the brain.
Introduction
Diffusion MRI is a prominent MRI modality for characterising microscopic-scale information in tissues. Over the years, many different dMRI techniques have been developed for highlighting different features of the tissue investigated, for example neurite density, axon diameter, cellular sizes, etc1,2,3,4. Among them, the SANDI approach5,6 has been recently proposed to map apparent soma size and density, as well as neurite density, from diffusion MRI data. This is achieved by employing a 3-compartment model and powder averaged diffusion measurements over a wide range of b-values, up to very high diffusion weightings.Here, we quantitatively compare the SANDI metrics derived in the in-vivo mouse brain with the intensity of the Allen Mouse Brain Atlas, which overall reflects cellular density in the brain.
Methods
All experiments were preapproved by the competent institutional and national authorities and in accordance with European Directive 2010/63.Acquisition: Diffusion weighted data from N=6 C57BL/6J mice (37-47 weeks) were acquired on a 9.4T Bruker Biospec scanner equipped with an 86 mm volume transmit coil and a 4-element array reception cryocoil. Briefly, mice were induced with 5% isofluorane and maintained at 2%, while monitoring breathing rate and temperature.
SANDI datasets were acquired using PGSE-EPI with TE=36.8ms, TR=4s, 4 averages, slice thickness = 0.4mm, 35 slices, in plane resolution = 0.12x0.12 mm, matrix=118x100, Partial Fourier =1.35, per-slice triggering and fat suppression. Diffusion parameters: 8 b-values (Δ/δ = 20/5.5 ms): 1000, 2500, 4000, 5500, 7000, 8500, 10000 and 12500 ms/mm2 with 40 directions each and 16 b=0 images.
Pre-processing consists of denoising7, ghost correction8, coil combination9, computation of real data10, intra-scan rigid registration and Gibbs-unringing11 (Figure 1a), followed by normalization and directional averaging6. SANDI analysis: A 3-compartment model (spheres, sticks and Gaussian diffusion, Figure 1b) was fit to the data using a Random Forest regression implemented in Matlab®, trained on simulated data with intra-sphere diffusivity of 2μm2/ms. Diffusion kurtosis tensor was also fit to data with b<=2500ms/mm2. Atlas: The P56 Mouse Brain Atlas12 in NIFTY format13 was downsampled to the dMRI data resolution. To avoid inter-slice interpolation, a 2D slice-to-slice registration was performed on several manually selected slices. Non-rigid registration using ANTs14 was performed using the fsphere maps and the transformations were applied to all other parameters. The resulting maps were averaged over animals. Correlation analysis: for each slice we manually drew a tissue ROI, and for all voxels the Spearman Rank coefficient between the Altas intensity and MRI metrics was calculated.
Results
Figure 2 presents powder averaged diffusion data for different b-values, showing good contrast even at very high diffusion weighting. Figure 3 exemplifies SANDI parameter maps, showing high signal fraction of spheres (fsphere) in gray matter (GM) and high signal fraction of sticks (fstick) in white matter (WM). Figure 4 presents DKI parameter maps, which show higher FA and mean kurtosis (MK) values in WM compared to GM.Figure 5 presents maps of the downsampled Allen Brain Atlas, averaged SANDI and DKI parameters as well as scatterplots of MRI metrics and atlas intensity for slices covering cerebrum and cerebellum. In both regions fsphere maps qualitatively follow the atlas intensity.
The scatterplots show strong positive rank correlation between fsphere and atlas intensity (ρ=0.74, ρ=0.75 and ρ=0.68) in both cerebrum and cerebellum. Although fsphere does not exhibit the same dynamic range as the atlas intensity in GM, it does provide contrast between different regions, for example it has lower values in striatum compared to the cortex.
In the cerebrum, a strong negative correlation is also observed between atlas intensity and FA (ρ=-0.67 and ρ=-0.73), and a moderate negative correlation with fstick (ρ=-0.49 and ρ=-0.64). For Rsphere (ρ=0.22 and ρ=0.31), MD (ρ=-0.1 and ρ=-0.33) and MK (ρ=0.03 n.s. and ρ=-0.34), we see only weak and very weak correlations.
In the cerebellum, the only parameter which shows a strong correlation with the atlas intensity is fsphere, nevertheless, we also see moderate correlation with fstick and Rsphere, with ρ=-0.54 and ρ=0.56, respectively. For DKI parameters we see weaker correlations, specifically, ρ=0.14 for MD, ρ=-0.15 for FA and ρ = -0.3 for MK. All p values are <<0.01 unless otherwise specified.
Discussion
This work shows the correlation of SANDI and DKI parameters with mouse brain cellularity, as reflected by the intensity of the Allen Brain Atlas.For SANDI, where parameters are mapped based on the powder averaged diffusion signal, the highest correlations are observed for fsphere and fstick. For DKI, where parameters also account for the directional anisotropy of the signal, the highest correlations are observed for FA. These trends are consistent in the cerebrum. In the cerebellum, however, the correlations for DKI parameters are much weaker, likely due to the orientation dispersion of fibre directions within the slice thickness.
Limitations. In this study, MRI metrics averaged over several animals are compared with an atlas, rather than animal specific histology information, thus individual variations are smoothed. However, the general features of mouse brain anatomy should not greatly vary especially for a map of “averaged brains”.
Conclusion
The signal fraction of restricted diffusion inside spheres estimated from the SANDI technique shows a strong positive correlation with mouse brain cellularity as reflected by the intensity of the Allen Brain Atlas.Acknowledgements
AI and RC are supported by ”la Caixa” Foundation (ID 100010434) and European Union’s Horizon 2020 research and innovation programme under the Marie Skłodowska-Curie grant agreement No 847648, fellowship code CF/BQ/PI20/11760029. MP is supported by UKRI Future Leaders Fellowship (MR/T020296/1).References
1. Alexander et al, Imaging brain microstructure with diffusion MRI: practicality and applications, NMRBiomed (2018) 32(4): e3841
2. Novikov et al, Quantifying brain microstructure with diffusion MRI: Theory and parameter estimation, NMRBiomed (2018) 32(4): e3998
3. Jespersen et al, Neurite density from magnetic resonance diffusion measurements at ultrahigh field: comparison with light microscopy and electron microscopy, Neuroimage (2010) 49(1):205-16
4. Veraart et al, Noninvasive quantification of axon radii using diffusion MRI, eLife (2020) 9:e49855
5. Palombo et al, SANDI: A compartment-based model for non-invasive apparent soma and neurite imaging by diffusion MRI, NeuroImage (2020) 215: 116835
6. Ianus et al, Soma and Neurite Density MRI (SANDI) of the in-vivo mouse brain (2021), https://www.biorxiv.org/content/10.1101/2021.08.11.455923v1.full.pdf
7. Veraart, J., et al., Denoising of diffusion MRI using random matrix theory. Neuroimage, 2016. 142: p. 394-406.
8. Buonocore, M.H. and L. Gao, Ghost artifact reduction for echo planar imaging using image phase correction. Magn Reson Med, 1997. 38(1): p. 89-100.
9. Walsh, D.O., A.F. Gmitro, and M.W. Marcellin, Adaptive reconstruction of phased array MR imagery. Magn Reson Med, 2000. 43(5): p. 682-90.
10. Griswold, M., et al. The Use of an Adaptive Reconstruction for Array Coil Sensitivity Mapping and Intensity Normalization. in Annual Meeting of the ISMRM. 2002.
11. Wang, Q., et al., The Allen Mouse Brain Common Coordinate Framework: A 3D Reference Atlas. Cell, 2020. 181(4): p. 936-953.e20.
12. https://scalablebrainatlas.incf.org/mouse/ABA_v3
13. Tustison et al, Directly manipulated free-form deformation image registration. IEEE Trans Image Process. 2009 Mar;18(3):624-35.
14. Afzali et al SPHERIOUSLY? The challenges of estimating sphere radius non-invasively in the human brain from diffusion MRI. Neuroimage, 2021. 237: p. 118183.
15. Motta, A., et al., Dense connectomic reconstruction in layer 4 of the somatosensory cortex. Science, 2019. 366(6469): p. eaay3134.
Figures
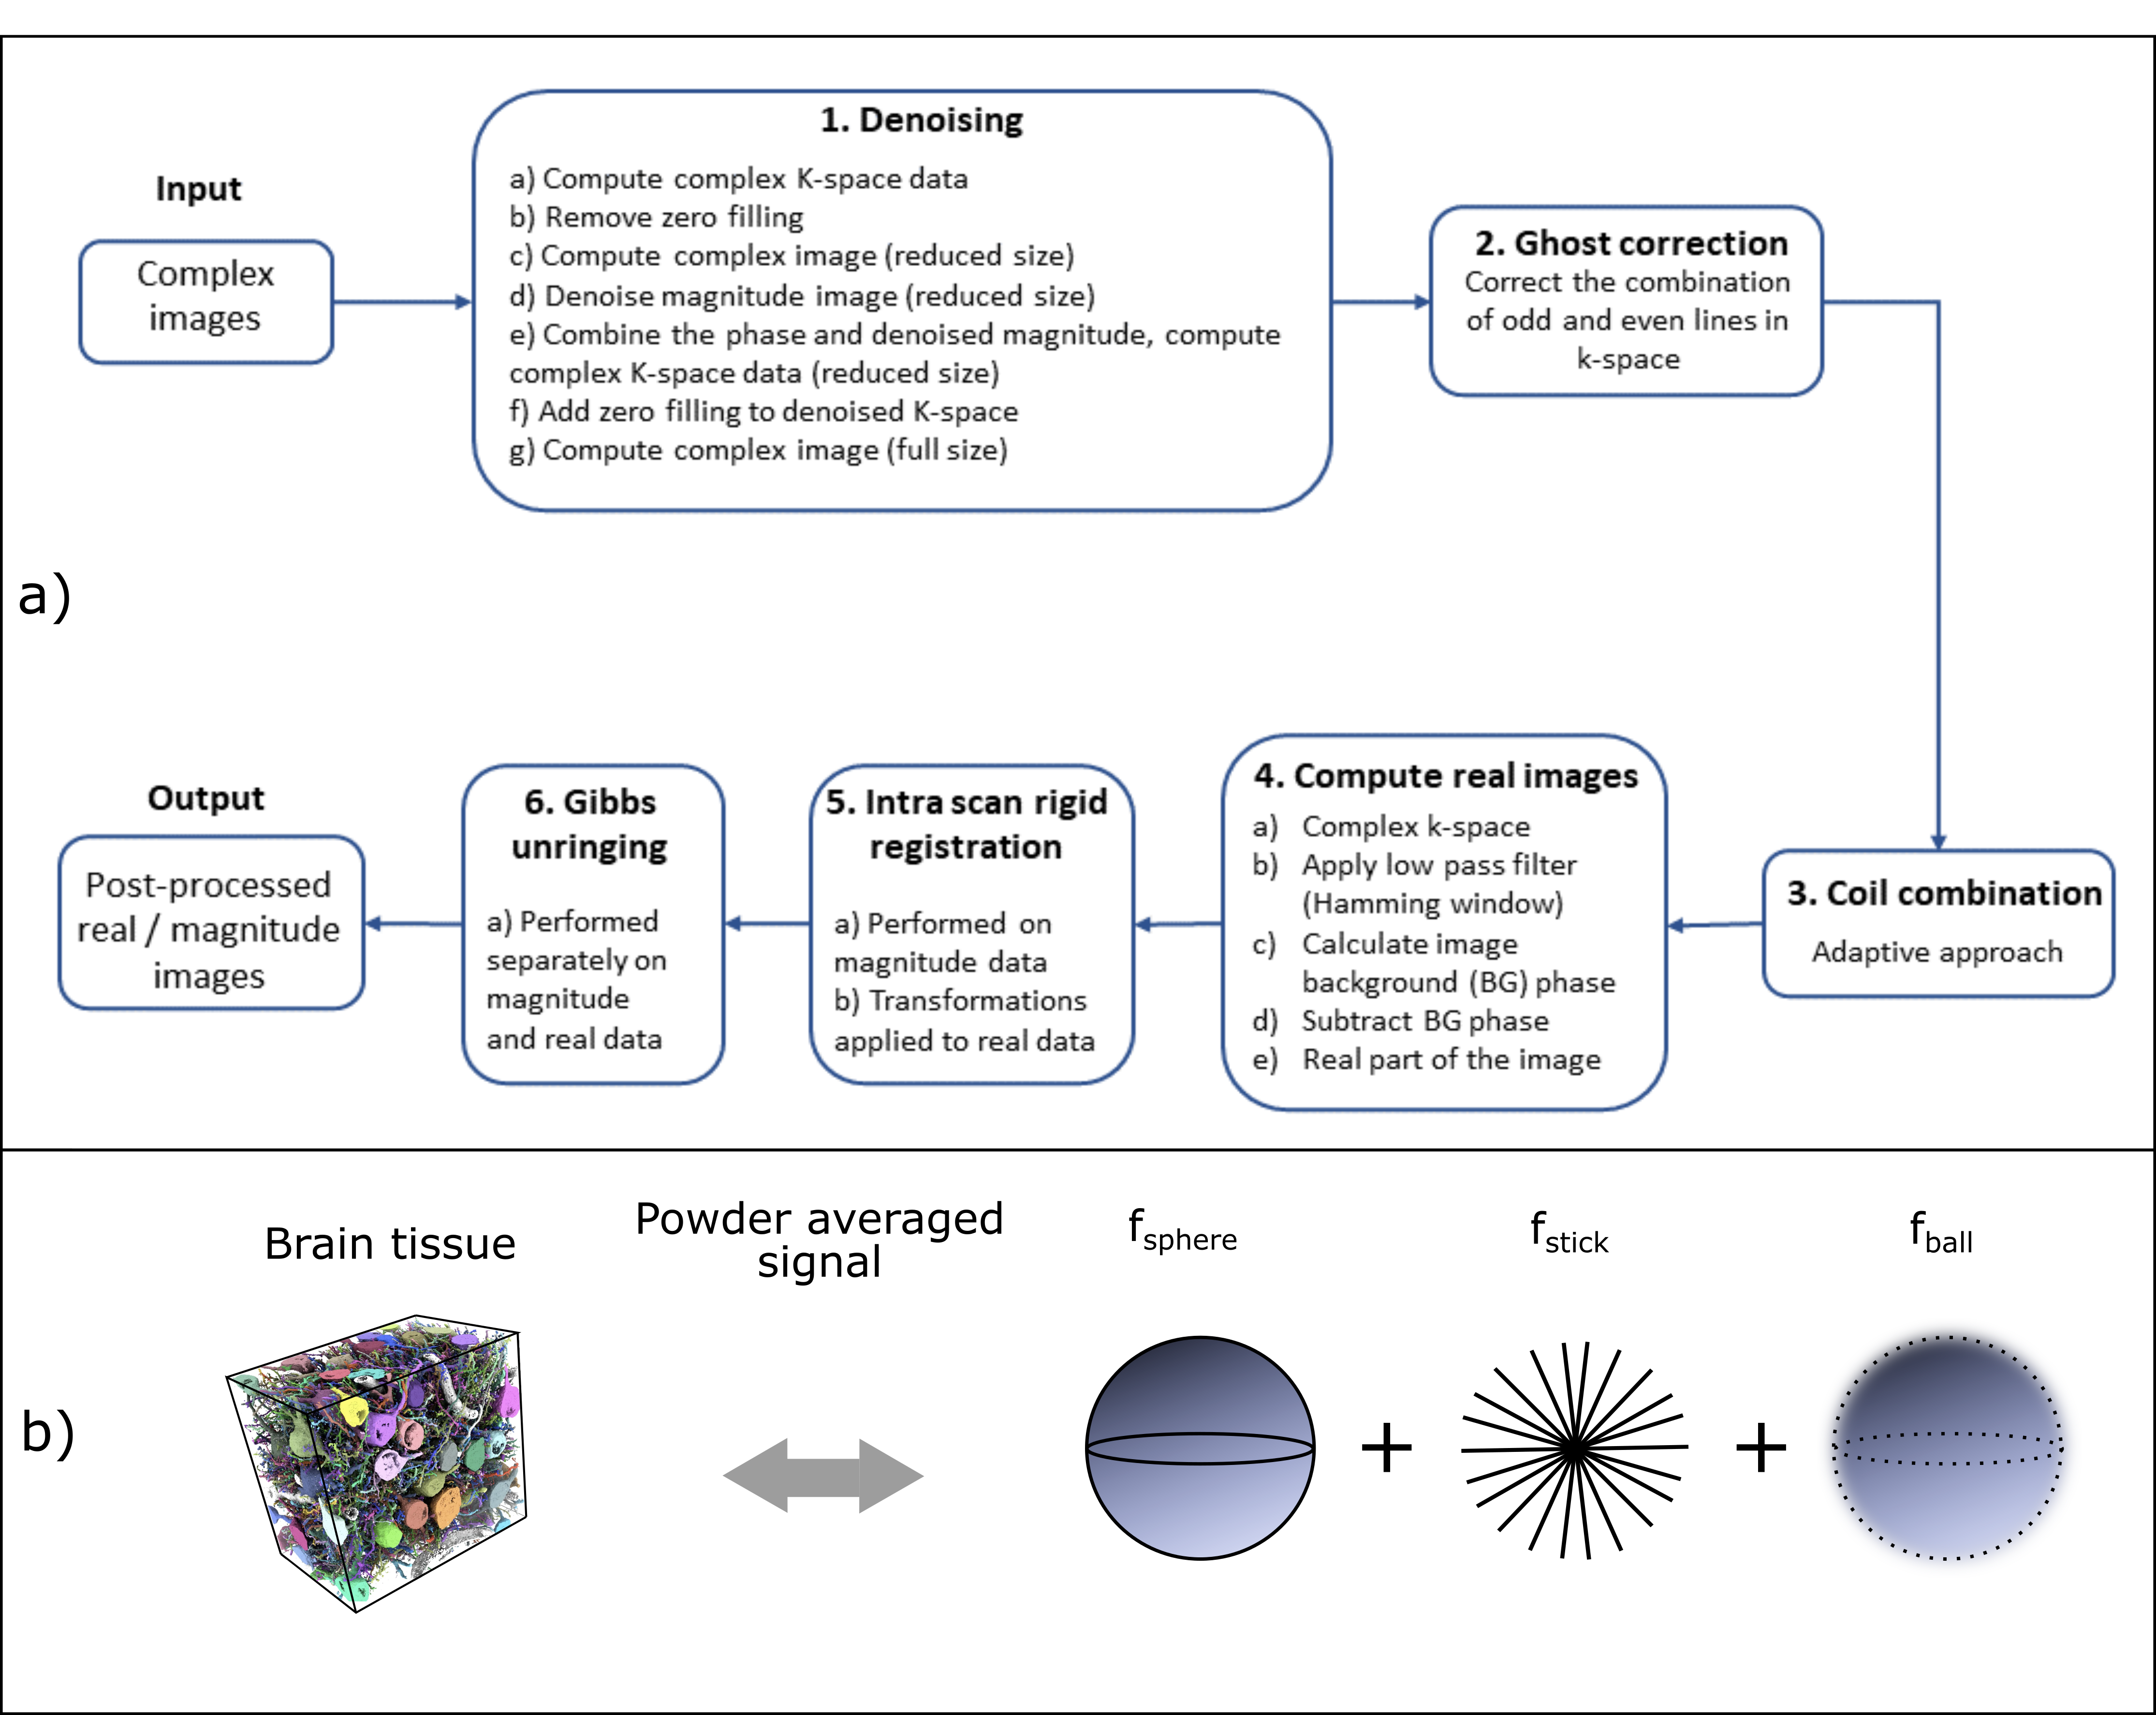
Figure 1 a) Schematic description of the data processing pipeline. Input: complex images for each channel. Step 1: MP-PCA denoising for each channel. Step 2: Ghost correction based on phase differences between odd and even k-space lines. Step 3: Channel combination. Step 4: Real images are computed. Step 5: Intra-scan registration. Step 6: Gibbs ringing correction. Output: Pre-processed real images. b) tissue reconstructed based on electron microscopy15 (left) and schematic representation of the SANDI tissue model (right) with signal fractions fsphere + fstick + fball = 1.

Figure 2 In vivo powder-averaged diffusion weighted images using real data, from one representative animal. The data are presented for two slice positions, and 5 different b values increasing left to right. Clearly, the signal to noise of the powder averaged data is high even at the highest b-value used in this study (b = 10 ms/μm2), enabling the downstream processing of the SANDI model.
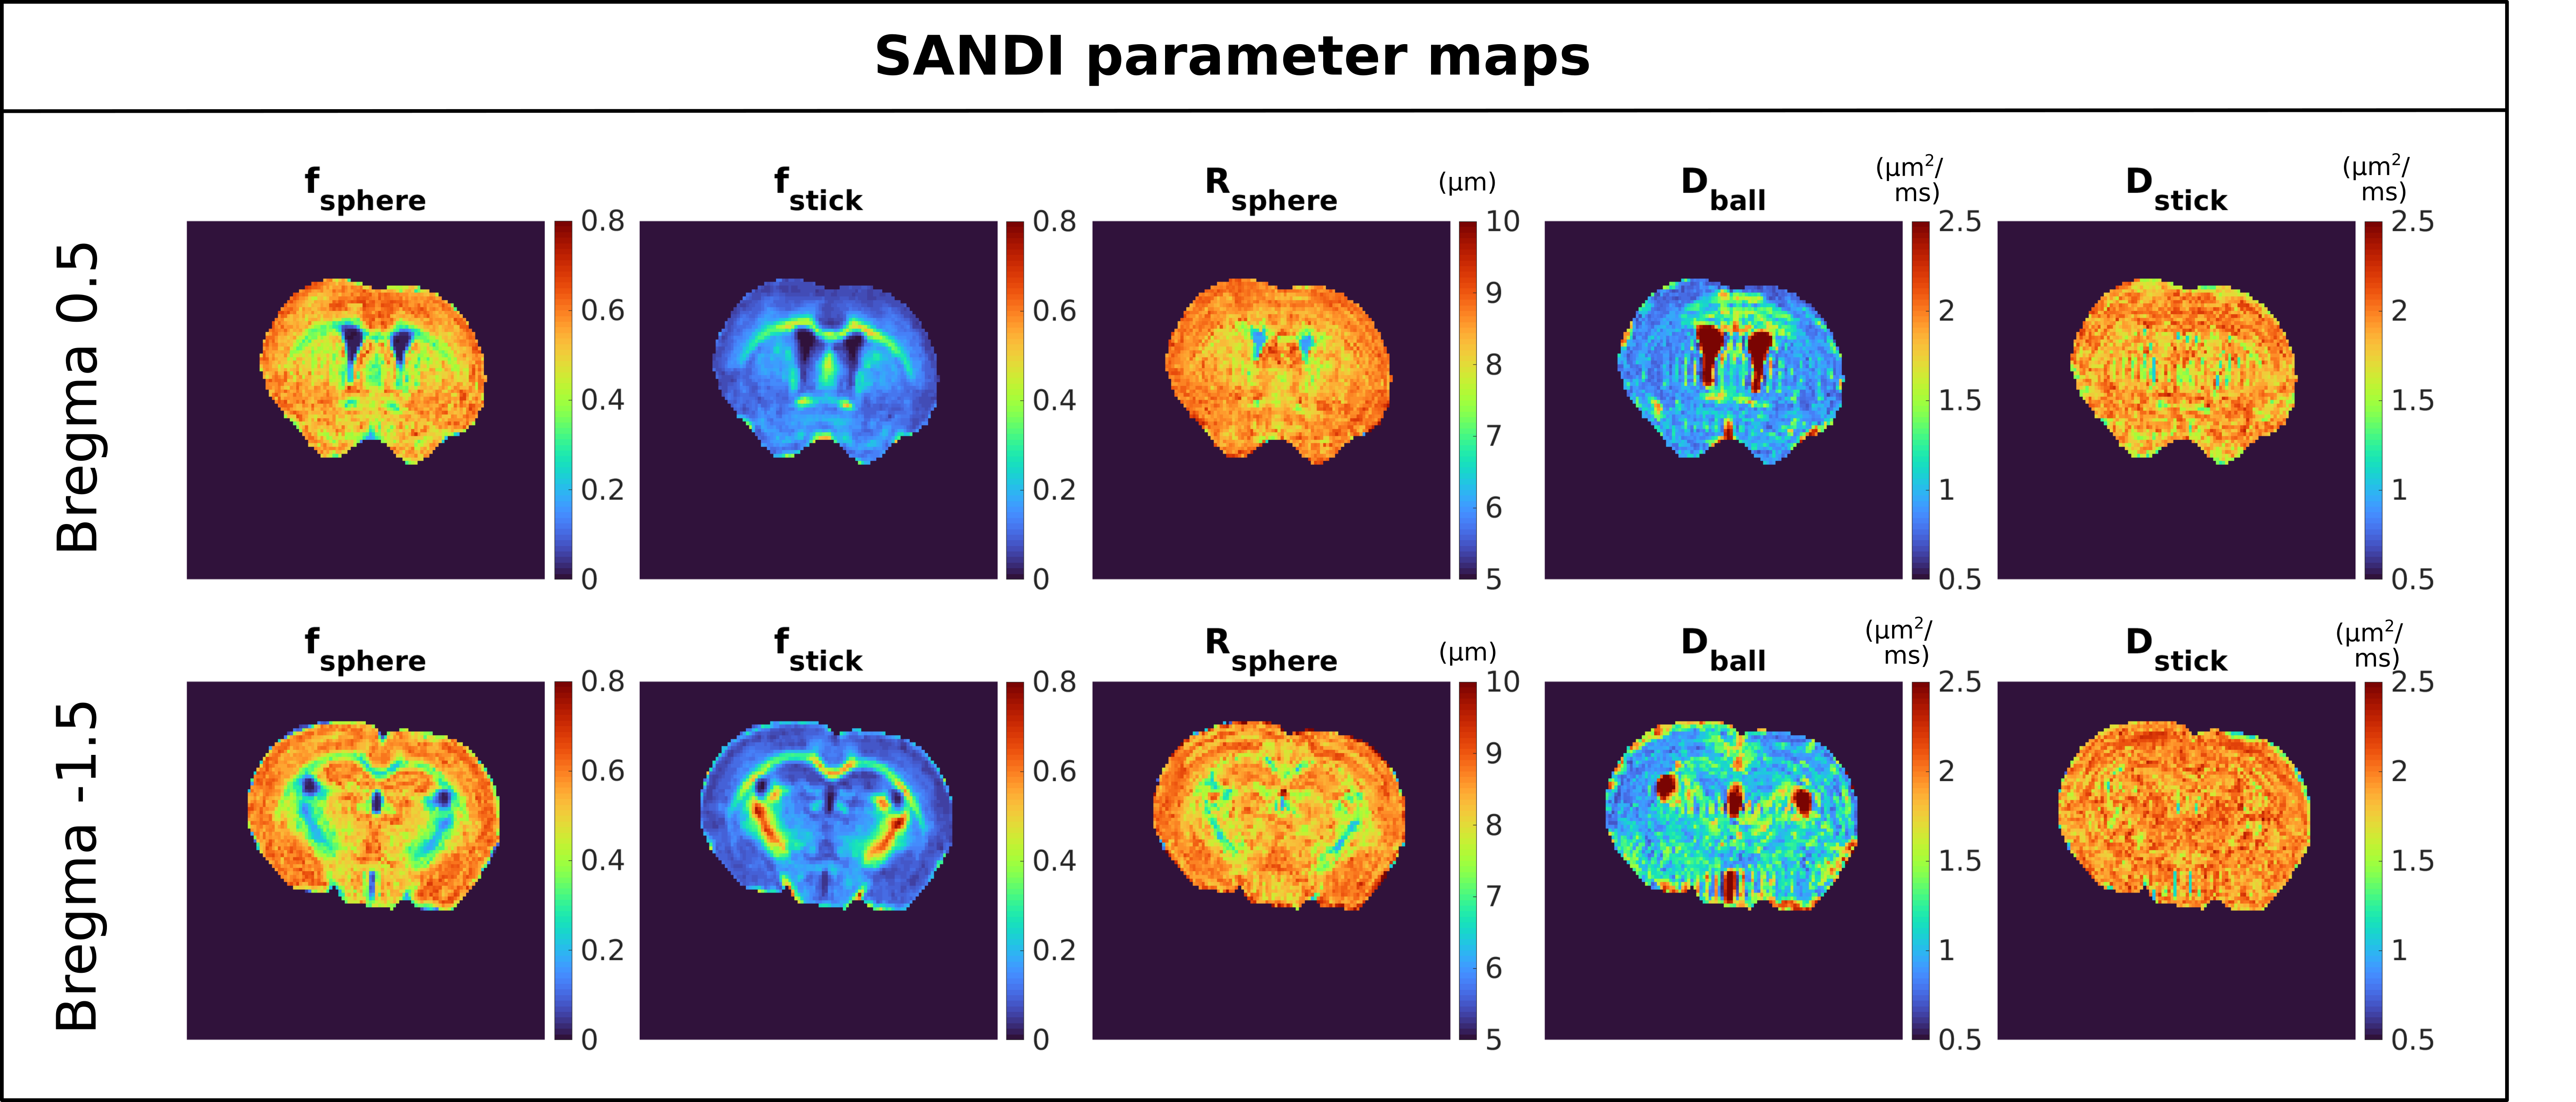
Figure 3 SANDI parameter maps derived from real data in one representative animal. Note the lower, but non-zero sphere fraction in white matter, and higher sphere fractions in gray matter. The opposite is observed for the stick fraction. In the ventricles, neither sphere nor stick signals are detected. Sphere radii are quite uniform across the gray matter, and are somewhat lower in white matter regions, while the diffusivity in sticks is between free diffusion (e.g. ventricles in Dball) and the other Gaussian diffusion processes in the brain (Dball in the brain parenhcyma).
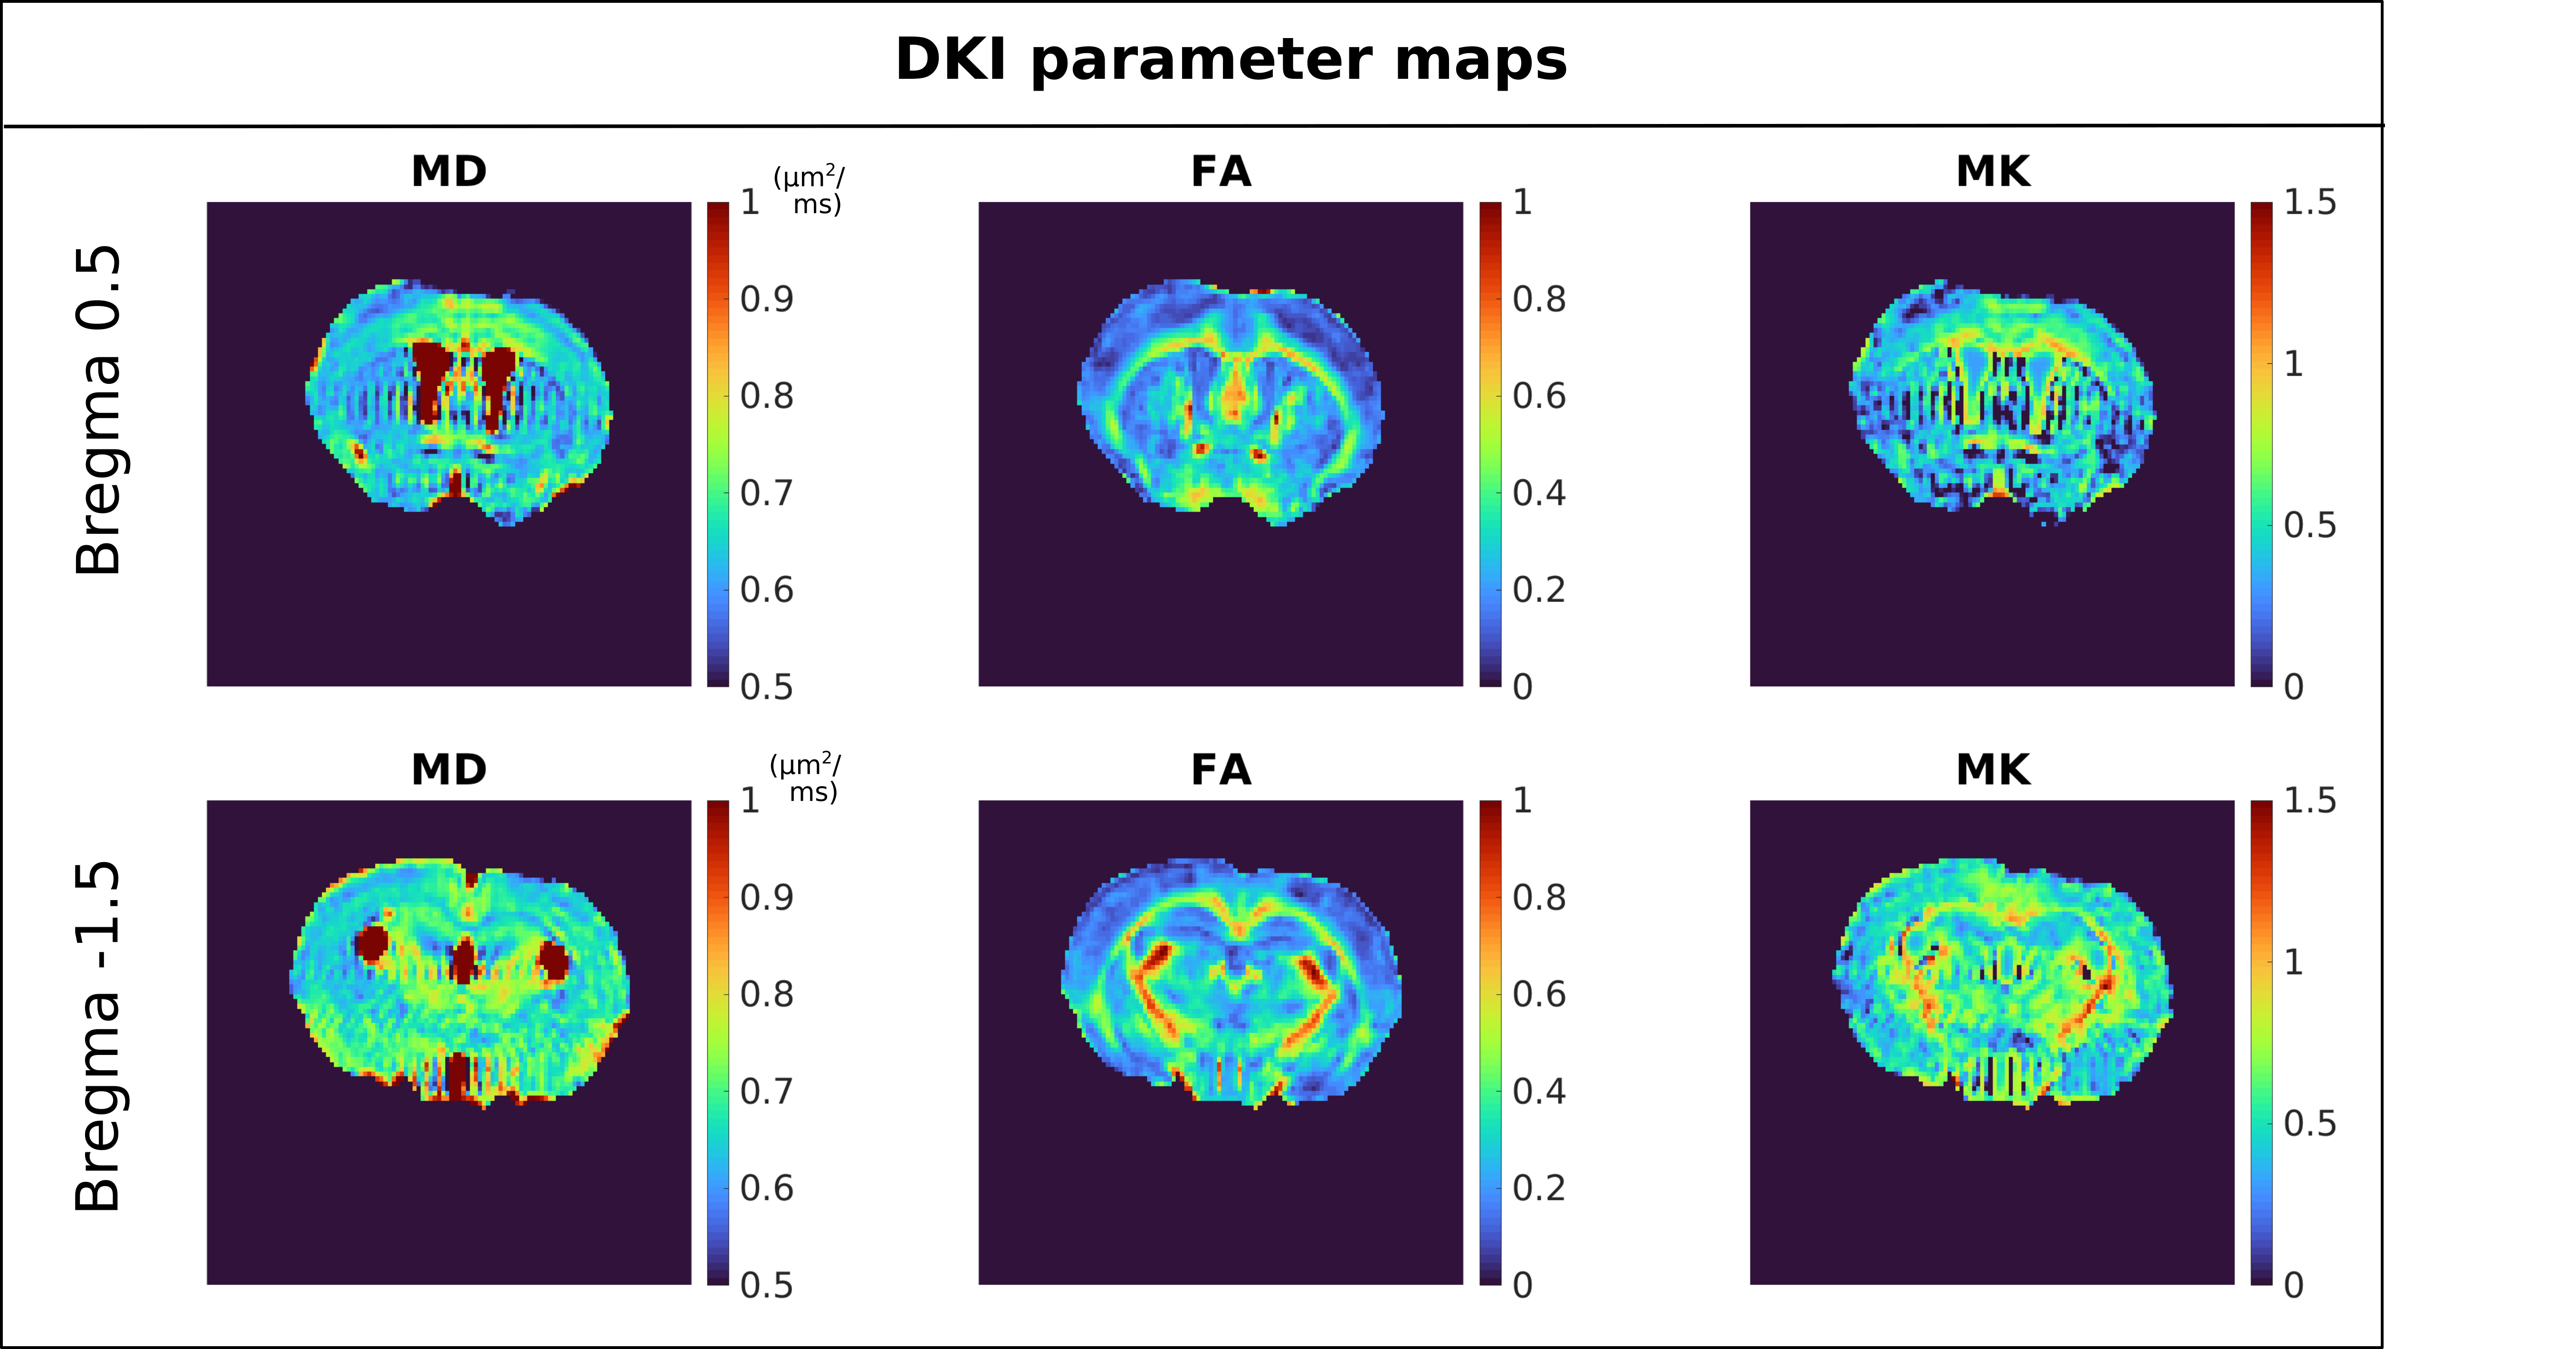
Figure 4 DKI parameter maps in one representative mouse. As expected, we can observe higher FA and MK values and lower MD values in WM compared to GM.
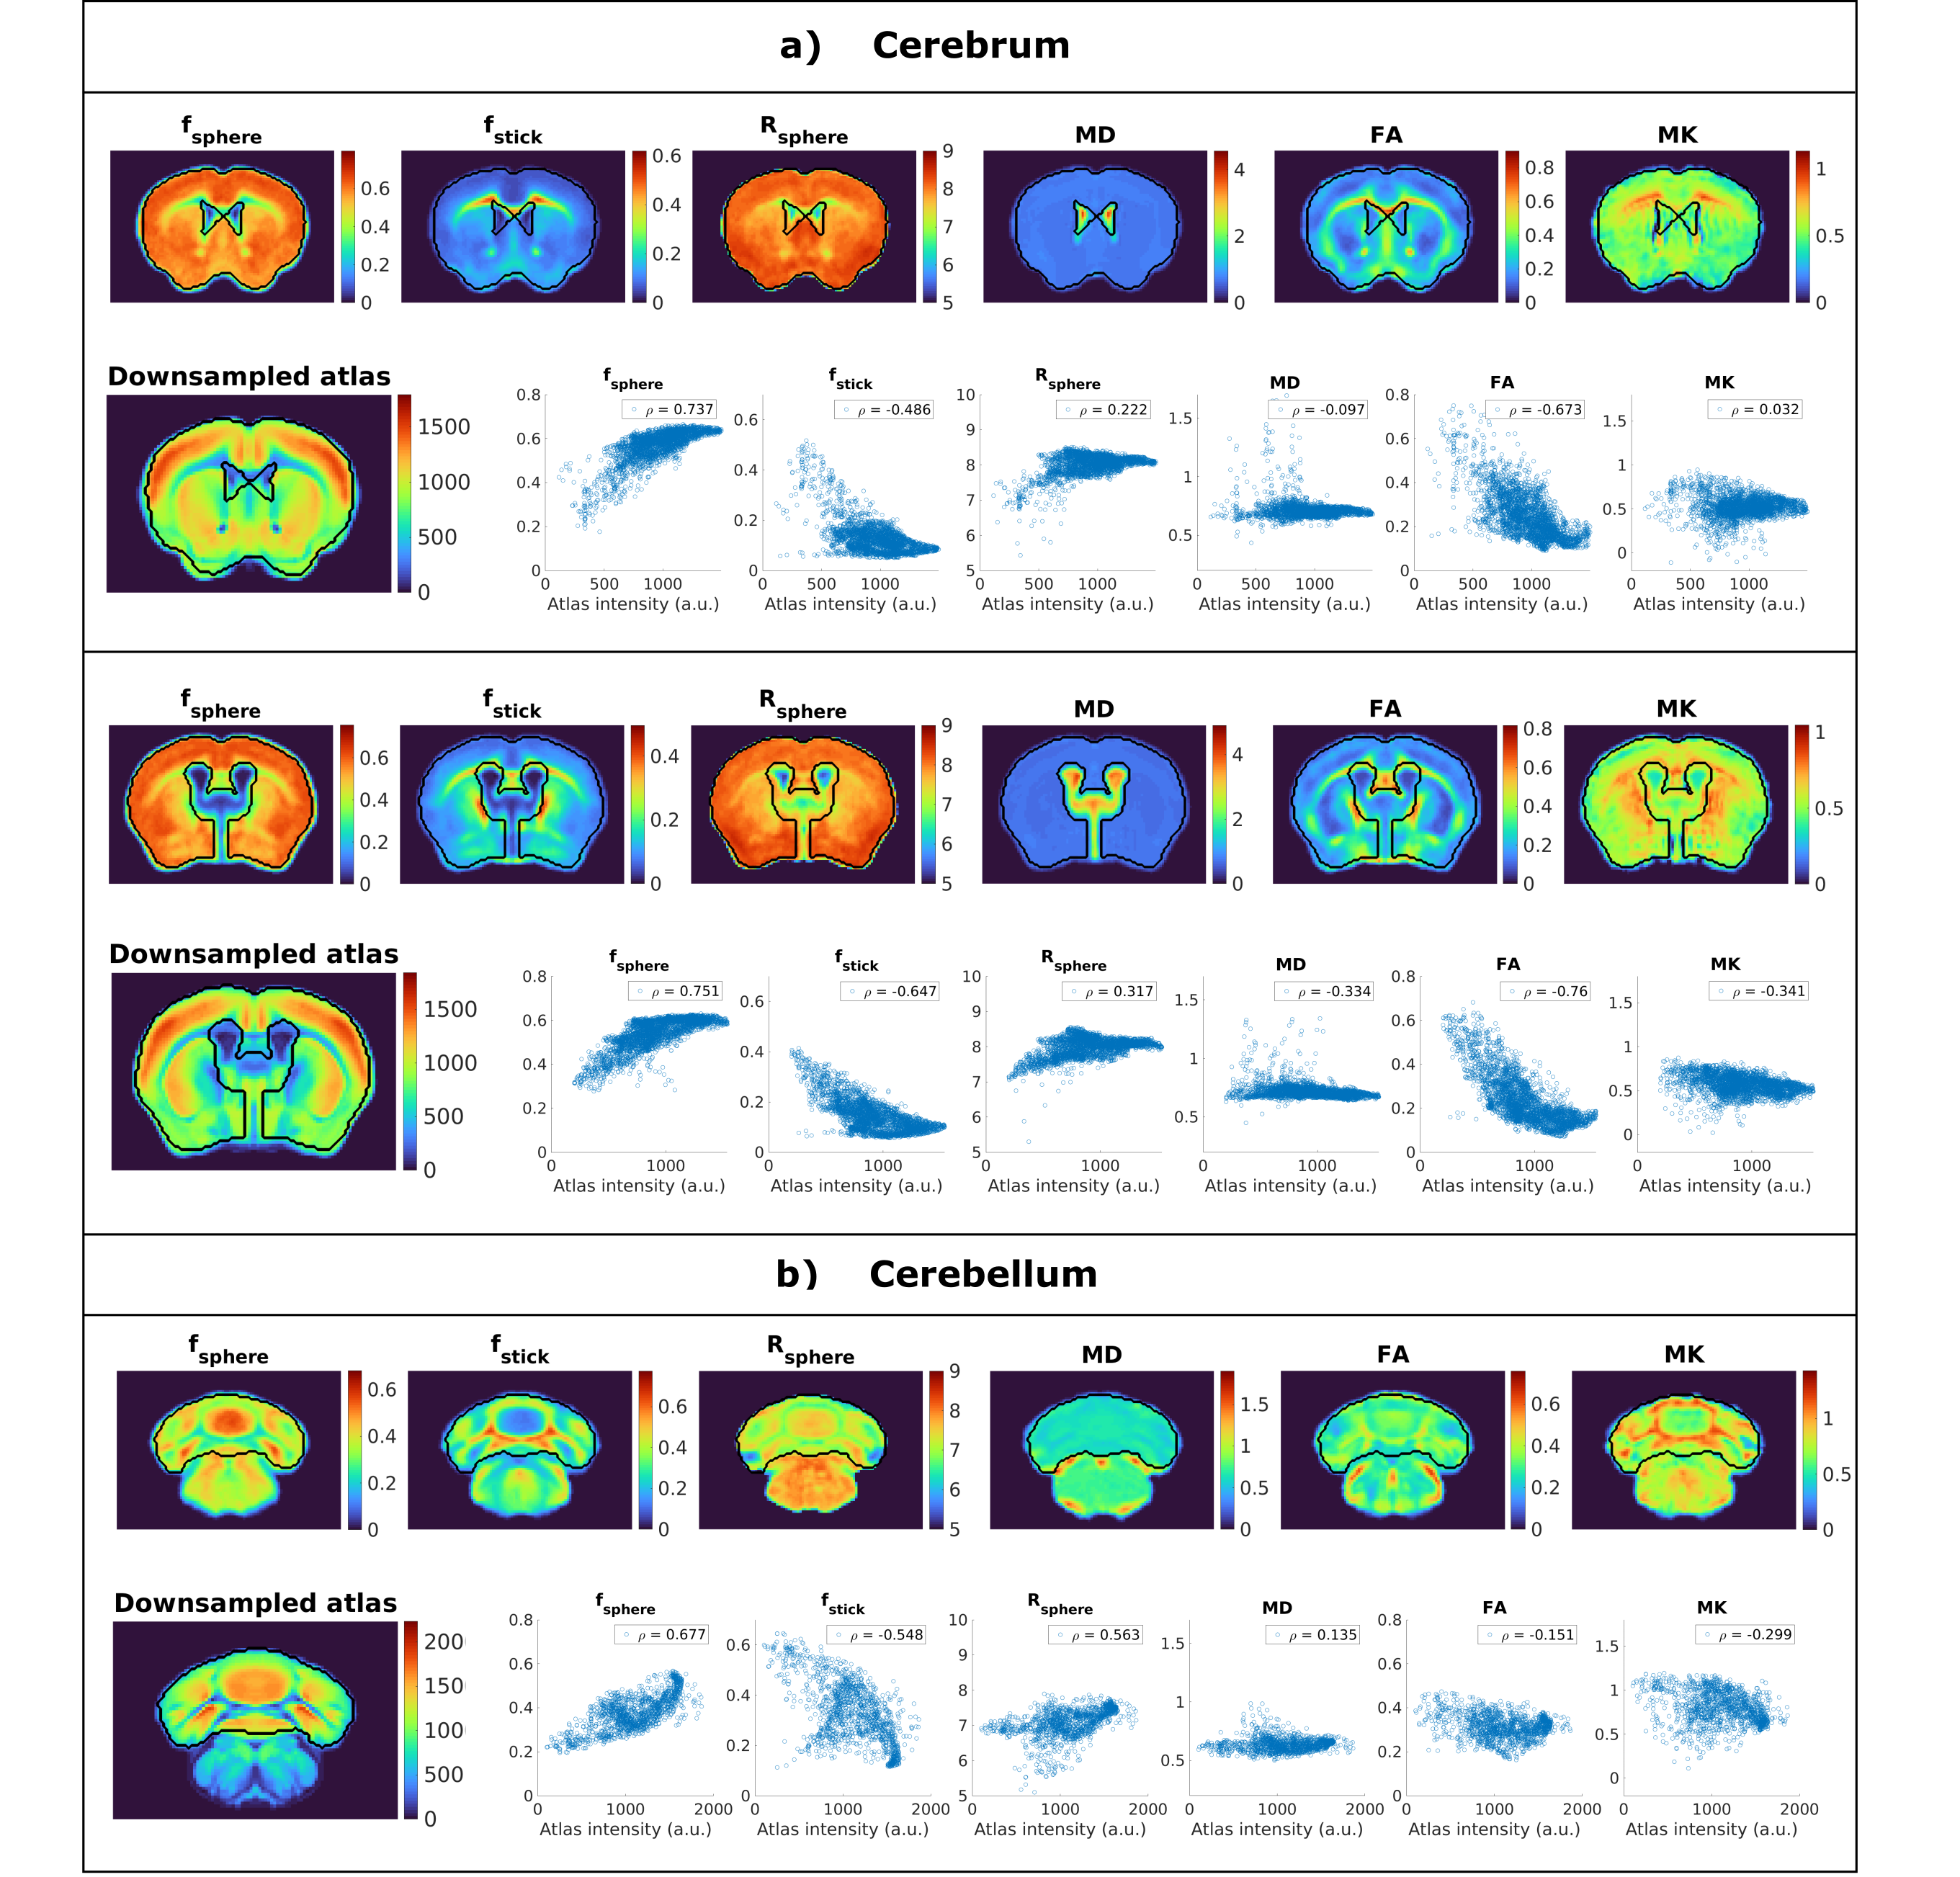
Figure 5 Comparison between dMRI parameters and the downsampled Allen mouse brain atlas for three slices in a) cerebrum and b) cerebellum. For each region, the top row shows parameter maps derived from SANDI (fsphere, fstick and Rsphere) and DKI (MD, FA and MK), averaged over 6 animals, after registration to the template. The bottom row shows voxelwise scatter plots of the same dMRI parameters versus the image intensity of the atlas, and the legend gives the Spearman correlation coefficient. Strikingly, fsphere exhibits a very good rank correlation with the altas intensity in all areas.