0255
Investigating exchange, structural disorder and restriction in Gray Matter via water and metabolites diffusivity and kurtosis time-dependence1Université Paris-Saclay, Commissariat à l’Energie Atomique et aux Energies Alternatives (CEA), Centre National de la Recherche Scientifique(CNRS), Molecular Imaging Research Center (MIRCen), Laboratoire des Maladies Neurodégénératives, Fontenay aux Roses, France, 2Centre for Medical Image Computing (CMIC), Department of Computer Science, University College London, London, United Kingdom, 3Cardiff University Brain Research Imaging Centre (CUBRIC), School of Psychology, Cardiff University, Cardiff, United Kingdom, 4School of Computer Science and Informatics, Cardiff University, Cardiff, United Kingdom
Synopsis
This work reports first-time measurements of the time-dependent diffusivity and kurtosis of both water and metabolites in vivo in the mouse gray matter (GM). Our aim is to exploit the complementary information provided by the diffusion of water and intracellular metabolites to investigate and potentially disentangle the role of exchange, structural disorder and restriction in GM. Our results show evidence that water diffusion-time dependence in GM is mostly driven by 1D short-range disorder, potentially alongside exchange. Conversely, metabolites’ diffusion-time dependence is exclusively driven by cellular restrictions, paving a new way to quantify noninvasively microstructural restrictions in GM.
Introduction
Measurement of the time-dependent diffusion-weighted MRI (dMRI) signal has been used to quantify brain tissue inter-compartmental exchange1-7, structural disorder8-10 and micrometric restrictions11-16. Particularly, measurements of the diffusion-time (td) dependence of water diffusivity13,17-20, Dw(td), and kurtosis21-24, Kw(td), provide unique insight into these tissue properties.However, due to water presence within all tissue compartments and its ability to exchange between them, interpreting the measured Dw(td)-Kw(td) in terms of the underpinning tissue microstructure is challenging. This is particularly true for the gray matter (GM), whose complex microstructure comprises restrictions on multiple length-scales, different classes of structural disorder and intra/extracellular exchange times perhaps comparable to typical dMRI’s td25,26.
Complementary to water, measurements of the diffusion of purely intracellular metabolites through dMRS offer information on the brain microstructure which is specific to the intracellular space and unaffected by inter-compartmental exchange27,28. Thus, comparing the time-dependent diffusivity, Dm(td), and kurtosis, Km(td), of intracellular metabolites with Dw(td)-Kw(td) one can potentially separate and quantify the relevant mechanism(s) driving each time-dependency in GM.
The aim of this work is to shed some light on the role of exchange, structural disorder and restriction in GM, by exploiting the complementary information from both Dw(td)-Kw(td) and Dm(td)-Km(td) measured through dMRS.
Methods
dMRS acquisitionWe scanned anesthetized C57/BL6 wild-type mice (Isoflurane ~1.6%) on a Bruker Biospec at 11.7 T equipped with a cryoprobe, using a diffusion-weighted-stimulated-echo sequence coupled to a LASER module, with TE/TR=33.4/2500 ms; δ=3 ms.
We measured water diffusion in four mice within a 2.4-µL voxel in the hippocampus (Fig.1). For each td=[11.7;15.5;20.8;30;42.5;100;250;500] ms, we acquired eight repetitions with diffusion-weightings b=[0.2;0.7;1.2;2.0;2.5] ms/µm2 along one fixed direction.
For metabolites, we scanned seven mice with a 31.5-µL voxel in the hippocampus, containing [GM,WM,CSF]~[94%,5%,1%] (Fig.2). For each td=[42.5;100;250;500] ms, we acquired two blocks of 32 repetitions (plus an extra block for the longest td) with b=[0.2;1.0;2.0;3.2;4.5;6.0;8.0] ms/µm2 along one fixed direction.
Data processing and analysis
Spectra were analyzed with LCModel29 (including experimental MM spectra in the basis-sets) to estimate metabolite concentrations and water-peak integral at each b and td.
Water and metabolites time-dependent apparent diffusivity Dapp(td) and kurtosis Kapp(td) were estimated by fitting to the corresponding diffusion-weighted signal S as a function of b at each td the following equation30:
$$S(b,td)=S(b=0,td) \times exp(-bD_{app}(td)+\frac{1}{6}K_{app}(td)(bD_{app}(td))^2))$$.
Results and Discussion
SummaryBriefly, our results suggest that water diffusion-time dependence in GM is mostly driven by 1D short-range disorder (potentially alongside exchange), while metabolites’ one exclusively by cellular restrictions, which may mask any signature of existing structural disorder.
1D short-range disorder dominates water diffusion-time dependence
Exemplar fits of Eq.1 to the measured S(b,td) are shown in Fig.1. We observe a decrease of Dapp(td) and Kapp(td) with increasing td (Fig.1), in line with13,17-24.
To assess whether there is any signature of structural disorder, in Fig.2 we report Dapp(td) and Kapp(td) as a function of td-0.5 and td-1, the functional forms for 1D and 2D/3D disorder9,24. We observe a cleaner td-0.5 trend. Fitting to these data the power-law time-dependence proposed in9,24, we estimated a dynamical exponent ϑ=0.30±0.15 and a dimensionless ratio $$$\xi=\frac{C_KD_\inf}{C_D}=2.1±0.8$$$ (ξ=2.3±0.9, when imposing ϑ=0.50). These agree with theoretical predictions for 1D short-range disorder9,24 (ϑ=0.5, ξ=2), and7,24.
Nevertheless, at long td, both structural disorder and exchange could compete. Unless all molecules have already exchanged (i.e. td>>tex, exchange-time), the overall Dapp(td) and Kapp(td) would still scale with the same ϑ<1 , dominated by the smallest ϑ , hence 0.59,24. Fig.2 additionally suggests that, in the in vivo mouse GM, tex~[12-500] ms, which is in line with recent findings5,7.
Restrictions dominate metabolites diffusion-time dependence
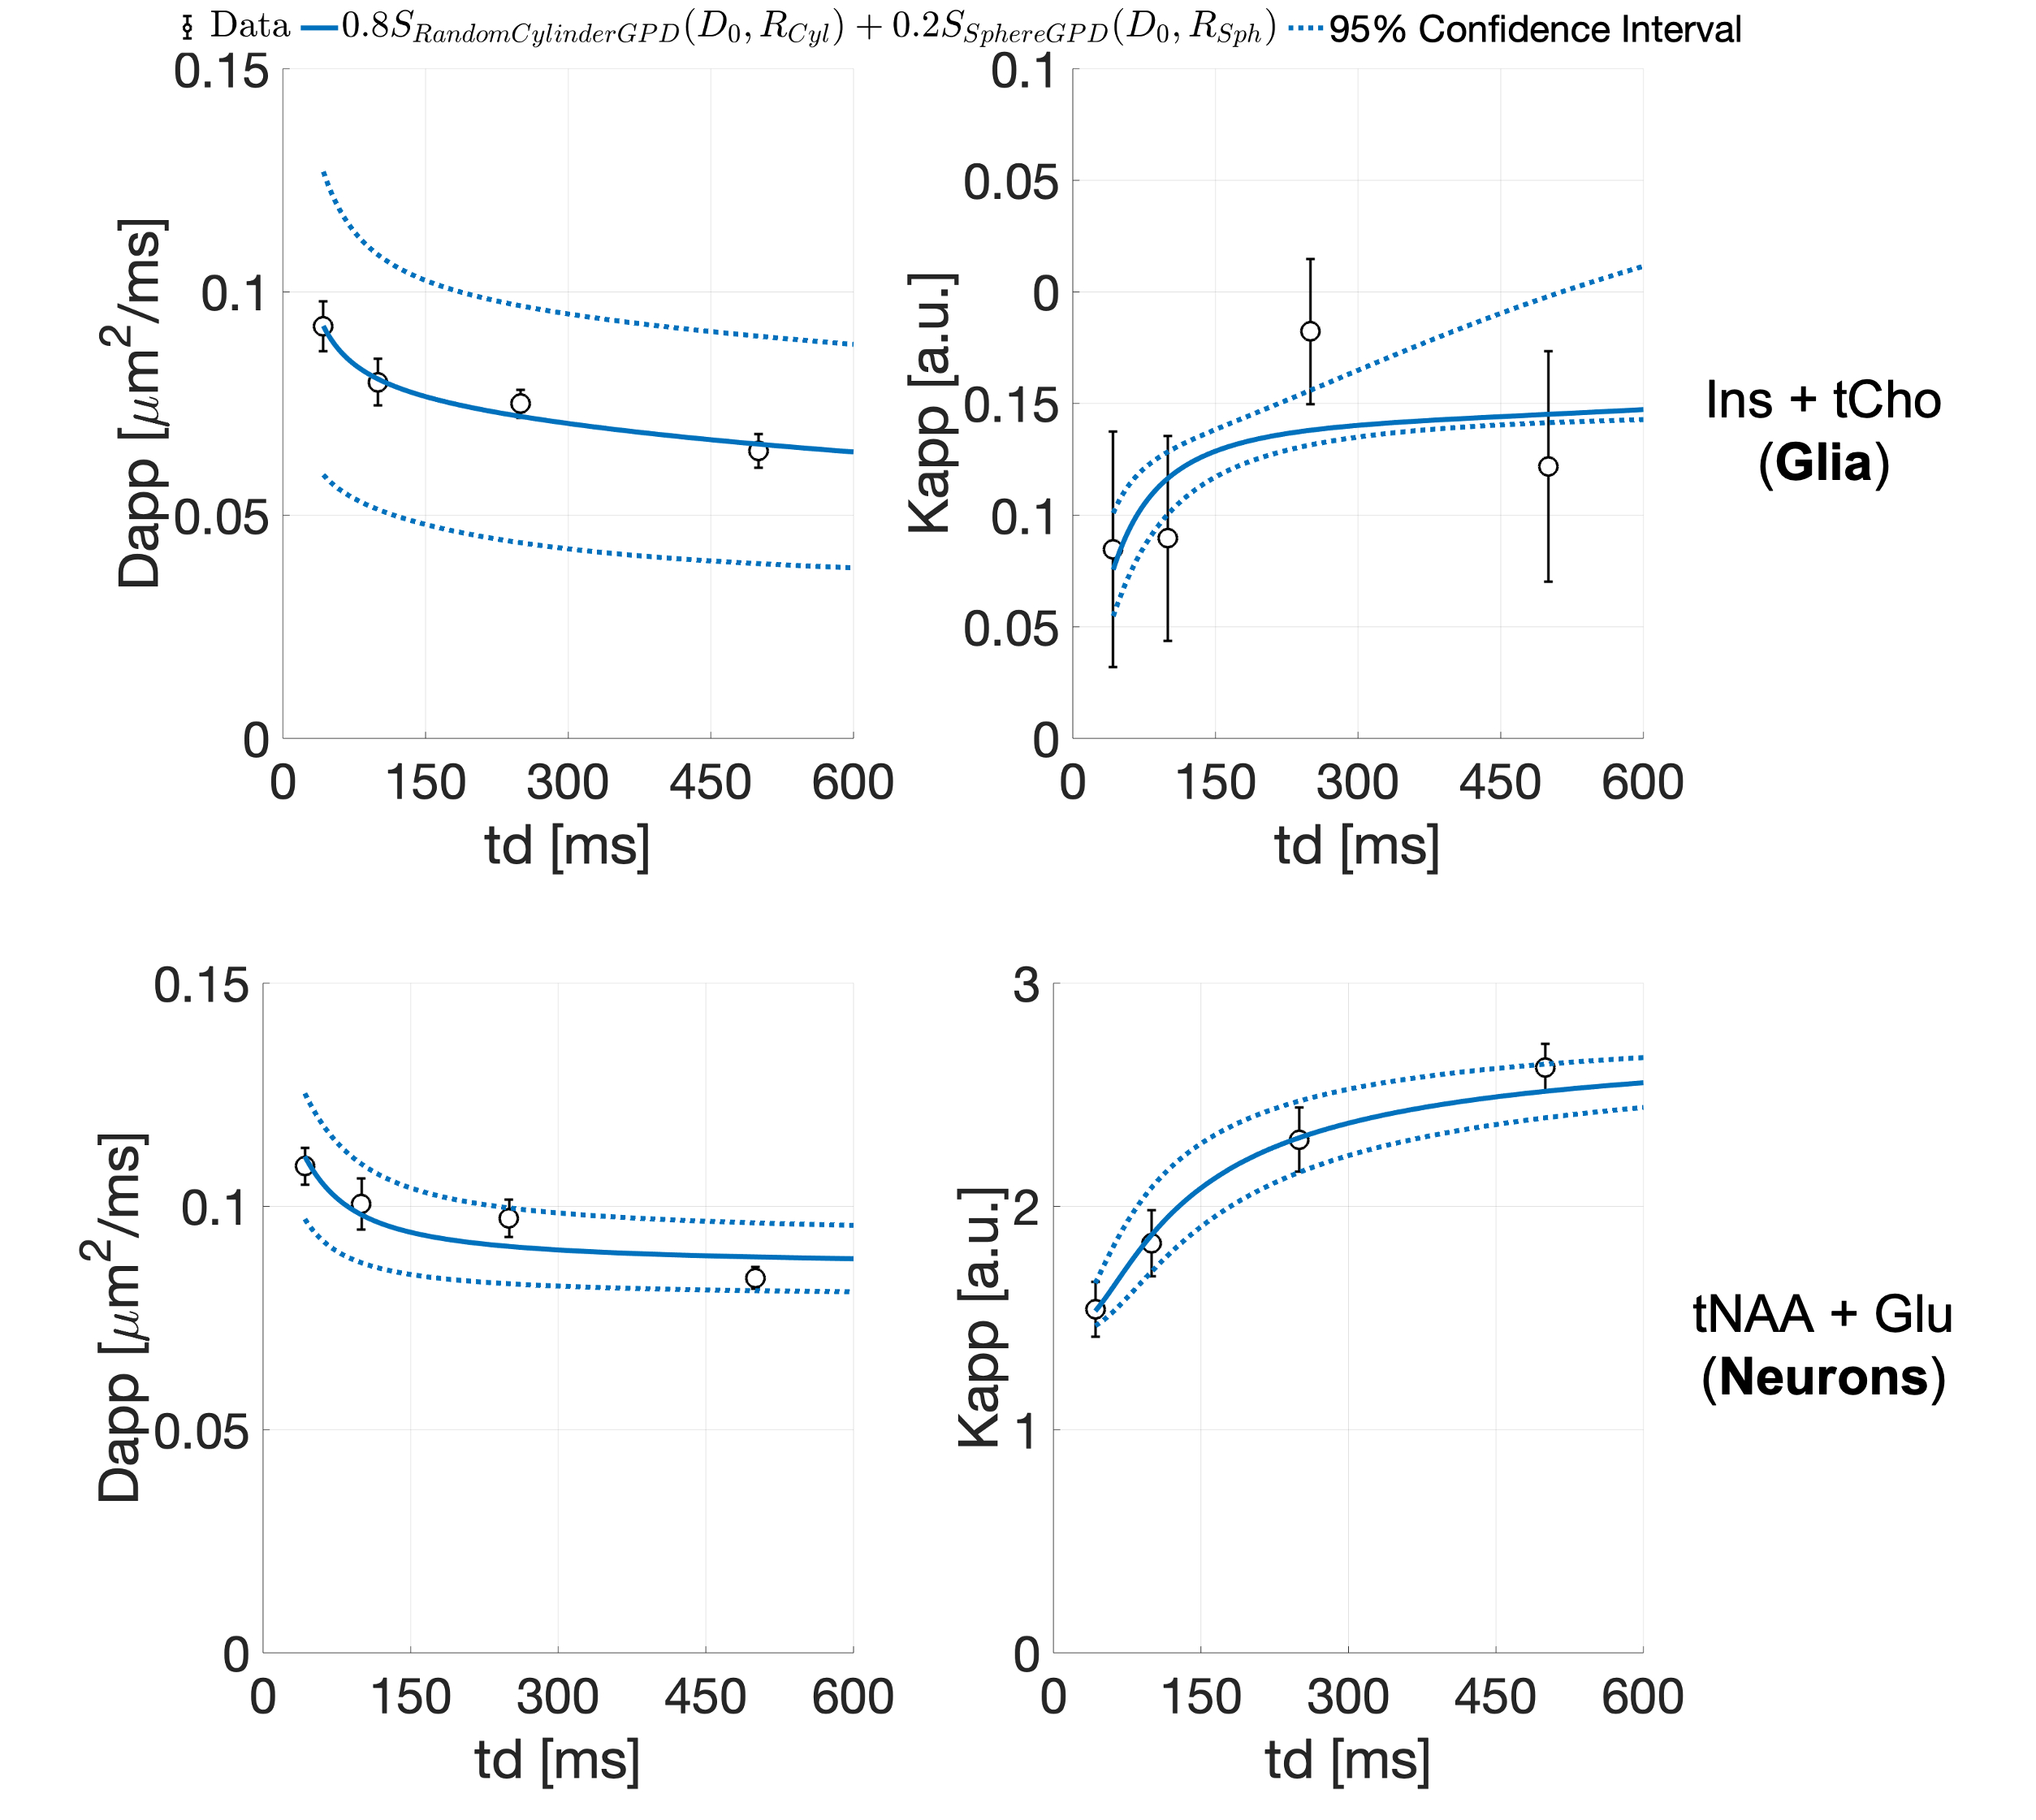
Fig.3 shows exemplar metabolites S(b,td) together with the fit of Eq.1. In contrast to water, for all metabolites, we observe a decrease of Dapp and an increase of Kapp with td, with Kappmax~2.6 (Fig.4). This trend is noisier for supposedly glial metabolites (e.g. Ins and tCho).
The observed metabolites Dapp(td)-Kapp(td) suggest that restriction is the dominant mechanism (e.g. over structural disorder) impacting intracellular metabolites diffusion within the investigated td range. Indeed, the presence of non-negligible fraction of restricting compartments of radius R, like soma and projections, would lead to an increase of Kapp with increasing td for td≤R2/Dapp(td->0)24. On average31, neural soma’s R~8 µm and projections’ R~1 µm, suggesting that most of the probed td falls within this regime (i.e., td≤200 ms for Dapp(td->0)=0.35 µm2/ms32,33).
To assess the validity of this picture, we modeled the average Dapp(td) and Kapp(td) for joint tCho and Ins (mostly intra-glial), and tNAA and Glu (mostly intra-neuronal), using diffusion in randomly oriented cylinders and spheres34-36. This model well described the ‘glial’ and ‘neuronal’ data (Fig.5), with estimated intracellular diffusivities 0.17±0.05 and 0.34±0.03 µm2/ms, respectively. Moreover, the estimated cylinder radii (2.4±0.8 and 0.3±0.2 µm) and sphere radii (19±11 and 5.4±0.9 µm) for the ‘glial’ and ‘neuronal' metabolites, respectively, match microscopy estimates of projections and soma radii31.
Conclusion
To our knowledge, this is the first study reporting both Dw,m(td) and Kw,m(td) in-vivo in the mouse brain GM.These new results can help interpreting measured Dw(td)-Kw(td) in terms of the underpinning brain microstructure and suggest that measurements of Dm(td)-Km(td) can offer a new way to quantify microstructural restrictions in GM.
Acknowledgements
MP is supported by UKRI Future Leaders Fellowship (MR/T020296/1). JV and EM receive support from the European Research Council (ERC) under the European Union’s Horizon 2020 research and innovation programmes (grant agreement No 818266).References
1. Stanisz GJ, Szafer A, Wright GA, Henkelman RM. An analytical model of restricted diffusion in bovine optic nerve. Magn Reson Med. 1997;37(1):103-111.
2. Nilsson M, Latt J, Nordh E, Wirestam R, Stahlberg F, Brockstedt S. On the effects of a varied diffusion time in vivo: is the diffusion in white matter restricted? Magn Reson Imaging. 2009;27(2):176-187.
3. Nedjati-Gilani GL, Schneider T, Hall MG, et al. Machine learning based compartment models with permeability for white matter microstructure imaging. Neuroimage. 2017;150:119-135.
4. Hill I, Palombo M, Santin M, et al. Machine learning based white matter models with permeability: An experimental study in cuprizone treated in-vivo mouse model of axonal demyelination. Neuroimage. 2021;224:117425.
5. Jelescu IO, de Skowronski A, Palombo M, Novikov DS. Neurite Exchange Imaging (NEXI): A minimal model of diffusion in gray matter with inter-compartment water exchange. arXiv preprint. 2021;arXiv:2108.06121.
6. Olesen JL, Ostergaard L, Shemesh N, Jespersen SN. Diffusion time dependence, power-law scaling, and exchange in gray matter. arXiv preprint. 2021;arXiv:2108.09983.
7. Zhang J, Lemberskiy G, Moy L, Fieremans E, Novikov DS, Kim SG. Measurement of cellular-interstitial water exchange time in tumors based on diffusion-time-dependent diffusional kurtosis imaging. Nmr Biomed. 2021;34(6):e4496.
8. Palombo M, Gabrielli A, Servedio VD, Ruocco G, Capuani S. Structural disorder and anomalous diffusion in random packing of spheres. Sci Rep. 2013;3:2631.
9. Novikov DS, Jensen JH, Helpern JA, Fieremans E. Revealing mesoscopic structural universality with diffusion. P Natl Acad Sci USA. 2014;111(14):5088-5093.
10. Palombo M, Ligneul C, Hernandez-Garzon E, Valette J. Can we detect the effect of spines and leaflets on the diffusion of brain intracellular metabolites? Neuroimage. 2017;182:283-293.
11. Jespersen SN, Olesen JL, Hansen B, Shemesh N. Diffusion time dependence of microstructural parameters in fixed spinal cord. Neuroimage. 2018;182:329-342.
12. Assaf Y, Cohen Y. Assignment of the water slow-diffusing component in the central nervous system using q-space diffusion MRS: implications for fiber tract imaging. Magn Reson Med. 2000;43(2):191-199.
13. Does MD, Parsons EC, Gore JC. Oscillating gradient measurements of water diffusion in normal and globally ischemic rat brain. Magn Reson Med. 2003;49(2):206-215.
14. Panagiotaki E, Schneider T, Siow B, Hall MG, Lythgoe MF, Alexander DC. Compartment models of the diffusion MR signal in brain white matter: a taxonomy and comparison. Neuroimage. 2012;59(3):2241-2254.
15. Drobnjak I, Siow B, Alexander DC. Optimizing gradient waveforms for microstructure sensitivity in diffusion-weighted MR. J Magn Reson. 2010;206(1):41-51.
16. Palombo M, Ligneul C, Najac C, et al. New paradigm to assess brain cell morphology by diffusion-weighted MR spectroscopy in vivo. Proc Natl Acad Sci U S A. 2016;113(24):6671-6676.
17. Aggarwal M, Jones MV, Calabresi PA, Mori S, Zhang JY. Probing mouse brain microstructure using oscillating gradient diffusion MRI. Magnet Reson Med. 2012;67(1):98-109.
18. Baron CA, Beaulieu C. Oscillating gradient spin-echo (OGSE) diffusion tensor imaging of the human brain. Magn Reson Med. 2014;72(3):726-736.
19. Wu D, Martin LJ, Northington FJ, Zhang J. Oscillating gradient diffusion MRI reveals unique microstructural information in normal and hypoxia-ischemia injured mouse brains. Magn Reson Med. 2014;72(5):1366-1374.
20. Arbabi A, Kai J, Khan AR, Baron CA. Diffusion dispersion imaging: Mapping oscillating gradient spin-echo frequency dependence in the human brain. Magn Reson Med. 2020;83(6):2197-2208.
21. Pyatigorskaya N, Le Bihan D, Reynaud O, Ciobanu L. Relationship between the diffusion time and the diffusion MRI signal observed at 17.2 Tesla in the healthy rat brain cortex. Magn Reson Med. 2014;72(2):492-500.
22. Wu D, Li Q, Northington FJ, Zhang J. Oscillating gradient diffusion kurtosis imaging of normal and injured mouse brains. Nmr Biomed. 2018;31(6):e3917.
23. Aggarwal M, Smith MD, Calabresi PA. Diffusion-time dependence of diffusional kurtosis in the mouse brain. Magn Reson Med. 2020;84(3):1564-1578.
24. Lee HH, Papaioannou A, Novikov DS, Fieremans E. In vivo observation and biophysical interpretation of time-dependent diffusion in human cortical gray matter. Neuroimage. 2020;222:117054.
25. Li H, Jiang X, Xie J, Gore JC, Xu J. Impact of transcytolemmal water exchange on estimates of tissue microstructural properties derived from diffusion MRI. Magn Reson Med. 2017;77(6):2239-2249.
26. Yang DM, Huettner JE, Bretthorst GL, Neil JJ, Garbow JR, Ackerman JJH. Intracellular water preexchange lifetime in neurons and astrocytes. Magnet Reson Med. 2018;79(3):1616-1627.
27. Palombo M, Shemesh N, Ronen I, Valette J. Insights into brain microstructure from in vivo DW-MRS. Neuroimage. 2018;182:97-116.
28. Ronen I, Valette J. Diffusion-weighted magnetic resonance spectroscopy. eMagRes. 2015;4:733–750.
29. Provencher SW. Automatic quantitation of localized in vivo 1H spectra with LCModel. Nmr Biomed. 2001;14(4):260-264. 30. Jensen JH, Helpern JA, Ramani A, Lu H, Kaczynski K. Diffusional kurtosis imaging: the quantification of non-gaussian water diffusion by means of magnetic resonance imaging. Magn Reson Med. 2005;53(6):1432-1440.
31. Palombo M, Alexander DC, Zhang H. Large-scale analysis of brain cell morphometry informs microstructure modelling of gray matter. 29th ISMRM Annual Meeting and Exhibition 2021.
32. Ligneul C, Valette J. Probing metabolite diffusion at ultra-short time scales in the mouse brain using optimized oscillating gradients and "short"-echo-time diffusion-weighted MRS. Nmr Biomed. 2017;30(1).
33. Valette J, Ligneul C, Marchadour C, Najac C, Palombo M. Brain Metabolite Diffusion from Ultra-Short to Ultra-Long Time Scales: What Do We Learn, Where Should We Go? Front Neurosci-Switz. 2018;12.
34. Palombo M, Ianus A, Guerreri M, et al. SANDI: A compartment-based model for non-invasive apparent soma and neurite imaging by diffusion MRI. Neuroimage. 2020;215:116835.
35. Ligneul C, Palombo M, Hernandez-Garzon E, et al. Diffusion-weighted magnetic resonance spectroscopy enables cell-specific monitoring of astrocyte reactivity in vivo. Neuroimage. 2019;191:457-469.
36. Ianus A, Alexander DC, Zhang H, Palombo M. Mapping complex cell morphology in the grey matter with double diffusion encoding MR: A simulation study. Neuroimage. 2021;241:118424.
Figures